Market Overview
| Study Period | 2020 - 2031 |
|---|---|
| Forecast Data Period | 2026 - 2031 |
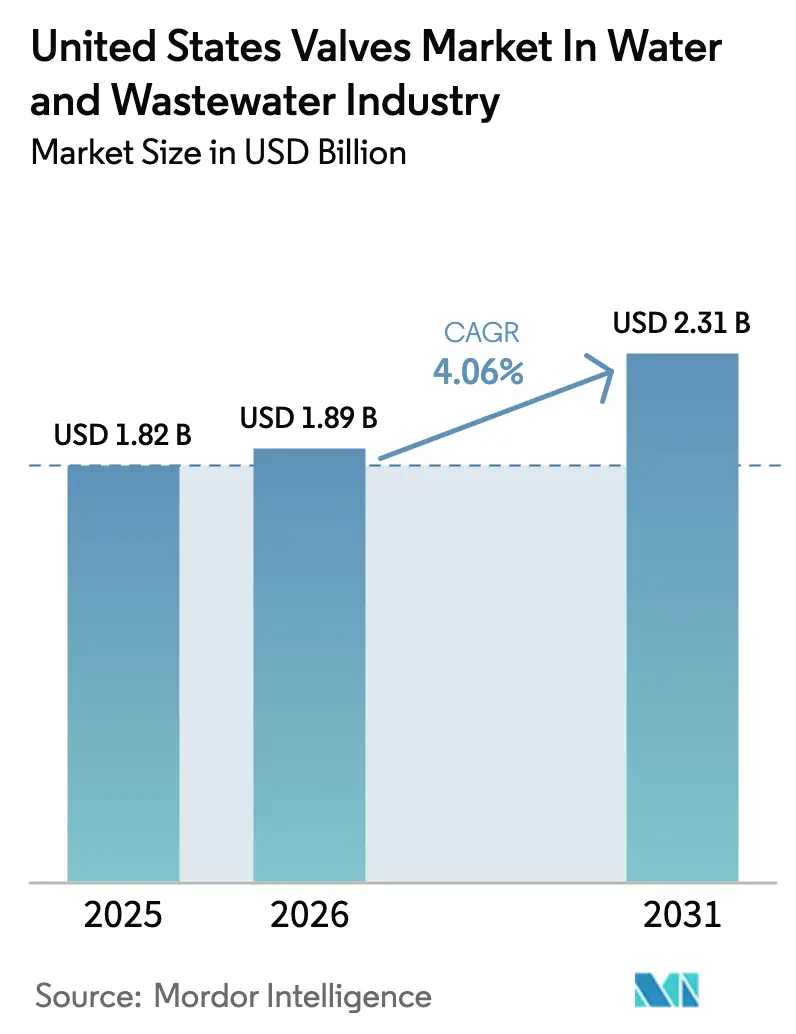
| Base Year Market Size (2025) | USD 1.82 Billion |
| Market Size (2026) | USD 1.89 Billion |
| Market Size (2031) | USD 2.31 Billion |
| Growth Rate (2026 - 2031) | 4.06% CAGR |
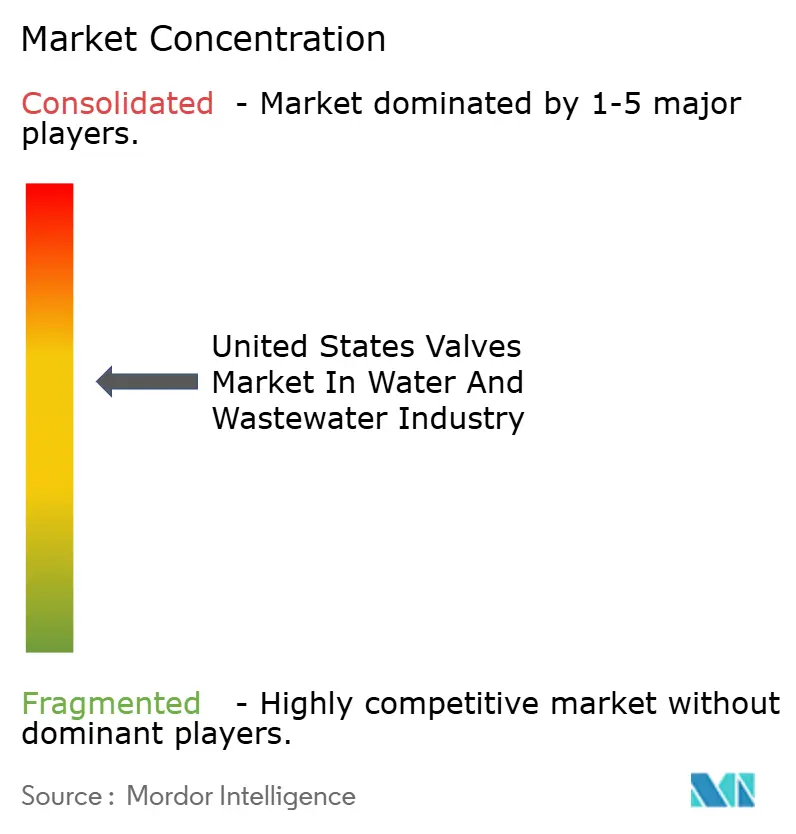
| Market Concentration | Medium |
Major Players *Disclaimer: Major Players sorted in no particular order Image © Mordor Intelligence. Reuse requires attribution under CC BY 4.0. | |
United States Water and Wastewater Valves Market Analysis by Mordor Intelligence
The United States valves market size in water and wastewater industry is expected to grow from USD 1.82 billion in 2025 to USD 1.89 billion in 2026 and is forecast to reach USD 2.31 billion by 2031 at 4.06% CAGR over 2026-2031. Federal infrastructure funding, a consistent replacement cycle for ageing mains, and the rising adoption of IIoT-enabled valves underpin demand momentum for the United States Water and Wastewater Valves Market. Intensifying climate-resilience investments, especially in flood-prone and drought-affected regions, introduces higher-specification requirements that lift average selling prices and encourage product innovation in the United States Water and Wastewater Valves Market. Manufacturers secure opportunities by offering Buy America-compliant products as WIFIA and bipartisan infrastructure bill allocations mandate domestic sourcing, while utilities accelerate specification of corrosion-resistant materials, thus reinforcing ductile iron and plastics shares in the United States Water and Wastewater Valves Market. Competitive intensity remains moderate because the Southern Valve and Fitting Company tariffs cushion domestic firms against low-cost Asian imports, yet price pressure persists in non-critical applications within the United States Water and Wastewater Valves Market.
Key Report Takeaways
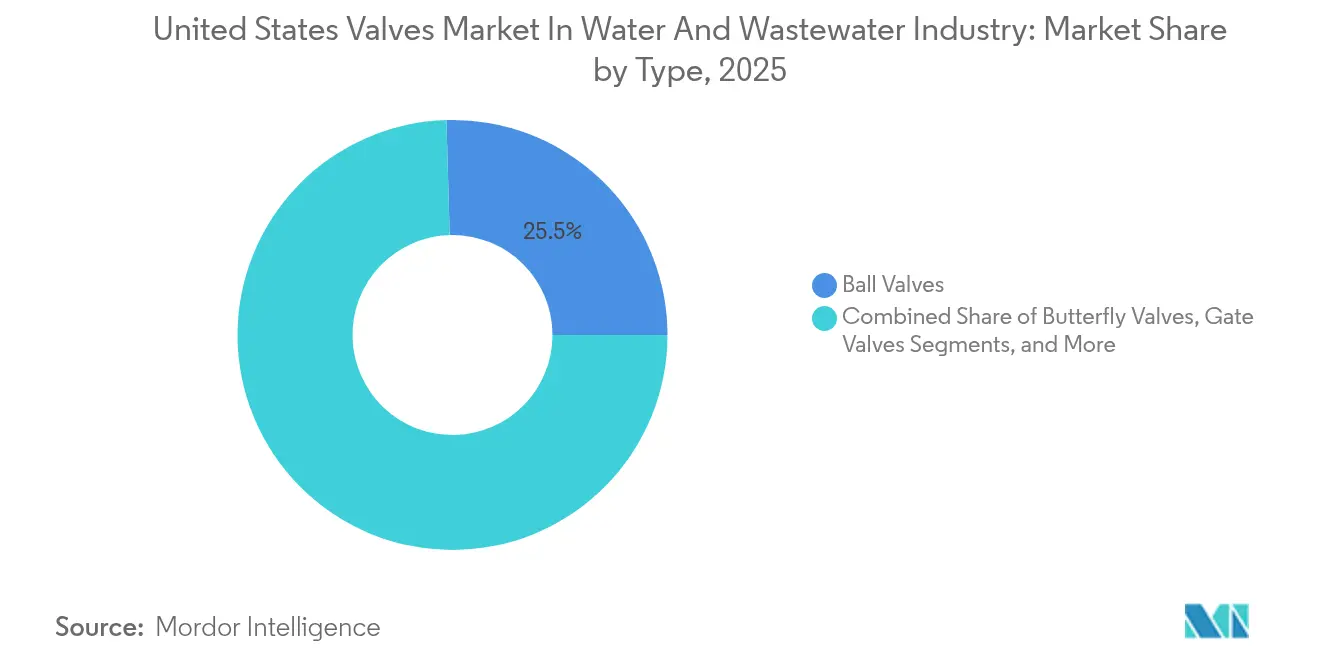
- By type, ball valves led with 25.45% of the United States Water and Wastewater Valves Market share in 2025, while automatic control valves are projected to record a 6.24% CAGR through 2031.
- By material, ductile iron accounted for 34.62% of the United States Water and Wastewater Valves Market in 2025; plastics are forecast to expand at a 5.95% CAGR to 2031.
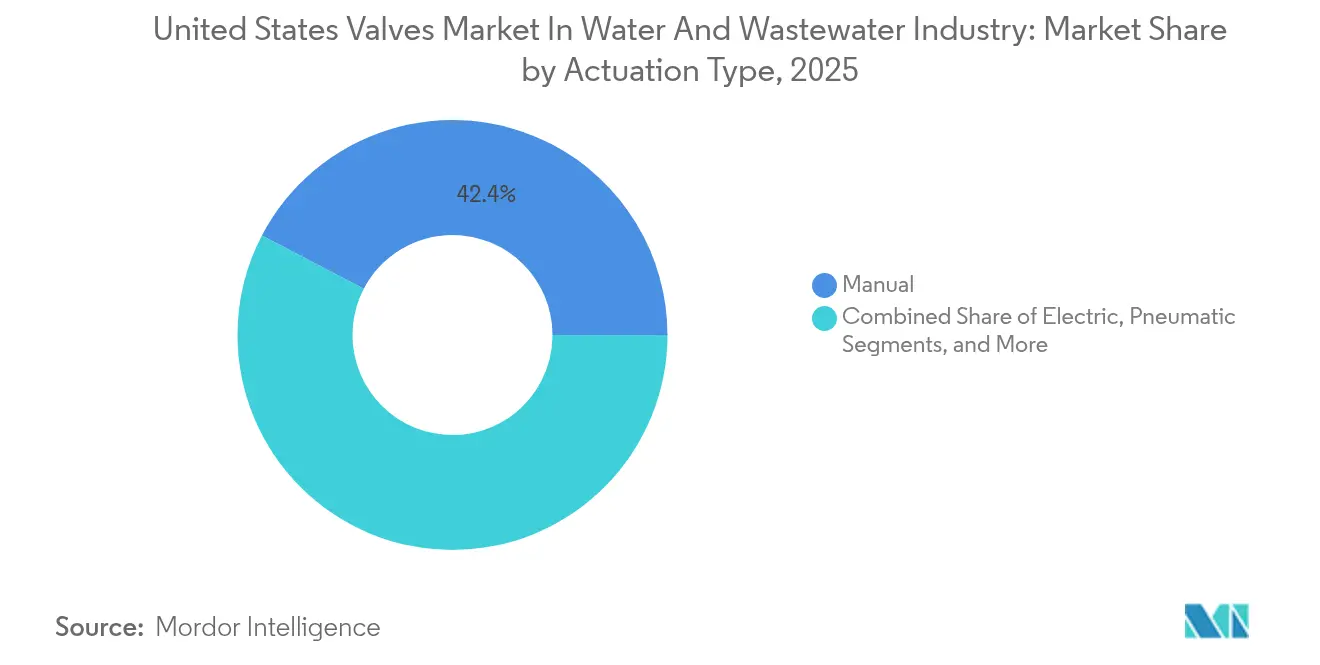
- By actuation type, manual systems held 42.35% of the United States Water and Wastewater Valves Market share in 2025, whereas IIoT-integrated solutions are advancing at a 6.10% CAGR through 2031.
- By end-user type, municipal utilities accounted for 55.85% of the United States valves market demand in water and wastewater industry in 2025, while the food and beverage segment is predicted to achieve a 6.05% CAGR by 2031.
- By size, the 4-8 inch category accounted for a 44.95% United States Water and Wastewater Valves Market share in 2025, and below-4-inch valves are set to grow at a 5.78% CAGR through 2031.
- By region, the Southeast captured 38.25% share of the United States Water and Wastewater Valves Market size in 2025 and the West is projected to post a 5.86% CAGR through 2031.
Note: Market size and forecast figures in this report are generated using Mordor Intelligence’s proprietary estimation framework, updated with the latest available data and insights as of 2026.
United States Water and Wastewater Valves Market Trends and Insights
Drivers Impact Analysis*
| Driver | (~) % Impact on CAGR Forecast | Geographic Relevance | Impact Timeline |
|---|---|---|---|
| Replacement of ageing municipal pipeline networks | +1.2% | National with emphasis on Northeast and Midwest | Long term (≥ 4 years) |
| EPA WIFIA low-interest loan expansion | +0.8% | National with priority for disadvantaged communities | Medium term (2-4 years) |
| IIoT-enabled real-time valve monitoring adoption | +0.6% | West and Southeast early adopters | Medium term (2-4 years) |
| Surge in climate-resilience investments | +0.5% | West, Southeast, Northeast | Long term (≥ 4 years) |
| Federal bipartisan infrastructure bill allocations | +0.7% | National with rural focus | Short term (≤ 2 years) |
| Untapped reuse-water projects in arid states | +0.4% | West and Southwest | Long term (≥ 4 years) |
| Source: Mordor Intelligence | |||


Replacement of Ageing Municipal Pipeline Networks
Water systems average 45 years of service, leading utilities to plan continuous rehabilitation programs that underpin valve procurement cycles in the United States Water and Wastewater Valves Market. The American Society of Civil Engineers estimates that cumulative water infrastructure needs will total USD 1 trillion through 2039, with valves accounting for approximately 15% of project costs.[1]American Society of Civil Engineers, “2021 Infrastructure Report Card,” infrastructurereportcard.org Cities in the Northeast and Midwest report valve failure rates 40% higher than the national mean, creating a steady demand for isolation and control products. Climate-induced freeze-thaw cycles accelerate degradation, shortening replacement intervals and prompting emergency purchase orders that favor suppliers with rapid deployment capabilities. These recurring needs anchor predictable revenue streams within the United States Water and Wastewater Valves Market.
EPA’s WIFIA Low-Interest Loan Expansion
The Environmental Protection Agency expanded WIFIA lending capacity to USD 15 billion in 2024, reducing financing costs by up to 30% and freeing municipal budgets for valve modernization programs. Disadvantaged communities stand to benefit, stimulating geographically distributed demand in the United States Water and Wastewater Valves Market. Buy America clauses benefit domestic manufacturers but compel utilities to reassess their sourcing strategies, resulting in temporary procurement delays. Higher-specification standards in WIFIA-funded projects lift average unit values by up to 25%, improving revenue quality for suppliers. The loan program’s multi-year pipeline provides visibility, supporting capacity planning among manufacturers.
IIoT-Enabled Real-Time Valve Monitoring Adoption
Utilities deploy sensors that transmit position, pressure, and temperature in real time, lowering unplanned outage frequency by up to 35%. California utilities have installed more than 12,000 smart valves, demonstrating early success cases for predictive maintenance. Premiums of 40-60% over conventional units are offset by lower field inspection costs, thus strengthening the business case. Vendors differentiate on cybersecurity features that align with NIST frameworks, enhancing adoption confidence in the United States Water and Wastewater Valves Market. Workforce constraints further accelerate demand because remote operation eases staffing pressures.
Surge in Climate-Resilience Investments (Flood and Drought)
Federal Emergency Management Agency grants totaling USD 3.5 billion in 2024 unlock funding for submersible and rapid-closure valves in flood mitigation projects.[2]Federal Emergency Management Agency, “Flood Mitigation Assistance Program,” fema.gov California’s USD 8.1 billion water resilience portfolio adds requirements for automated control valves in aquifer recharge and recycled water systems. These specifications often exceed standard design norms, commanding 25-35% price premiums. Manufacturers that offer corrosion-resistant alloys and reliable actuation under extreme environmental conditions secure a competitive edge in the United States Water and Wastewater Valves Market. Extended testing periods raise entry barriers, consolidating demand toward established suppliers.
Restraints Impact Analysis*
| Restraint | (~) % Impact on CAGR Forecast | Geographic Relevance | Impact Timeline |
|---|---|---|---|
| Intensifying low-cost imports from Asia | -0.9% | National with strong impact on price-sensitive utilities | Short term (≤ 2 years) |
| Price pressure from design-build-operate contracts | -0.6% | National concentration in metro areas | Medium term (2-4 years) |
| Skilled labor shortage for advanced actuation systems | -0.4% | National, most acute in rural utilities | Long term (≥ 4 years) |
| Lengthy NSF/ANSI certification timelines | -0.3% | National | Medium term (2-4 years) |
| Source: Mordor Intelligence | |||
Intensifying Low-Cost Imports from Asia
Imports grew to 35% of United States valve consumption in 2024, offering cost advantages of 40-50%.[3]American Supply Association, “Import Market Analysis 2024,” asa.net Tariffs of 125% on Chinese valves slow but do not halt market entry, sustaining price tension in the United States Water and Wastewater Valves Market. Some utilities adopt lower-cost options for non-critical lines, compelling domestic makers to emphasize lifecycle value and warranty coverage. Quality concerns and NSF compliance gaps limit import penetration into drinking-water applications, preserving a premium segment for accredited domestic suppliers.
Price Pressure from Design-Build-Operate Contracts
Design-build-operate delivery grew to 25% of large projects, shifting procurement toward integrated packages that secure 15-20% unit discounts through volume leverage. Contractors transfer performance risk through long warranties, favoring large manufacturers with nationwide service networks. Smaller firms face bonding and capability hurdles that restrict participation, which may gradually raise concentration within the United States Water and Wastewater Valves Market. Margin compression pushes vendors to generate revenue from aftermarket services and digital monitoring.
*Our forecasts treat driver/restraint impacts as directional, not additive. The impact forecasts reflect baseline growth, mix effects, and variable interactions.
Segment Analysis
By Type: Ball Valves Lead Despite Automation Surge
Ball valves held 25.45% of the United States valve market share in 2025 due to reliability and versatile operation. Automatic control valves are forecast to log a 6.24% CAGR, signaling rapid digitalization across utilities. Gate and butterfly valves sustain demand in large-diameter settings, while check valves remain essential for pump isolation in compact settings. Pressure relief valves gain incremental traction by addressing hydraulic surge events in climate-resilient networks within the United States Water and Wastewater Valves Market.
The shift toward smart, automatic control valves is driven by the need for remote monitoring and labor shortages, leading to premium pricing. Globe valves fulfill niche throttling requirements and maintain relevance where fine flow modulation is paramount. Strainers and specialty valves are adapted to water reuse applications, leveraging corrosion-resistant materials that match the chemistry of recycled water. Certification under NSF 61 ensures that all valve types meet potable standards; however, the approval timelines of 12-18 months slow down new product launches.


By Material: Plastics Challenge Traditional Metals
Ductile iron captured 34.62% of the United States valves market size in 2025, owing to durability and cost efficiency in buried mains. Plastic valves are projected to accelerate at a 5.95% CAGR, reflecting utilities’ preference for corrosion resistance and light weight during service line replacements. Stainless and carbon steels retain viability in high-pressure and elevated temperature operations. Advanced alloys serve corrosive coastal and chemical environments.
Lifecycle economics increasingly favor plastics, which deliver 30-40% longer service life in aggressive soils. Utilities weigh material compatibility with PFAS removal processes when specifying new assets in the United States Water and Wastewater Valves Market. Lighter polymers simplify installation in seismic zones and aging tunnels, widening adoption. However, limited pressure ratings in large diameters still justify the continued use of ductile iron and steel.
By End User Industry: Municipal Dominance with Food and Beverage Growth
Municipal utilities retained 55.85% demand in 2025, reflecting ongoing distribution upgrades. Food and beverage processors are forecast to post a 6.05% CAGR, spurred by expansions and stringent federal sanitation rules. Chemical and petrochemical plants require corrosion-resistant alloys, and power generation sites demand nuclear-grade specifications.
The food and beverage segment values sanitary designs and automated CIP capability, which drive higher unit prices. Municipal demand varies by region, aligning with differing replacement and growth priorities in the United States Water and Wastewater Valves Market. Industrial buyers increasingly request valves with integrated sensors that support production analytics and regulatory reporting.
By Actuation Type: Manual Systems Persist Despite Smart Growth
Manual actuation dominated with 42.35% United States valves market share in 2025 because of simplicity and low maintenance. IIoT-integrated electric, pneumatic, and hydraulic systems are expected to rise at a 6.10% CAGR as digital strategies mature. Electric actuators provide precision positioning, pneumatic drives support rapid cutoff functions, and hydraulic options handle heavy-duty, large-diameter valves.
Smart actuation platforms embed analytics that align with utility SCADA, satisfying cybersecurity protocols and delivering predictive maintenance benefits. Battery and solar power options address the challenges of remote locations. The workforce constraint accelerates adoption, as remote operation mitigates staffing shortages. Vendor support services, including cloud-based dashboards, add value in the United States Water and Wastewater Valves Market.
By Size (Diameter): Mid-Range Dominance with Small Valve Growth
Valves sized 4–8 inches represented 44.95% United States valve market share in 2025, fitting standard distribution pipelines. Valves with diameters below 4 inches are projected to grow at a 5.78% CAGR as utilities replace service lines and deploy smart meters. Sizes 8–12 inches support transmission mains, while above-12-inch valves serve treatment plant and intercity conveyance projects.
Smaller valves incorporate advanced controls for customer-side management and leak detection. Manufacturing innovations reduce the costs of complex small-diameter designs, encouraging broader installation. Large-diameter sales follow federal funding cycles and major plant upgrades, resulting in lumpy demand patterns within the United States Water and Wastewater Valves Market.
Geography Analysis
The Southeast region held a 38.25% share of the United States valves market size in 2025, reflecting population growth and industrial expansions in states such as Florida and Georgia. Cities, including Atlanta and Charlotte, initiated comprehensive network upgrades that require thousands of new valves annually. Industrial facilities in chemicals, food processing, and automotive contribute specialty requirements. Climate resilience projects addressing hurricanes demand submersible actuators and quick-close valves, supporting premium product uptake in the United States Water and Wastewater Valves Market.
The West region is expected to lead growth at a 5.86% CAGR through 2031, driven by California and its neighboring states' investments in reuse and desalination systems that require automated precision control. California utilities deployed over 12,000 smart valves in 2024 to manage drought-driven water loss mandates. Nevada, Arizona, and Colorado implement similar measures as part of their groundwater management and interstate water compacts, thereby broadening the demand for advanced materials capable of handling brine and chemically treated flows. Data-centric operations in the West promote early adoption of IIoT and predictive maintenance platforms.
Northeast, Midwest, and Southwest regions form the rest of the United States Water and Wastewater Valves Market. The Northeast prioritizes replacement of century-old cast-iron infrastructure, creating sustained orders for modern ductile iron and plastic valves. Midwest utilities address agricultural runoff by upgrading treatment processes that require precise flow control. The Southwest’s energy-led development, notably in Texas, fuels demand for valves capable of managing variable water quality and temperature extremes. Bipartisan infrastructure bill funding of USD 55 billion for water systems disperses capital toward rural and disadvantaged areas nationwide, supporting broader market stability.
Competitive Landscape
The United States Water and Wastewater Valves Market displays moderate concentration. Multinationals such as Emerson, Flowserve, and Crane compete with regional specialists that excel in local service. Leading firms pursue vertical integration to bundle hardware, software, and lifecycle services, creating recurring revenue and strengthening customer loyalty. Flowserve reported USD 1.14 billion in revenue for Q1 2025, with backlog growth that highlights robust demand for flow control across end markets.
Smart-valve and digital platform investments differentiate competitors. Vendors invest in cybersecurity features and data analytics to align with critical infrastructure protocols for utilities. Climate-resilient product lines, including submersible actuators and corrosion-resistant housings, emerge as white-space opportunities. Consolidation accelerated in 2024 with acquisitions, such as Georg Fischer's purchase of VAG Group, to bolster gate and butterfly offerings, signaling a trend toward scale and technological breadth.
Pricing pressure from imports continues, yet tariffs and Buy America rules shield domestic producers at the premium end. Manufacturers collaborate with automation partners to provide turnkey solutions that lower the total cost of ownership, making price discussions focus on lifecycle savings rather than upfront cost. Regional service networks remain essential because emergency repairs demand rapid onsite response, giving local distributors persistent relevance in the United States Water and Wastewater Valves Market.
United States Water and Wastewater Valves Industry Leaders
AMERICAN Cast Iron Pipe Company
American Valve Inc.
Ari Valve Corporation
Baker Hughes Company
Belimo Aircontrols (USA) Inc.
- *Disclaimer: Major Players sorted in no particular order

Recent Industry Developments
- August 2025: Flowserve posted strong Q3 results as water-sector modernization projects lifted demand for its valves and automation packages. A rising order backlog points to healthy momentum heading into 2026.
- July 2025: Emerson Electric reported solid growth in its automation solutions division for Q3, led by smart-valve offerings and IIoT platforms that help water utilities boost operational efficiency.
- March 2025: Viega brought its USD 200 million Ohio manufacturing plant fully online, adding advanced, highly automated capacity for plumbing and valve components to support rising North American infrastructure needs.
- February 2025: Municipal utilities in California, Texas, and Florida issued valve-replacement awards worth more than USD 150 million, channeling federal funds toward smart and climate-resilient technologies.
- January 2025: Flowserve’s Q1 revenue reached USD 1.14 billion, and a growing backlog signaled sustained appetite for flow-control equipment across water and wastewater projects.


United States Water and Wastewater Valves Market Report Scope
According to the study scope, the focus is on valves used in water distribution and wastewater treatment and disposal networks throughout the United States of America. The market values are the revenues accrued from the sale of valves in water and wastewater industry. Valve types considered under the scope are Ball Valves, Butterfly Valves, Gate Valves, Globe Valves, Check Valves, Pressure Relief Valves, Automatic Control Valves, Strainer Valves, and others. The market revenues are accrued from the overall valves in the United States of America.
United States Water and Wastewater Valves Market Market is segmented by Type (Ball Valves, Butterfly Valves, Gate Valves, Globe Valves, Check Valves, Pressure Relief Valves, Automatic Control Valves, Strainer Valves and Others), Material (Ductile Iron, Carbon Steel, Stainless Steel, Alloys, Plastics and Others), Actuation Type (Manual, Electric, Pneumatic, Hydraulic, and Smart / Automated), End User Industry (Municipal Utilities, Food and Beverage, Chemicals and Petrochemicals, Power Generation, and Other End User Industries), Size (Below 4 Inch, 4-8 Inch, 8-12 Inch and Above 12 Inch), and Region (Northeast, Southeast, Midwest, Southwest, and West). The Market Forecasts are Provided in Terms of Value (USD).
By Type
| Ball Valves |
| Butterfly Valves |
| Gate Valves |
| Globe Valves |
| Check Valves |
| Pressure Relief Valves (including PORV) |
| Automatic Control Valves |
| Strainer Valves and Others |
By Material
| Ductile Iron |
| Carbon Steel |
| Stainless Steel |
| Alloys (Duplex, Nickel) |
| Plastics (PVC, CPVC, HDPE) |
| Other Materials |
By Actuation Type
| Manual |
| Electric |
| Pneumatic |
| Hydraulic |
| Smart / Automated (IIoT-integrated) |
By End User Industry
| Municipal Utilities |
| Food and Beverage |
| Chemicals and Petrochemicals |
| Power Generation |
| Other End User Industries |
By Size (Diameter)
| Below 4 inch |
| 4 – 8 inch |
| 8 – 12 inch |
| Above 12 inch |
By Region
| Northeast |
| Southeast |
| Midwest |
| Southwest |
| West |
| By Type | Ball Valves |
| Butterfly Valves | |
| Gate Valves | |
| Globe Valves | |
| Check Valves | |
| Pressure Relief Valves (including PORV) | |
| Automatic Control Valves | |
| Strainer Valves and Others | |
| By Material | Ductile Iron |
| Carbon Steel | |
| Stainless Steel | |
| Alloys (Duplex, Nickel) | |
| Plastics (PVC, CPVC, HDPE) | |
| Other Materials | |
| By Actuation Type | Manual |
| Electric | |
| Pneumatic | |
| Hydraulic | |
| Smart / Automated (IIoT-integrated) | |
| By End User Industry | Municipal Utilities |
| Food and Beverage | |
| Chemicals and Petrochemicals | |
| Power Generation | |
| Other End User Industries | |
| By Size (Diameter) | Below 4 inch |
| 4 – 8 inch | |
| 8 – 12 inch | |
| Above 12 inch | |
| By Region | Northeast |
| Southeast | |
| Midwest | |
| Southwest | |
| West |


Key Questions Answered in the Report
How large is the U.S. valves space for water and wastewater applications in 2026?
It is valued at USD 1.89 billion, with projections pointing to USD 2.31 billion by 2031.
Which valve type currently holds the biggest share?
Ball valves lead with 25.45% share, favored for reliable isolation duties in municipal networks.
What compound annual growth rate is anticipated through 2031?
A 4.06% CAGR is forecast, reflecting steady infrastructure spending and digital-control upgrades.
Which region is expected to see the fastest expansion over the next five years?
The West is projected to grow at a 5.86% CAGR, supported by California-led reuse and drought resilience programs.
Why are plastic valves gaining traction over traditional metals?
Corrosion resistance, lighter weight, and lower installation costs drive plastics to a 5.95% CAGR, the fastest among material categories.
How does federal funding influence demand for valves?
Programs such as WIFIA and the Infrastructure Investment and Jobs Act accelerate municipal replacements, raising specification standards and boosting domestic orders.
Page last updated on:


