Industrial Distribution Market Size and Share
Market Overview
| Study Period | 2020 - 2031 |
|---|---|
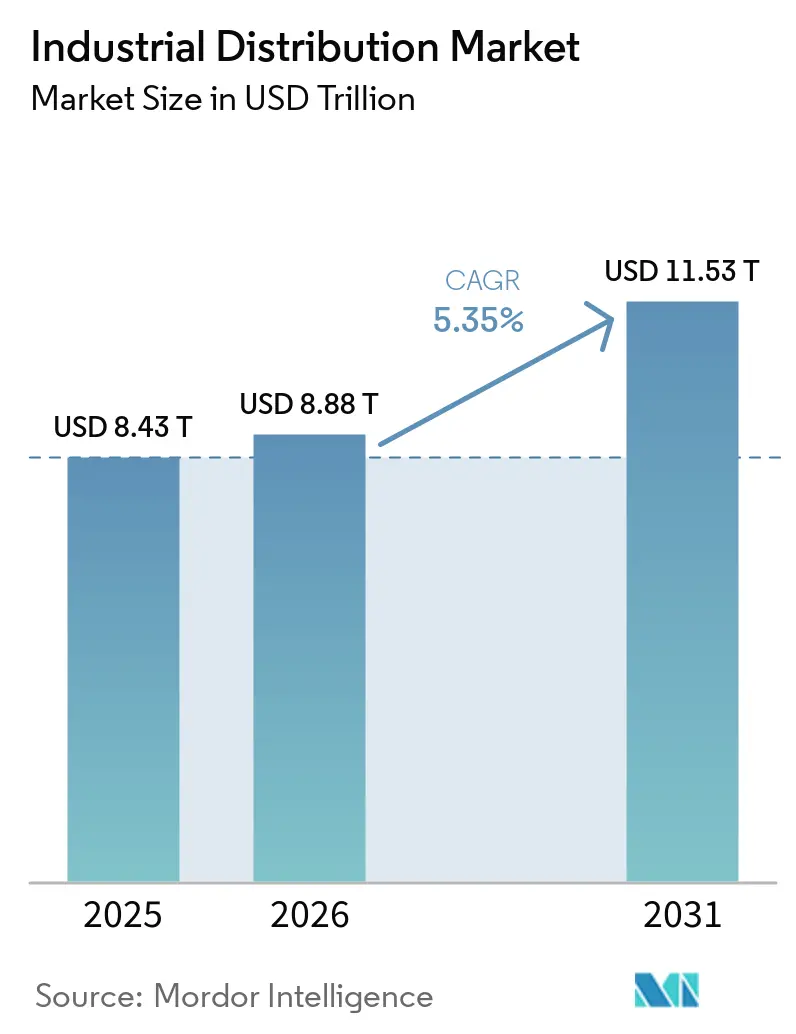
| Market Size (2026) | USD 8.88 Trillion |
| Market Size (2031) | USD 11.53 Trillion |
| Growth Rate (2026 - 2031) | 5.35% CAGR |
| Fastest Growing Market | Asia Pacific |
| Largest Market | Asia Pacific |
| Market Concentration | Low |
Major Players *Disclaimer: Major Players sorted in no particular order Image © Mordor Intelligence. Reuse requires attribution under CC BY 4.0. | |
Industrial Distribution Market Analysis by Mordor Intelligence
The industrial distribution market size was valued at USD 8.43 trillion in 2025 and estimated to grow from USD 8.88 trillion in 2026 to reach USD 11.53 trillion by 2031, at a CAGR of 5.35% during the forecast period (2026-2031). Higher spending on factory automation, tighter safety regulations, and the rapid shift toward digital procurement channels continue to reinforce demand momentum. Manufacturers allocated AI and machine-learning budgets to improve production up-time, and distributors responded by adding predictive inventory tools that shorten lead times. Large infrastructure pipelines across energy, data-center, and transport projects sustain orders for electrical and construction supplies. Meanwhile, cost inflation in logistics and commodities prompts wider adoption of vendor-managed inventory and regional fulfillment hubs to preserve service levels. Competitive intensity rises as digital-native players introduce API-based auto-replenishment that challenges legacy branch-centric models.
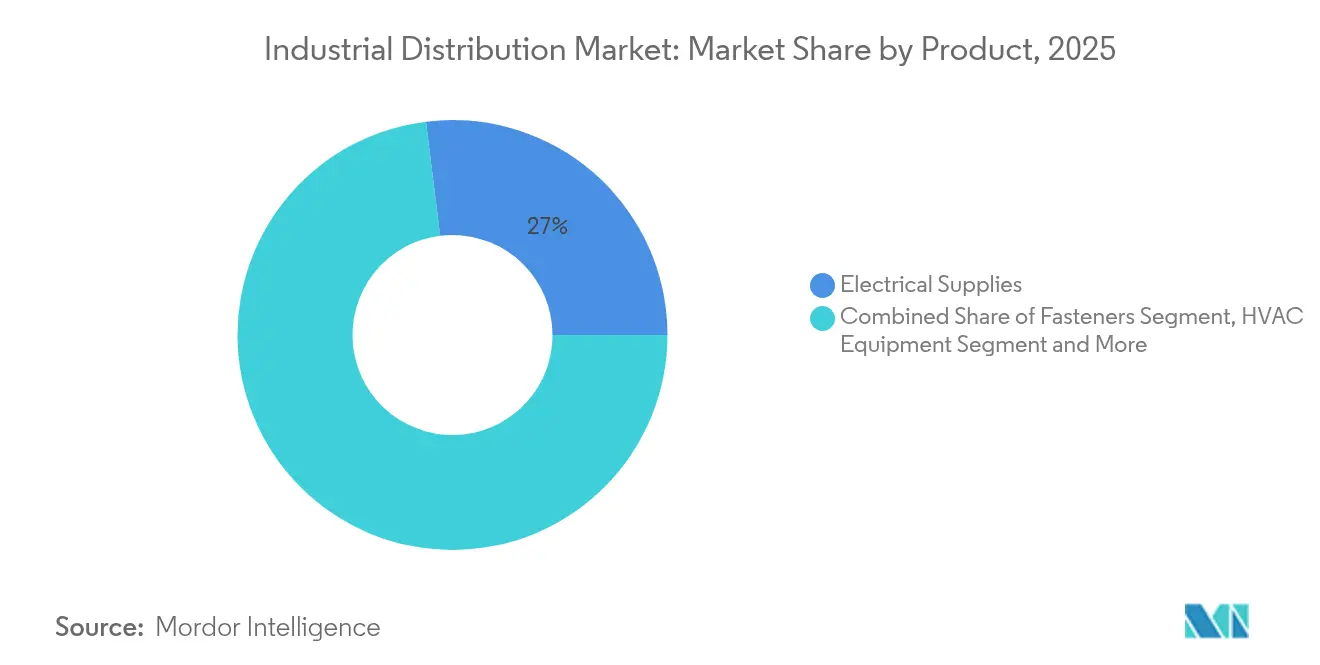
- By product type, electrical supplies led with 26.97% revenue share in 2025, while safety and PPE recorded the fastest 9.38% CAGR to 2031.
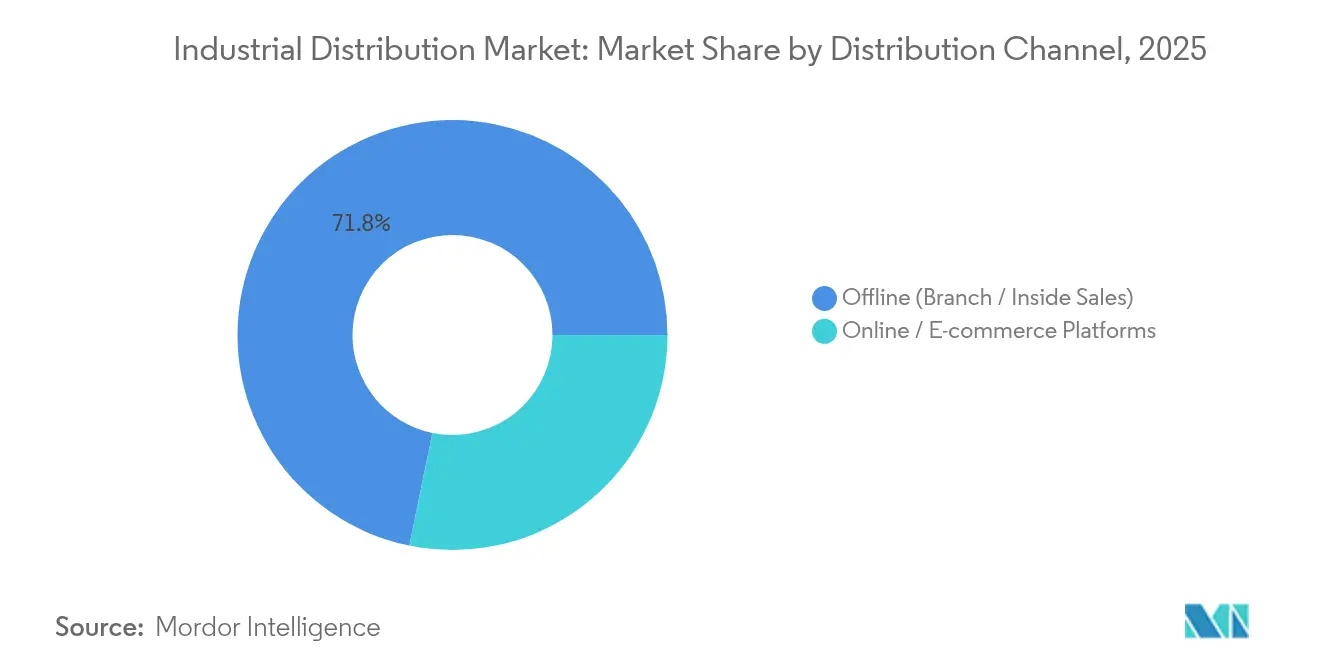
- By distribution channel, offline branch and inside sales accounted for 71.78% of the industrial distribution market share in 2025, whereas e-commerce platforms are expanding at an 8.18% CAGR through 2031.
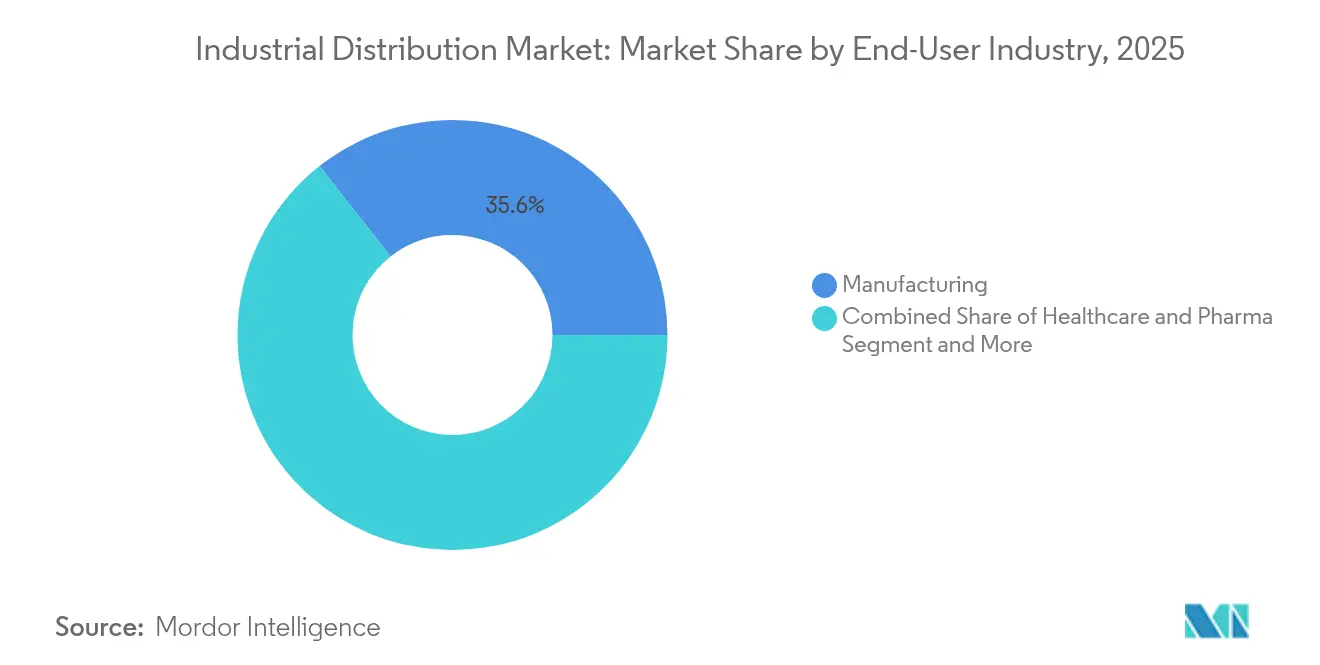
- By end-user industry, manufacturing held 35.62% of the industrial distribution market size in 2025, yet healthcare and pharmaceuticals deliver a 6.63% CAGR to 2031.
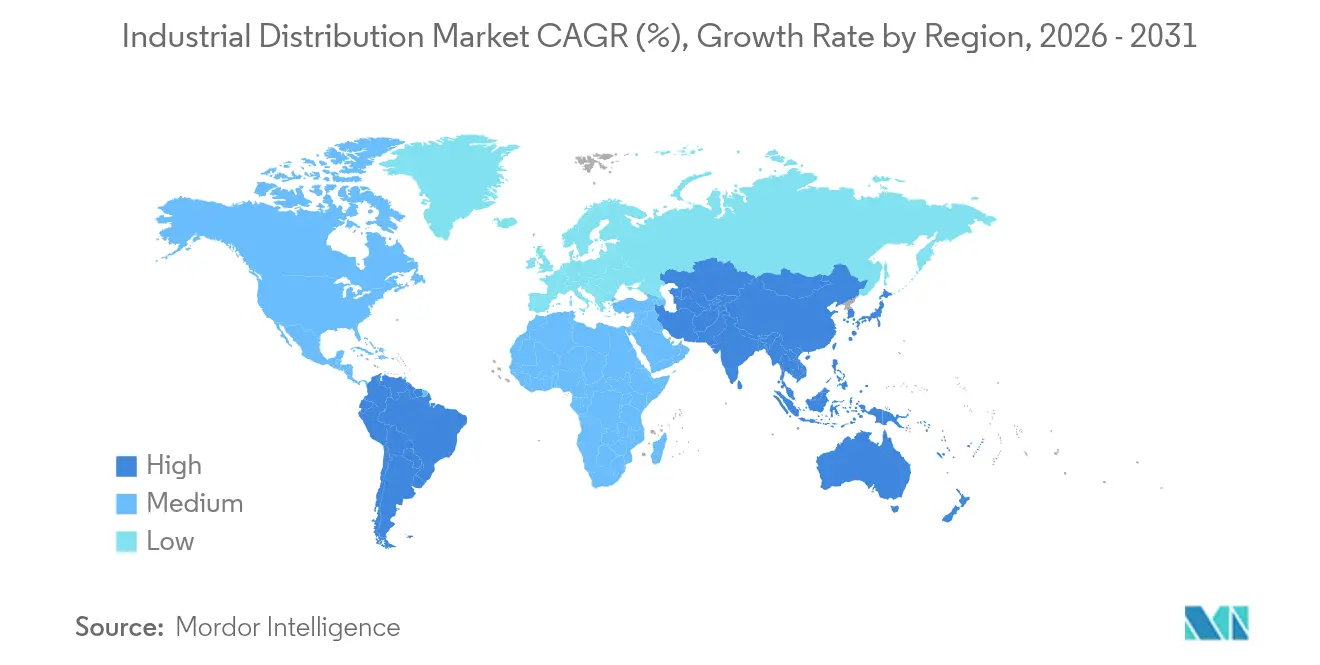
- By region, Asia-Pacific captured 36.21% revenue share in 2025 and is projected to grow at 8.55% CAGR over the forecast period.
Note: Market size and forecast figures in this report are generated using Mordor Intelligence’s proprietary estimation framework, updated with the latest available data and insights as of 2026.
Global Industrial Distribution Market Trends and Insights
Drivers Impact Analysis*
| Driver | (~) % Impact on CAGR Forecast | Geographic Relevance | Impact Timeline |
|---|---|---|---|
| Industrial IoT and automation adoption | +1.2% | Global with Asia-Pacific and North America leading | Medium term (2-4 years) |
| Infrastructure megaproject pipelines | +0.8% | Global, concentrated in Asia-Pacific and Middle East | Long term (≥ 4 years) |
| E-commerce-led MRO fulfillment boom | +0.7% | Global with North America and Europe early adopters | Short term (≤ 2 years) |
| Stricter workplace-safety regulations | +0.5% | Global with EU and North America most stringent | Medium term (2-4 years) |
| OEM-distributor API-based auto-replenishment | +0.4% | North America and Europe expanding to Asia-Pacific | Medium term (2-4 years) |
| Carbon border adjustments push regional inventory hubs | +0.3% | EU primary with spillover to trading partners | Long term (≥ 4 years) |
| Industrial IoT and automation adoption | +1.2% | Global with Asia-Pacific and North America leading | Medium term (2-4 years) |
| Source: Mordor Intelligence | |||
Industrial IoT and automation adoption
Real-time asset monitoring enables distributors to shift from reactive order fulfillment to data-driven replenishment services. Edge computing paired with predictive analytics cuts unplanned downtime and aligns stocking levels with machine health signals. Siemens’ industrial foundation models illustrate how generative AI shortens engineering cycles and unlocks service revenue for distributors who bridge OEM platforms with factory users.[1]Press Release, “Siemens Introduces Industrial Foundation Models,” Siemens, siemens.com Investments in connected sensors also pull through demand for high-precision electrical components and secure networking gear.
Infrastructure megaproject pipelines
A USD 2 trillion project slate in the United States and USD 1.5 trillion earmarked by China for smart infrastructure are translating into bulk orders for power cables, switchgear, and construction consumables.[2]Editorial Team, “AI-Driven Infrastructure Demand Lifts Q1 Sales,” Wesco International, investors.wesco.com Distributors with project-management support and just-in-time delivery capabilities win large supply contracts. Southeast Asia adds momentum as governments accelerate airport, rail, and renewable energy builds, which favor distributors offering regional inventory and technical assistance.
E-commerce-led MRO fulfillment boom
Digital marketplaces reduce transaction costs by up to 90% when automated catalog search, AI-driven cross-selling, and point-of-use scanning replace manual requisitions. Grainger targets 80% of sales through digital channels, mirrored by MonotaRO whose 120 billion yen revenue underscores scale advantages of pure-play online models.[3]Investor Relations, “MonotaRO FY 2024 Results,” MonotaRO, corp.monotaro.com API connectivity to customer ERP systems lifts order frequency and enhances retention.
Stricter workplace-safety regulations
OSHA’s enhanced enforcement is elevating recurring demand for gloves, respirators, and smart PPE with sensor alerts. Distributors bundle compliance software that automates reorder points and audit trails, strengthening long-term customer relationships. Post-pandemic hygiene norms sustain elevated consumption across manufacturing, logistics, and healthcare settings.
Restraints Impact Analysis*
| Restraint | (~) % Impact on CAGR Forecast | Geographic Relevance | Impact Timeline |
|---|---|---|---|
| Commodity-price volatility | -0.6% | Global with resource-dependent regions most affected | Short term (≤ 2 years) |
| Global logistics cost inflation | -0.4% | Global with island and landlocked regions most impacted | Medium term (2-4 years) |
| OEM risk-sharing contracts squeeze margins | -0.3% | North America and Europe | Medium term (2-4 years) |
| OEM direct e-commerce channel cannibalization | -0.2% | Global with mature markets higher impact | Long term (≥ 4 years) |
| Source: Mordor Intelligence | |||
Commodity-price volatility
Steel prices can fluctuate 15-20% within a quarter, forcing dynamic pricing and hedge strategies to avoid inventory write-downs. Customers delay orders when prices fall, inflating distributor stock and tying up cash. Energy price swings further complicate freight budgeting and demand planning.
Global logistics cost inflation
United States logistics outlays reached USD 2.58 trillion in 2024, equating to 8.8% of GDP. Driver shortages, port congestion, and higher fuel costs raise total landed costs. Distributors respond with warehouse robotics and regional fulfillment centers that shorten last-mile distances yet require significant capital.
*Our forecasts treat driver/restraint impacts as directional, not additive. The impact forecasts reflect baseline growth, mix effects, and variable interactions.
Segment Analysis
By Product: Electrical supplies drive infrastructure modernization
Electrical supplies contributed 26.97% of 2025 revenue, confirming their importance in power grid upgrades and data-center builds. The industrial distribution market size for electrical supplies is expected to climb steadily as renewable energy connections and factory automation lift unit demand. Safety and PPE products, growing at 9.38% CAGR, benefit from global safety mandates and corporate risk mitigation, while industrial fasteners and HVAC equipment ride steady construction starts and infrastructure upgrades.
Material-handling systems are attracting investment as e-commerce fulfillment pushes warehouses toward automation. Bearings and power-transmission parts see resilient MRO demand tied to predictive maintenance schedules. Lubricants face substitution by synthetics with longer drain intervals, yet digital condition-monitoring still spurs timely replenishment. Connected tools and instruments blend mechanical precision with cloud analytics, widening distributor service scopes.


By Distribution Channel: Digital momentum accelerates
Branch and inside sales channels held 71.78% share in 2025. Field engineers rely on local stock, application advice, and credit terms that online platforms alone cannot replicate. Yet e-commerce grows at 8.18% CAGR as mobile ordering and AI recommendations quicken procurement cycles. The industrial distribution market benefits when hybrid models combine click-and-collect, branch counter service, and vendor-managed inventory.
API-based auto-replenishment trims manual ordering errors and boosts fill rates by 5-8%. Distributors integrating seamlessly with customer ERP environments experience higher customer lifetime value. Mobile apps with barcode scanning empower technicians to reorder on-site, reinforcing digital engagement while maintaining policy compliance.
By End-User Industry: Manufacturing leadership meets healthcare disruption
Manufacturing remained the top buyer with 35.62% share, supported by continual maintenance needs and Industry 4.0 retrofits. The industrial distribution market share for manufacturing is expected to moderate as healthcare and pharmaceuticals expand at 6.63% CAGR. Cleanroom protocols and regulatory oversight push hospitals and drug makers to source specialized consumables from knowledgeable distributors.
Construction retains a solid base driven by megaproject pipelines, whereas utilities modernize grids and storage assets, creating demand for high-voltage components. Mining companies require rugged PPE and heavy equipment spares, while the chemicals sector seeks corrosion-resistant fittings to meet emission rules. Across sectors, the convergence of IoT and analytics raises expectations for distributors to deliver both products and data-enabled services.
Geography Analysis
Asia-Pacific held 36.21% revenue in 2025 and is set to compound at 8.55% CAGR through 2031 on the back of USD 10 trillion in Chinese manufacturing output and India’s double-digit chemicals expansion. Growing regional supply-chain diversification into Southeast Asia strengthens cross-border distribution flows. Local distributors gain advantage from multilingual support and familiarity with varying regulatory codes.
North America represents a mature yet innovation-driven arena. Grainger’s USD 17.2 billion 2024 sales underscore scale efficiencies and the region’s appetite for e-commerce-enabled procurement. Manufacturers’ 85% AI adoption plans lift demand for connected components, while infrastructure legislation channels capital into grid and broadband upgrades. Commodity swings and freight inflation motivate reshoring and regional warehousing.
Europe faces transformational policy pressures. The Carbon Border Adjustment Mechanism will raise imported steel costs by about 16.19% per ton by 2026, prompting distributors to stock regionally and source lower-emission materials. Sonepar’s USD 2 billion acquisition spree in 2024 highlights ongoing consolidation aimed at scale gains and broader service portfolios. Sustainability goals spur interest in energy-efficient products and circular-economy offerings.
The Middle East and Africa record incremental gains from industrial diversification plans, while Latin America draws spending into mining infrastructure and auto manufacturing. Currency volatility and political instability remain watchpoints, but long-term infrastructure gaps present growth headroom for distributors with robust risk-management capabilities.

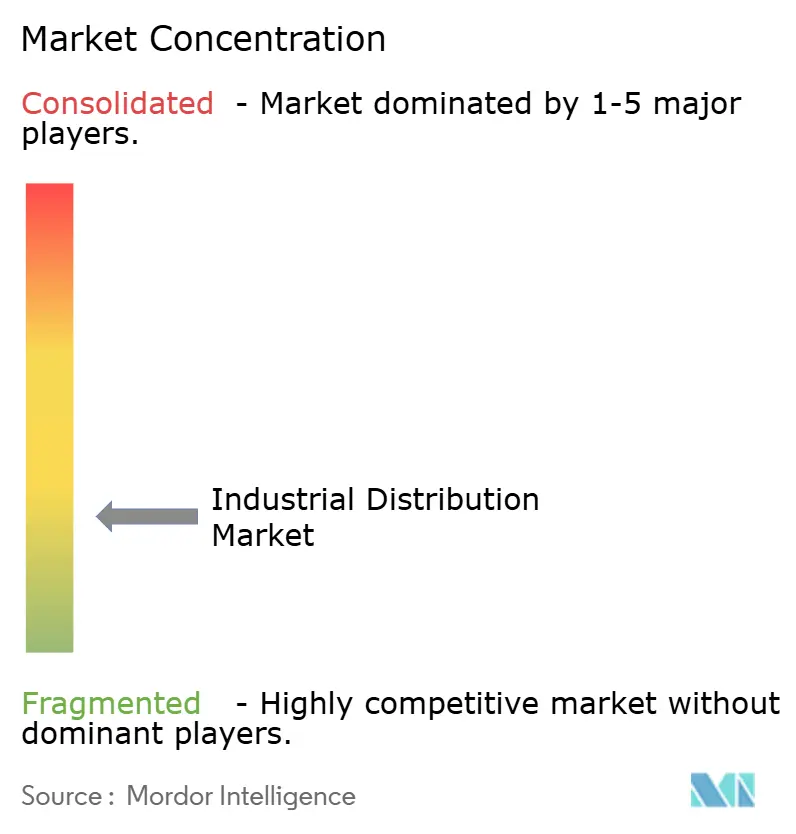
Competitive Landscape
The industrial distribution market is moderately fragmented. Global leaders rely on technology investment and acquisition to defend share, while digital-native entrants offer low-touch self-service models. Electrical distribution shows higher consolidation thanks to WESCO’s USD 5.34 billion Q1 2025 revenue and Sonepar’s acquisitions which strengthen category leadership. MRO supplies remain distributed among regional specialists, keeping barriers to entry relatively low.
Strategic moves focus on digital enablement. Grainger targets 80% digital sales, Fastenal deploys smart vending machines, and Rockwell Automation embeds AI into control systems. Platform-based ecosystems emerge, enabling distributors to orchestrate OEMs, service firms, and end users within a unified procurement and data-exchange environment. White-space opportunities include renewable energy components, sensor-enabled PPE, and blockchain-verified supply chains.
Operational excellence hinges on AI-driven demand forecasting, warehouse robotics, and real-time shipment visibility. AI can cut distributor inventory up to 30% while trimming logistics costs by 5-20%, enhancing profitability for early adopters. Long-term winners will be those able to combine product breadth with predictive service models that lock in customers through data insights rather than price concessions.
Industrial Distribution Industry Leaders
W.W. Grainger, Inc.
Fastenal Company
WESCO International Inc.
MSC Industrial Direct Co. Inc.
Rexel Group
- *Disclaimer: Major Players sorted in no particular order

Recent Industry Developments
- May 2025: MonotaRO held a groundbreaking ceremony for its Mito Distribution Center, designed for 300,000 daily order lines and 500,000-item storage, tripling productivity through advanced automation.
- May 2025: MonotaRO reported 11.9% year-on-year sales growth in May 2025 driven by wider product coverage and technology investments.
- June 2025: Grainger disclosed plans for a 530,000-square-foot distribution center at the Port of Portland’s Gresham Vista Business Park to expand capacity in the Pacific Northwest.
- March 2025: Fastenal opened a new regional distribution center in Dallas, Texas, equipped with automation to improve delivery speed across the southern United States.


Research Methodology Framework and Report Scope
Market Definitions and Key Coverage
Our study defines the industrial distribution market as all revenues earned when full-line and specialty distributors move MRO supplies, production equipment, safety gear, and related industrial inputs from manufacturers to business end users through branch networks, inside sales, and digital storefronts. Inventory services, kitting, and light repairs are counted because they are invoiced with the product flow. According to Mordor Intelligence, this market generated USD 8.43 trillion in 2025 and is on track to approach USD 10.99 trillion by 2030.
Scope exclusion: Retail hardware chains, parcel couriers, and pure software marketplaces fall outside the study.
Segmentation Overview
- By Product
- Electrical Supplies
- Fasteners
- HVAC Equipment
- Safety and PPE Supplies
- Material Handling and Packaging
- Power Transmission and Bearings
- Industrial Fluids and Lubricants
- Tools and Instruments
- Other Products
- By Distribution Channel
- Offline (Branch / Inside Sales)
- Online / E-commerce Platforms
- By End-user Industry
- Manufacturing
- Construction and Infrastructure
- Energy and Utilities
- Mining and Metals
- Chemicals and Process
- Transportation and Warehousing
- Healthcare and Pharmaceuticals
- Others
- By Geography
- North America
- United States
- Canada
- Mexico
- South America
- Brazil
- Argentina
- Rest of South America
- Europe
- United Kingdom
- Germany
- France
- Italy
- Spain
- Russia
- Rest of Europe
- Asia-Pacific
- China
- India
- Japan
- South Korea
- Australia and New Zealand
- Southeast Asia
- Rest of Asia-Pacific
- Middle East and Africa
- Middle East
- Saudi Arabia
- United Arab Emirates
- Turkey
- Rest of Middle East
- Africa
- South Africa
- Nigeria
- Kenya
- Rest of Africa
- Middle East
- North America
Detailed Research Methodology and Data Validation
Primary Research
Phone interviews and concise surveys with branch managers, procurement heads, and e-commerce directors across North America, Europe, and Asia validate average order size, online penetration, and category momentum. Follow-up calls with supply-chain advisers clarify scenario levers before figures are locked.
Desk Research
We started by extracting wholesale turnover, product splits, and regional mixes from tier-1 public datasets such as the U.S. Census Wholesale Trade Survey, Eurostat PRODCOM tables, China Statistical Yearbook, and ITC trade flows, which frame the value pool and show shifts in branch density and import reliance.
Company 10-Ks, trade association factbooks (ISA, NAW), and news on Dow Jones Factiva refine pricing ladders, while distributor financials from D&B Hoovers keep blended margins realistic. Patent counts from Questel and Volza shipment data reveal emerging product niches. The list is illustrative, not exhaustive, of the evidence base consulted.
Market-Sizing & Forecasting
We rebuild the market top-down from wholesale revenue and industrial production indices, then pressure-test it with selective bottom-up roll-ups of distributor sales samples and ASP × volume checks. Key fingerprints, purchasing managers' index levels, branch count, online order share, manufacturing capacity use, and median gross-margin shifts explain volume and price swings.
Multivariate regression blended with ARIMA smoothing projects each driver through 2030. Gaps in bottom-up grids are bridged with nearest-neighbor region analogs confirmed during expert follow-ups.
Data Validation & Update Cycle
Mordor analysts triangulate outputs against independent indicators, investigate variances, and secure senior review before sign-off. The dataset refreshes annually, with interim updates triggered by major M&A, tariff moves, or technology shifts, so clients always see the latest view.
Why Mordor's Industrial Distribution Baseline Earns Trust
Published estimates diverge because firms select different product baskets, geographic mixes, and forecast cadences. We surface those contrasts so decision-makers know exactly what they are comparing.
Key gaps often stem from regional splits, whether services are counted, treatment of e-commerce, and refresh frequency.
Benchmark comparison
| Market Size | Anonymized source | Primary gap driver |
|---|---|---|
| USD 8.43 T (2025) | Mordor Intelligence | - |
| USD 7.86 T (2024) | Global Consultancy A | North America-only scope, service revenue omitted |
| USD 8.41 T (2024) | Trade Journal B | Combines warehousing with distribution, inflating base |
| USD 8.15 T (2024) | Research Firm C | Holds margin and branch counts static through forecast |
Side-by-side, Mordor's balanced scope, transparent variables, and yearly refresh create a dependable baseline that planners can act on with confidence.


Key Questions Answered in the Report
What is the current size of the industrial distribution market?
The industrial distribution market stands at USD 8.88 trillion in 2026 and is projected to reach USD 11.53 trillion by 2031 at a 5.35% CAGR.
Which region leads the industrial distribution market?
Asia-Pacific holds the largest share at 36.21% and also shows the fastest 8.55% CAGR through 2031.
How important is e-commerce to industrial distribution?
E-commerce is the fastest-growing channel with an 8.18% CAGR, driven by API-based auto-replenishment, mobile ordering, and AI product discovery.
Which product category generates the most revenue?
Electrical supplies dominate with 26.97% revenue share thanks to power grid upgrades and data-center expansion.
Why are safety and PPE supplies growing quickly?
Tighter workplace-safety regulations and post-pandemic hygiene protocols push safety and PPE supplies to a 9.38% CAGR.
Page last updated on:


