
Technology, Media and Telecom
5th MayPricing Strategy for Semiconductor Components
3 Min Read
The Industrial Ethernet Market Report is Segmented by Offering (Hardware, Software, and Services), Protocol (EtherNet/IP, PROFINET, Ethercat, and More), Type (Managed Switches and Unmanaged Switches), Industry Vertical (Automotive, Aerospace and Defense, Electrical and Electronics, Energy and Utilities, and More), and Geography.
Market Overview
| Study Period | 2020 - 2031 |
|---|---|
| Market Size (2026) | USD 12.12 Billion |
| Market Size (2031) | USD 18.44 Billion |
| Growth Rate (2026 - 2031) | 8.74 % CAGR |
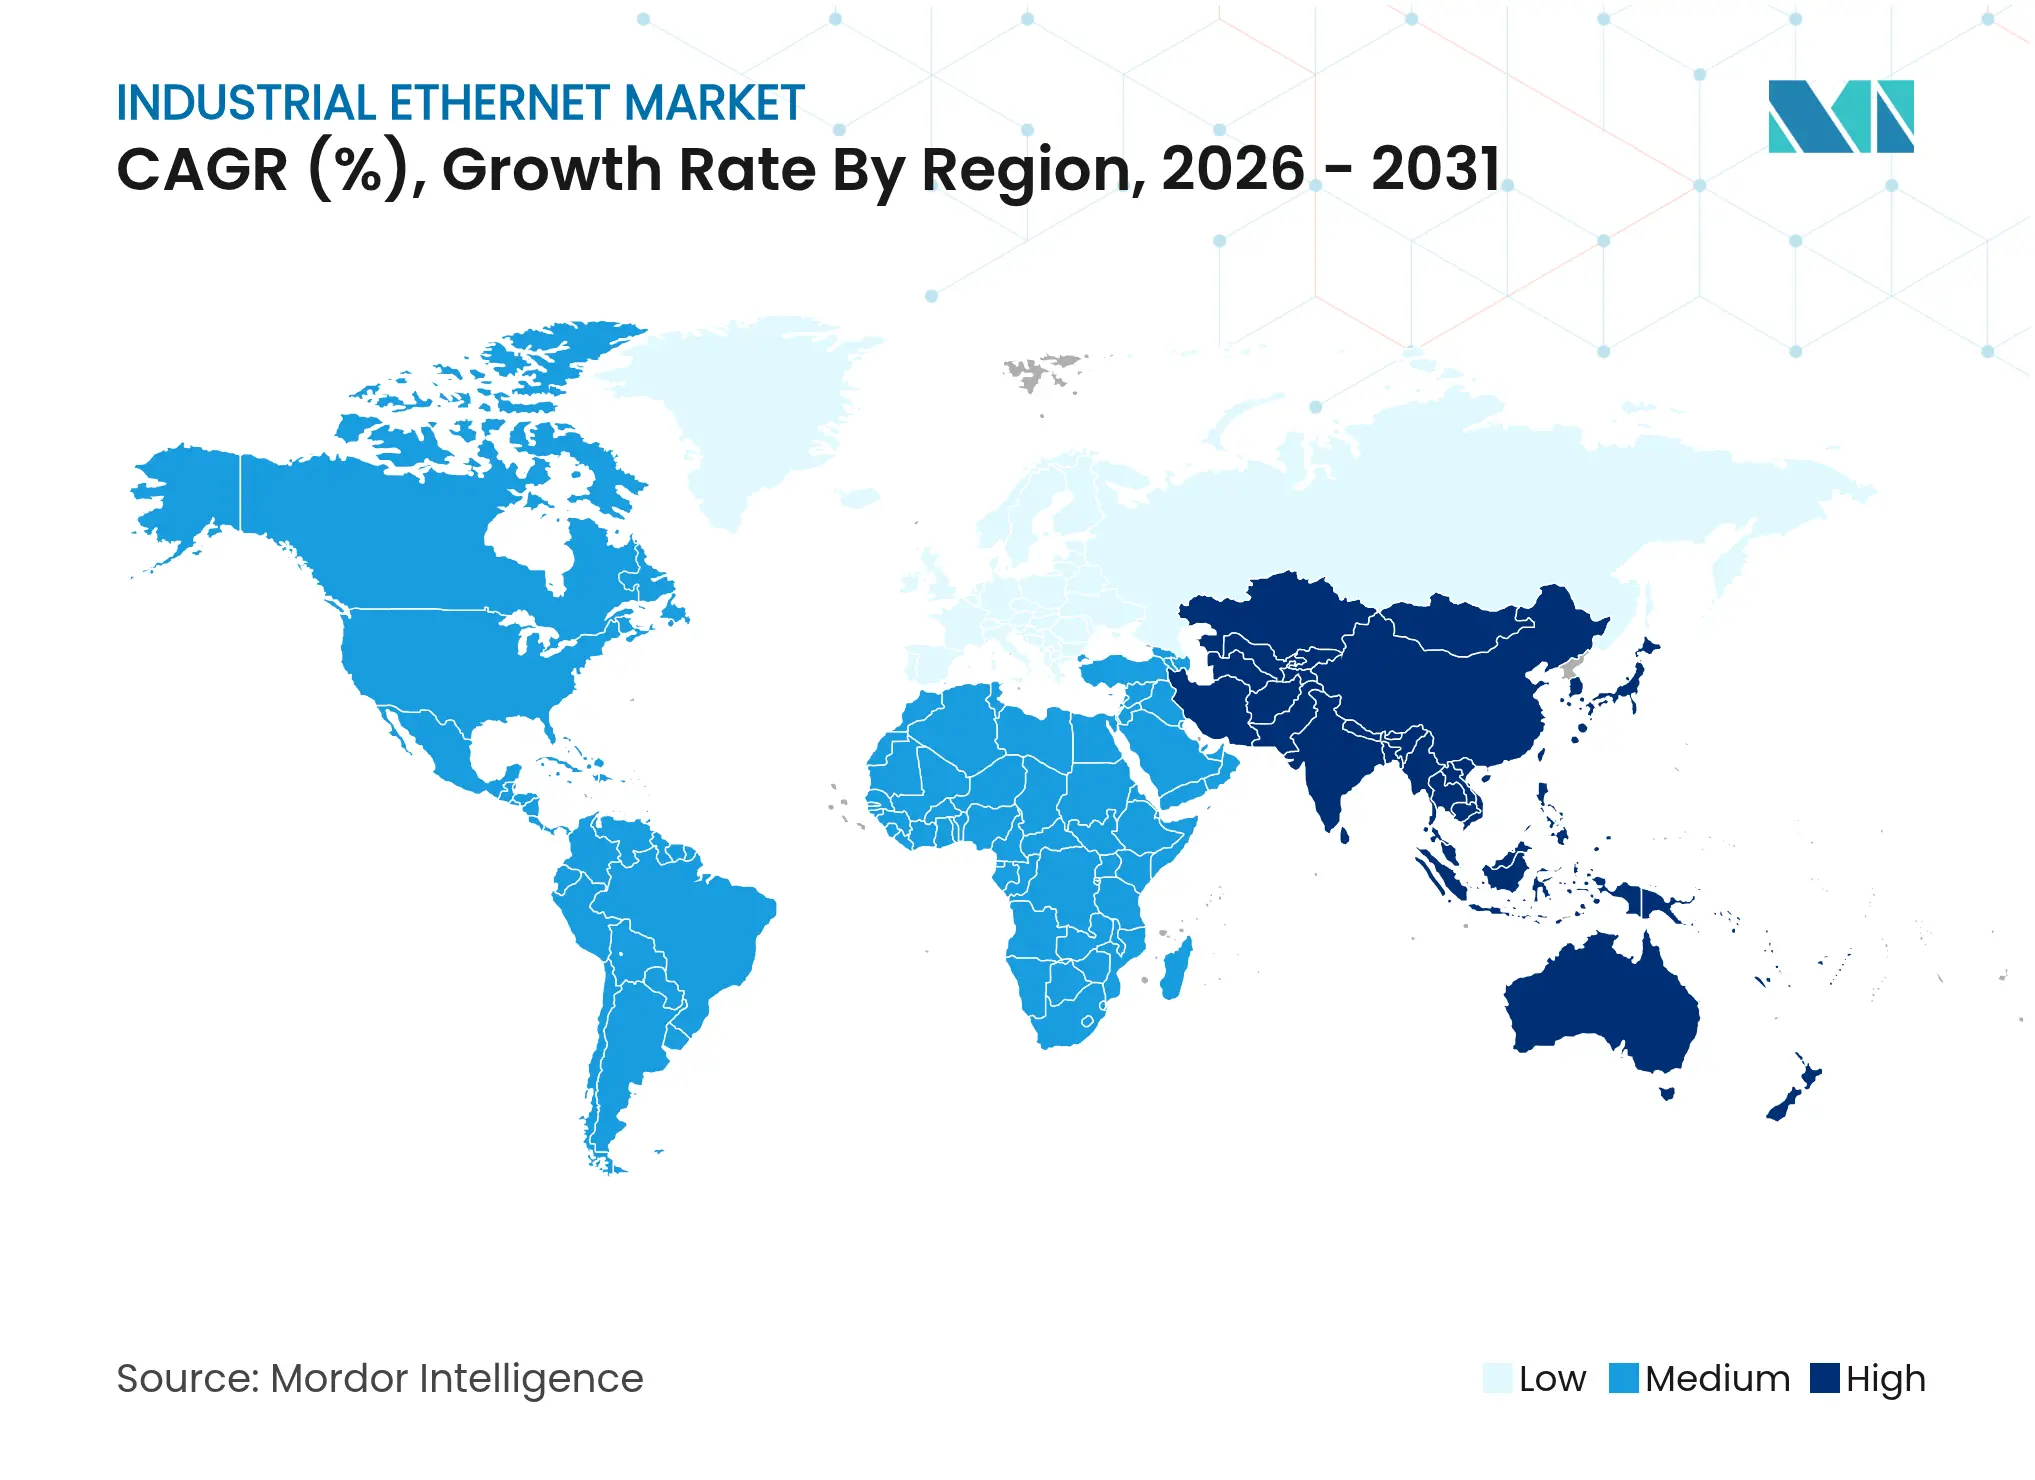
| Fastest Growing Market | Asia Pacific |
| Largest Market | North America |
| Market Concentration | Medium |
Major Players*Disclaimer: Major Players sorted in no particular order. Image © Mordor Intelligence. Reuse requires attribution under CC BY 4.0. |
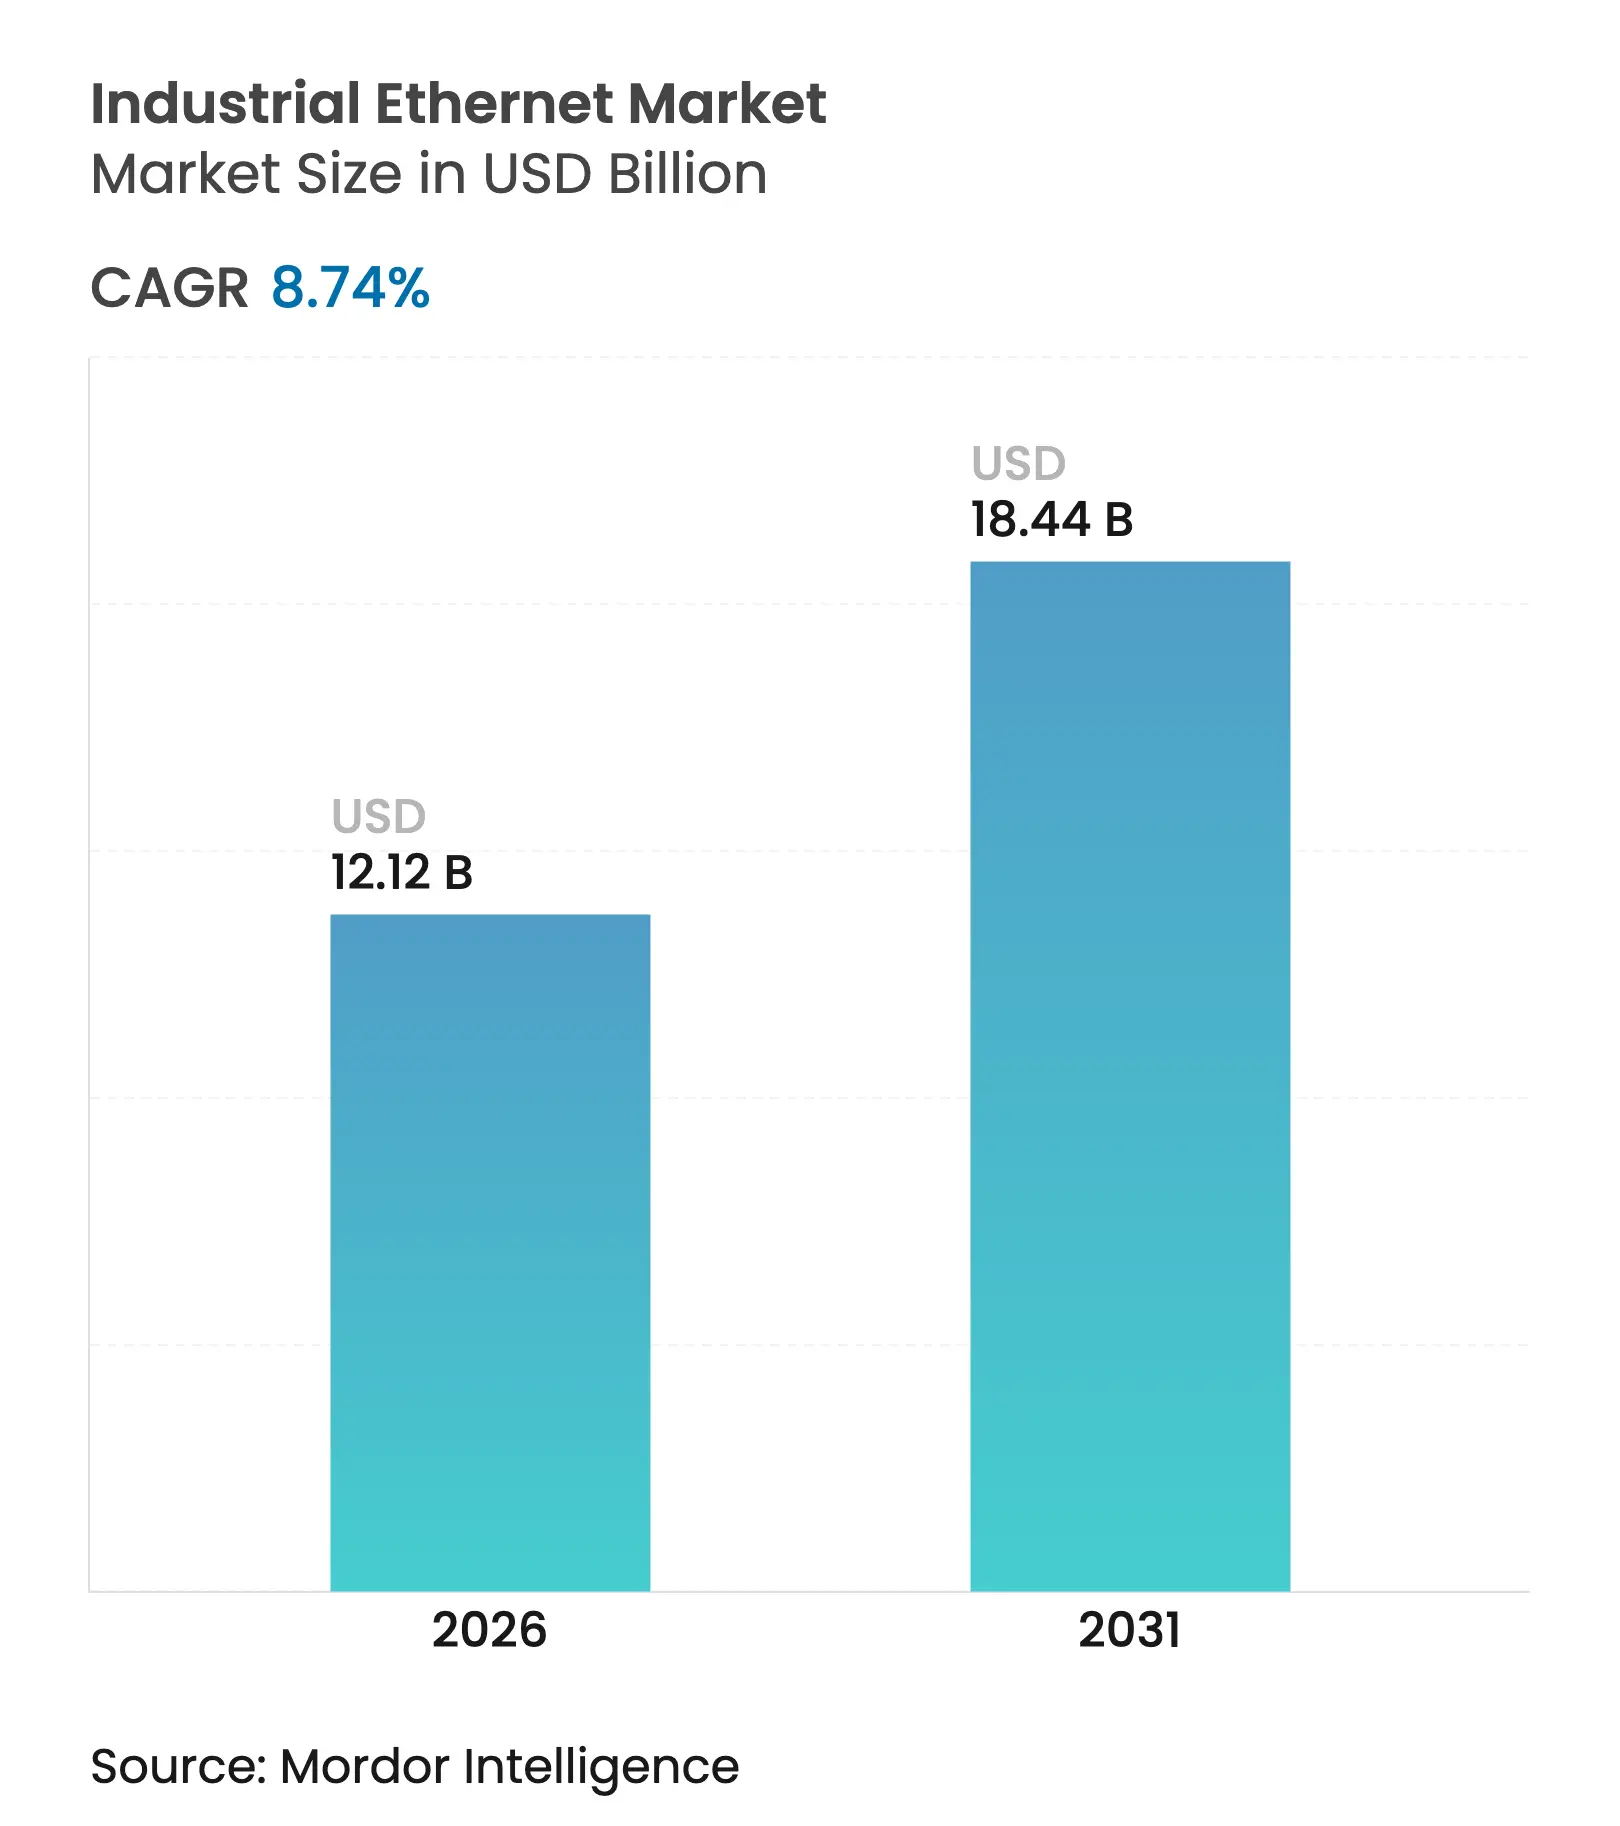
The Industrial Ethernet market size was valued at USD 11.15 billion in 2025 and estimated to grow from USD 12.12 billion in 2026 to reach USD 18.44 billion by 2031, at a CAGR of 8.74% during the forecast period (2026-2031). Robust expansion reflects the migration from legacy fieldbus to Ethernet-based architectures, accelerated digital-twin adoption, and growing convergence between information-technology (IT) and operational-technology (OT) domains. Spending momentum is also tied to government-backed smart-manufacturing programs, wider acceptance of Time-Sensitive Networking (TSN), and a steady shift toward Single-Pair Ethernet (SPE) for long-reach, space-constrained installations. At the same time, silicon supply constraints have affected lead times for industrial-grade switching silicon, prompting multi-sourcing strategies among OEMs. Heightened cyber-risk, evidenced by a 35% rise in OT-focused ransomware premiums, now shapes procurement criteria as strongly as latency or bandwidth targets[1]Chuck Robbins, “Cisco Global Network Trends Report 2024,” Cisco, cisco.com.
Key Report Takeaways
Note: Market size and forecast figures in this report are generated using Mordor Intelligence's proprietary estimation framework, updated with the latest available data and insights as of 2026.
Drivers Impact Analysis
| Driver | (~) % Impact on CAGR Forecast | Geographic Relevance | Impact Timeline | |||
|---|---|---|---|---|---|---|
Rapid Industry-4.0/ IIoT roll-outs Rapid Industry-4.0/ IIoT roll-outs | +3.2% | Global, with concentration in North America, Europe, and East Asia | Medium term (2-4 years) | (~) % Impact on CAGR Forecast:+3.2% | Geographic Relevance:Global, with concentration in North America, Europe, and
East Asia | Impact Timeline:
Medium term (2-4 years)
|
Migration from Fieldbus to Single-Pair and TSN-enabled
Ethernet Migration from Fieldbus to Single-Pair and TSN-enabled
Ethernet | +2.1% | Global, with early adoption in automotive and manufacturing sectors | Medium term (2-4 years) | |||
Rising cybersecurity-by-design mandates for OT networks Rising cybersecurity-by-design mandates for OT networks | +1.5% | North America, Europe, with emerging regulations in Asia-Pacific | Short term (≤ 2 years) | |||
AI-based predictive-maintenance requiring deterministic
bandwidth AI-based predictive-maintenance requiring deterministic
bandwidth | +1.2% | North America, Europe, advanced manufacturing hubs in Asia | Medium term (2-4 years) | |||
Surge in low-latency robotics for lithium-ion
gigafactories Surge in low-latency robotics for lithium-ion
gigafactories | +0.7% | North America, Europe, China, South Korea | Long term (≥ 4 years) | |||
| Source: Mordor Intelligence | ||||||
Rapid Industry-4.0 / IIoT roll-outs
Industrial Ethernet market growth is tightly linked to the global surge of Industry 4.0 deployments that connect sensors, drives, and control systems into unified digital threads. Manufacturers report 15-20% productivity gains after IIoT upgrades, driving further adoption of Ethernet-enabled edge gateways that bring analytics closer to machines. Real-time integration from “shop-floor to top-floor” enables agile scheduling and digital twins, while 5G backhaul augments wired backbones in high-mobility zones. Architectures increasingly pair TSN segments with OPC UA publish-subscribe models to ensure millisecond-level determinism alongside enterprise-wide data sharing. Vendor roadmaps now emphasize zero-touch provisioning to push Industrial Ethernet market penetration deeper into small and mid-sized factories.
Migration from fieldbus to Single-Pair and TSN-enabled Ethernet
A decisive shift is under way from proprietary fieldbus islands to Ethernet-based networking standards that merge IT and OT domains. SPE lowers installation cost by combining power and data on two conductors, cutting cable volume by up to 50%, and extending reach to 1,000 m[2]Teleconnect GmbH, “Single Pair Ethernet in Industrial Automation,” teleconnect.de. TSN, layered on IEEE 802.1Q, delivers microsecond-scale jitter and guaranteed end-to-end latency, making Industrial Ethernet viable for motion-control and safety loops. The result is a flattening of network hierarchies; gateways disappear, engineering effort drops, and common IP frameworks simplify cybersecurity policy enforcement. Automotive OEMs piloting mixed-criticality TSN lines report 8-hour reduction in commissioning time per production cell, underscoring SPE+TSN’s role in expanding Industrial Ethernet market reach.
Rising cybersecurity-by-design mandates for OT networks
Converged architectures enlarge the attack surface, prompting regulations such as IEC 62443 that enforce secure-by-design principles across device lifecycles. Eighty-nine percent of plants now rate cyber-compliance as a budgeted OT KPI, spurring investment in deep-packet-inspection firewalls and root-of-trust silicon inside industrial switches. New procurement checklists mandate support for signed firmware and secure boot. Industrial Ethernet market participants that embed hardware-anchored security report shorter sales cycles in critical-infrastructure bids, shifting competitive advantage toward vendors with certified secure portfolios.
AI-based predictive maintenance requiring deterministic bandwidth
AI-driven maintenance systems slash unplanned downtime by up to 50% but depend on steady, low-latency streams from vibration and thermal sensors. TSN-enabled Industrial Ethernet satisfies these deterministic bandwidth needs while co-existing with non-critical traffic over shared media. Large automotive press-shops now transmit 5 GB of condition data per shift to edge inferencing nodes and cloud dashboards, amplifying demand for 10 Gbps PoE rugged switches. Siemens observed maintenance cost reductions between 10% and 40% after integrating AI analytics over TSN-capable Industrial Ethernet links[3]Siemens AG, “Senseye Predictive Maintenance Case Study,” siemens.com.
Restraints Impact Analysis
| Restraint | (~) % Impact on CAGR Forecast | Geographic Relevance | Impact Timeline | |||
|---|---|---|---|---|---|---|
High upfront capex and skilled-labour shortages
High upfront capex and skilled-labour shortages
| -1.8% | Global, with severe impact in emerging markets | Short term (≤ 2 years) | (~) % Impact on CAGR Forecast:
-1.8%
| Geographic Relevance:
Global, with severe impact in emerging markets
| Impact Timeline:
Short term (≤ 2 years)
|
Inter-operability gaps among legacy protocol islands
Inter-operability gaps among legacy protocol islands
| -1.2% | Global, particularly in facilities with mixed-vendor equipment | Medium term (2-4 years) | |||
Escalating OT-focused ransomware premiums
Escalating OT-focused ransomware premiums
| -0.9% | North America, Europe, with growing impact in Asia-Pacific | Medium term (2-4 years) | |||
Silicon supply-chain volatility for PHY / switch ASICs
Silicon supply-chain volatility for PHY / switch ASICs
| -0.7% | Global, with pronounced impact in regions dependent on imported components | Short term (≤ 2 years) | |||
| Source: Mordor Intelligence | ||||||
High upfront capex and skilled-labour shortages
Full-scale migration to Industrial Ethernet often involves multi-million-dollar controller upgrades and rewiring, costs that deter small-to-mid enterprises even as ROI windows shrink. Simultaneously, 64% of manufacturers struggle to find talent conversant in both EtherNet/IP configuration and OT safety standards, delaying roll-outs and dampening Industrial Ethernet market velocity. Turn-key service models and vendor-led training academies are emerging to bridge knowledge gaps, yet the constraint remains material over the near term.
Inter-operability gaps among legacy protocol islands
Plants that mix PLC brands frequently rely on bespoke gateways; each adds latency and raises maintenance overhead, limiting the Industrial Ethernet market’s addressable brownfield segment. The rise of open profiles such as OPC UA-over-TSN mitigates this risk, but a sizable legacy base with 20-year depreciation cycles means heterogeneous networks will persist through 2030.
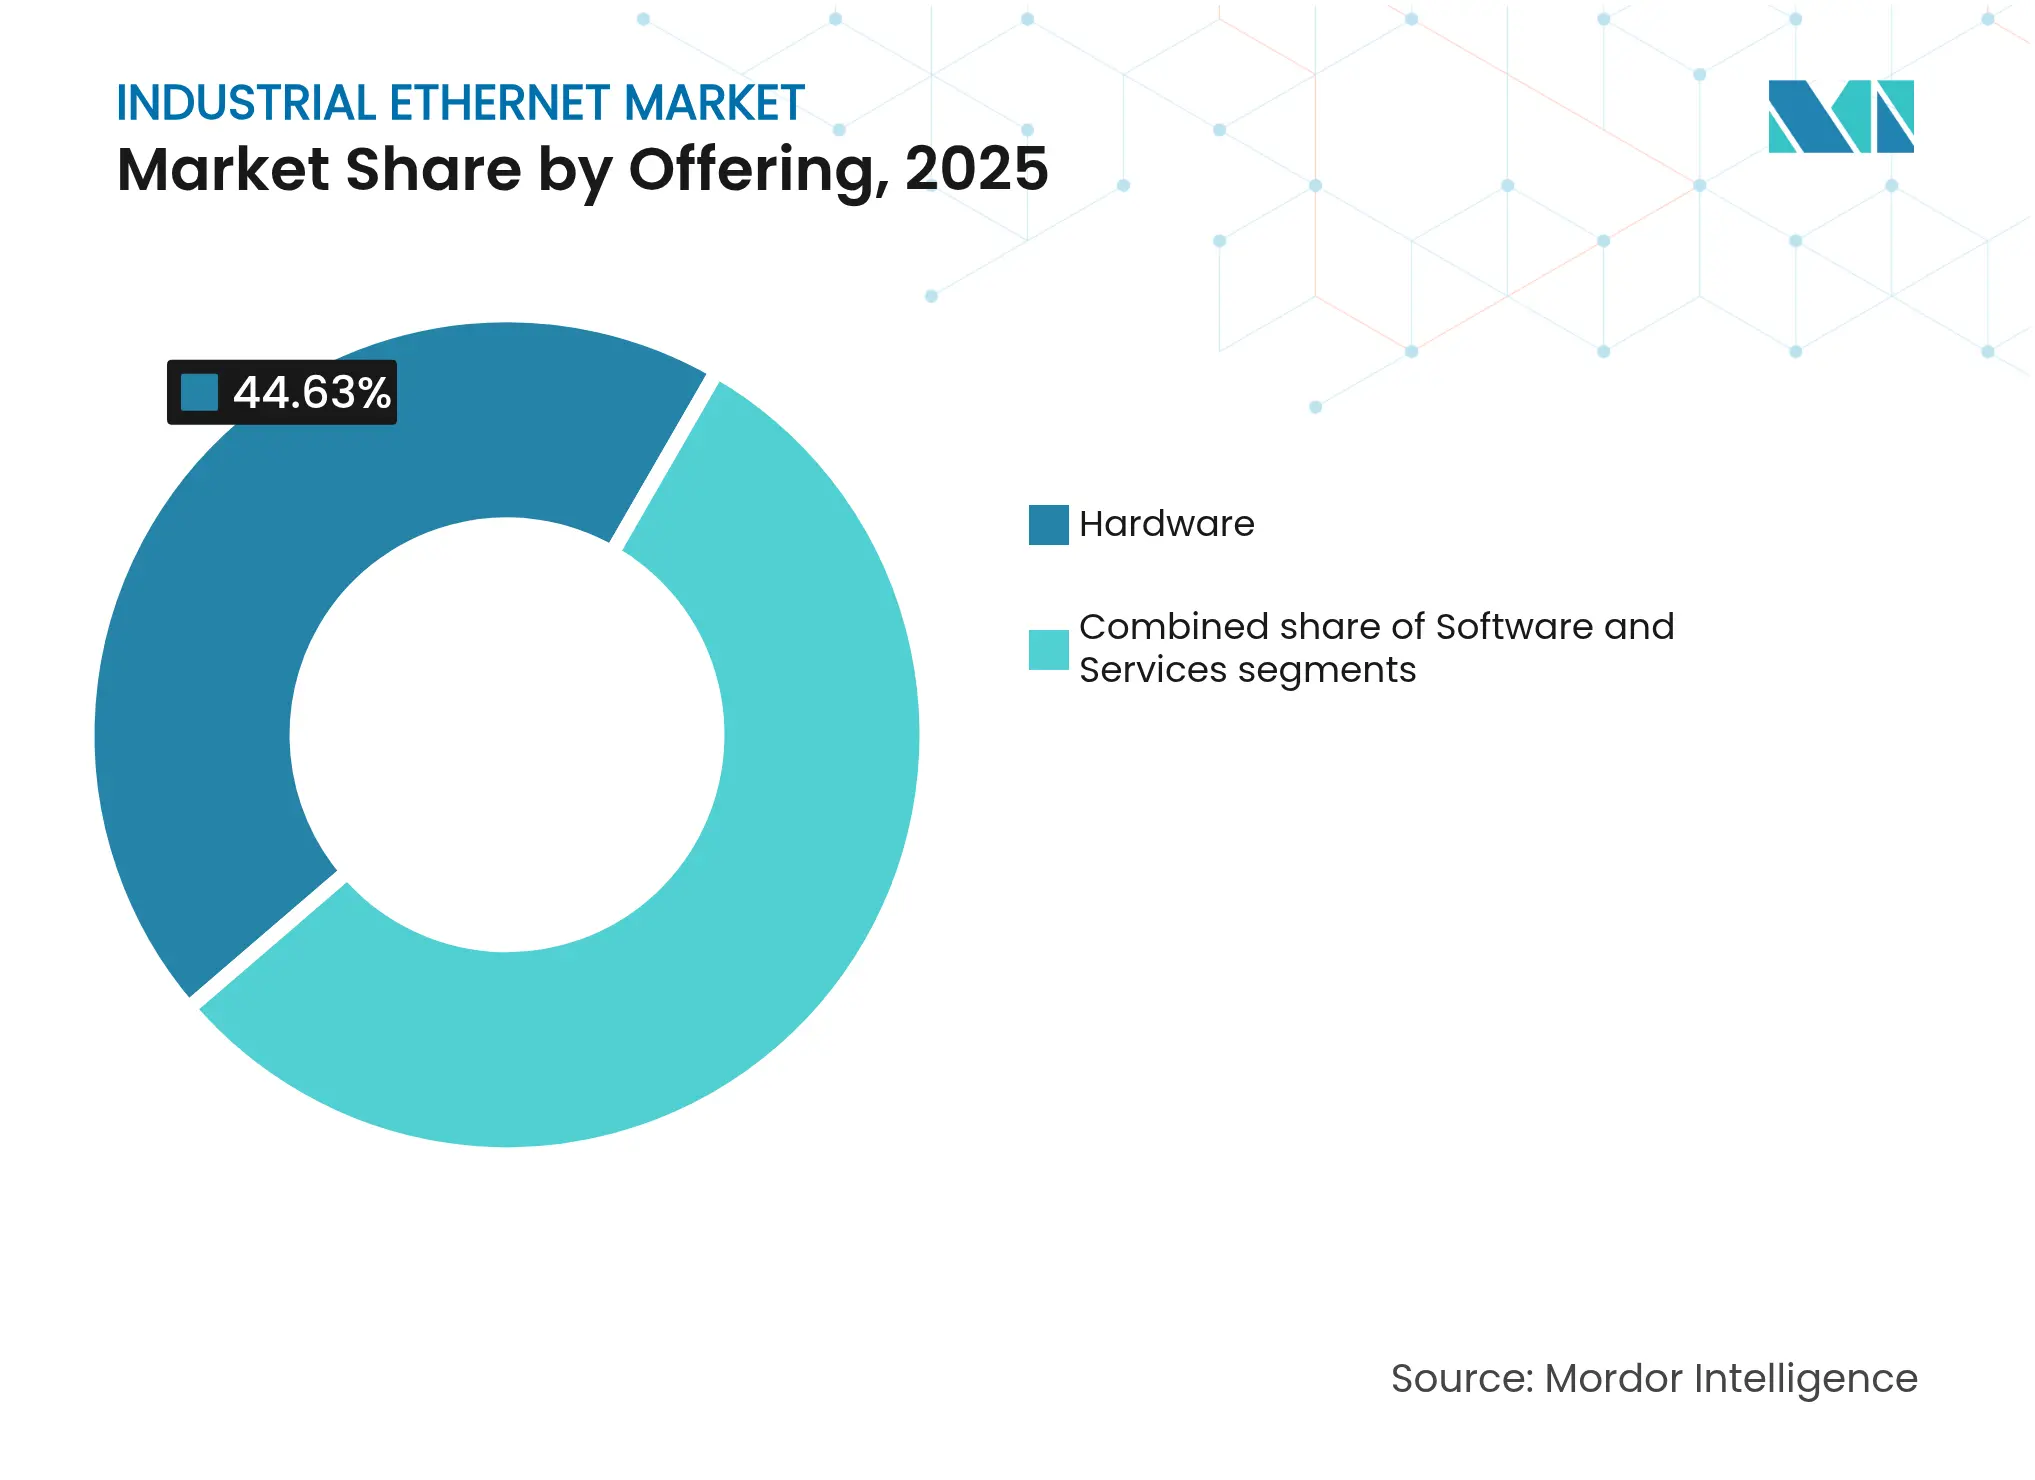
By Offering: Services Outpace Hardware Growth
The Industrial Ethernet market size for services is on track to expand at a 9.45% CAGR between 2026 and 2031, overtaking hardware and software outlays as factories demand lifecycle-wide expertise, from network-health audits to cybersecurity hardening. Service engagements now bundle edge-to-cloud data-integration consulting with resident-engineer programs, reflecting the reality that deterministic networking is foundational to digital-twin ambitions. System integrators report project pipelines doubling year-over-year as brownfield operators seek phased migration paths that prevent production downtime.
Hardware nevertheless retains 44.63% share in 2025, fueled by refresh cycles for Layer-2/3 switches capable of TSN scheduling, extended-temp pluggables, and 240 W PoE budgets. Demand also favors IP67-rated connectors and SPE-ready cable assemblies for robot-arm routing. The software sub-segment is pivoting toward intent-based orchestration; vendors now ship SDN toolkits that auto-discover OT assets and segment traffic flows according to IEC 62443 zones, unlocking new annuity-style license streams that reinforce overall Industrial Ethernet market resilience.
Note: Segment shares of all individual segments available upon report purchase
By Protocol: EtherNet/IP Leads Growth Amid Protocol Diversity
PROFINET retained the largest 24.72% slice of Industrial Ethernet market share in 2025, anchored by Europe’s discrete and process automation base. The protocol’s diagnostics and redundancy classes appeal to machine builders seeking cycle times below 1 ms. Conversely, the outlook favors EtherNet/IP, projected to post a 9.02% CAGR through 2031 on the back of North American auto and food-beverage plants standardizing on ODVA stacks that dovetail with enterprise IP policies.
EtherCAT maintains relevance in motion-centric packaging lines because it pushes efficiency when handling small, cyclic telegrams; vendors integrating EtherCAT with TSN bridges anticipate hybrid topologies that preserve sub-100 µs latency. Modbus-TCP survives as a migration bridge due to ease of retrofitting serial Modbus slaves via gateway modules, while POWERLINK’s deterministic profile finds niche uptake in plastics machinery. This plurality means multi-protocol switches remain indispensable, underpinning continued multi-vendor competition across the Industrial Ethernet market.
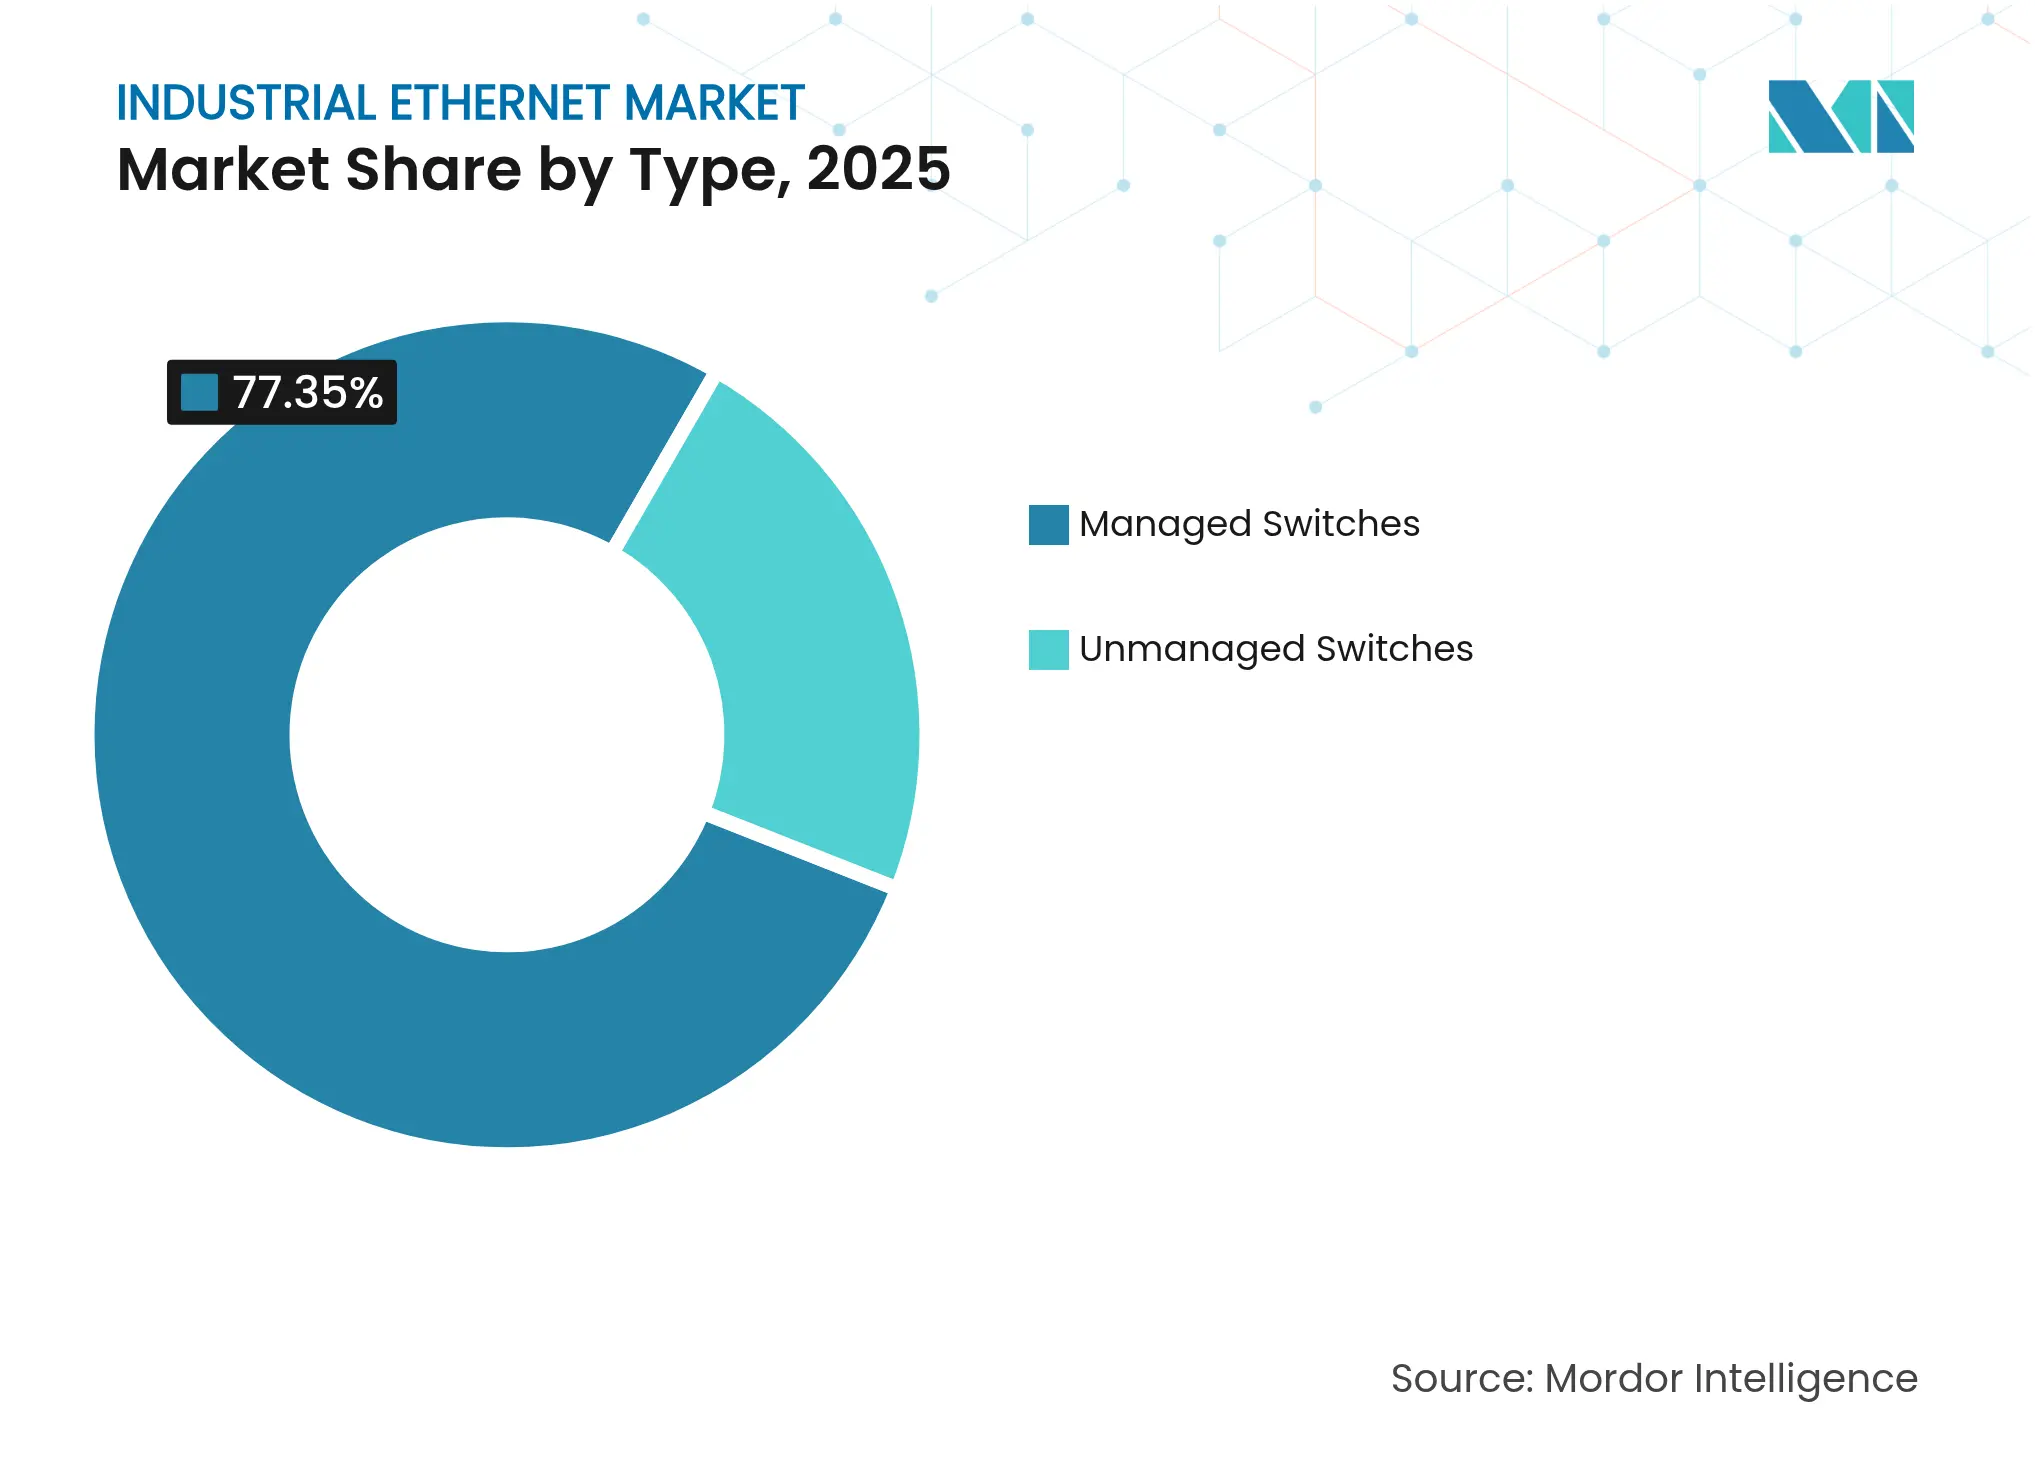
By Type: Managed Switches Dominate with Security Features
Managed switches already capture 77.35% of 2025 revenue and are forecast to grow at a 9.1% CAGR, mirroring the elevated role of VLAN partitioning and Quality-of-Service tagging in mixed-criticality environments. VLANs isolate safety traffic from bulk historian logs, while built-in MACsec and 802.1X options meet zero-trust mandates. Vendors are also embedding GNSS-disciplined PTP clocks to support TSN time domains, a capability translating into lower jitter and smoother robot motion.
Unmanaged switches continue to serve sensor backbones in HVAC or warehouse conveyors where traffic is bursty and deterministic guarantees are non-essential. However, the march toward TSN and segmented architectures nudges even cost-sensitive segments toward lightly-managed “smart” variants, advancing the Industrial Ethernet market’s managed-device mix over the forecast horizon.
Note: Segment shares of all individual segments available upon report purchase
By Industry Vertical: Electrical and Electronics Manufacturing Leads Growth
Electrical and electronics plants exhibit the highest 9.72% CAGR forecast as miniaturized consumer devices and high-density PCBs demand precision, traceability, and adaptive line changeovers. Industrial Ethernet enables sub-millisecond feedback loops for pick-and-place robots and AOI vision systems, directly influencing yield metrics. Line builders similarly cite SPE harness reductions as an enabler for high-speed surface-mount platforms.
The automotive vertical nevertheless constitutes the largest single slice of the Industrial Ethernet market size, at 32.48% in 2025, reflecting decades-long familiarity with Ethernet-based robot networks and zone controllers. Electric-vehicle platforms intensify bandwidth demand owing to battery-cell traceability and end-of-line battery pack balancing, reinforcing the vertical’s hardware refresh cadence. Aerospace, energy, and regulated process industries follow, each prioritizing deterministic control, redundancy, and certified cyber-posture that favour high-spec Ethernet solutions.
North America leads the Industrial Ethernet market with 37.42% share in 2025 on the strength of reshoring policies, tax incentives for smart-factory upgrades, and stringent cybersecurity oversight. Plants in the United States increasingly adopt unified Layer-2/Layer-3 designs where TSN islands bridge seamlessly to enterprise SD-WAN fabrics, creating cradle-to-cloud visibility. Managed-service providers now deliver remote packet-capture and anomaly-detection as a subscription, lowering entry barriers for mid-tier manufacturers.
Asia-Pacific is the fastest-growing territory, clocking a 9.6% forecast CAGR through 2031. Government campaigns such as “Made in China 2025” and “Make in India” subsidize SPE retrofits and TSN pilot lines, accelerating greenfield and brownfield conversions alike. Japanese electronics and Korean battery giants move to 10 Gig TSN backbones to support real-time AI inspection, lifting demand for hardened optical SFP+ links. Southeast Asian nations, eager to capture supply-chain relocation, roll out skill-development grants focused on Industrial Ethernet network engineering, extending the addressable base.
Europe maintains a significant position associated with early Industry 4.0 adoption and standardization leadership. German machine-tool builders champion PROFINET over TSN as a de-facto baseline, while the EU’s digital-product passport regulations drive metadata integration that relies on seamless shop-floor connectivity. Energy transition policies also stimulate Industrial Ethernet deployments in offshore wind and hydrogen electrolyzers, domains that require deterministic control under harsh environmental conditions, sustaining demand across the region.
Market Concentration

The Industrial Ethernet market exhibits moderate concentration: global incumbents Cisco, Siemens, and Rockwell Automation compete against specialist switch makers and protocol-stack vendors. Large automation houses bundle controllers, I/O, and Ethernet gear, leveraging installed bases to cross-sell cybersecurity services. Conversely, IT-heritage firms introduce intent-based orchestration engines derived from data-center portfolios, blurring traditional boundaries and sharpening the focus on network visibility in OT contexts.
Strategic alliances multiply; examples include switch vendors partnering with chipmakers to co-design TSN-capable ASICs that remove scheduling bottlenecks. White-space opportunities cluster around simplified migration kits for fieldbus retrofits, mid-range SPE media converters, and subscription-driven security monitoring. Arista Networks illustrated momentum by posting a 27.6% year-over-year revenue bump in Q1 2025, underpinned by its 25.6 Tbps Ethernet fabric wins in automotive and food verticals[4]Arista Networks, “Q1 2025 Shareholder Letter,” arista.com.
Competition also moves to software layers: vendors differentiate through digital-twin alignment, built-in OPC UA modeling, and integrated PKI services that slash certificate-deployment time. Establishing device-level root-of-trust and achieving IEC 62443 certifications increasingly decide tender outcomes, compelling every contender in the Industrial Ethernet market to invest in secure-element silicon and automated compliance tooling.

*Disclaimer: Major Players sorted in no particular order
1. INTRODUCTION
2. RESEARCH METHODOLOGY
3. EXECUTIVE SUMMARY
4. MARKET LANDSCAPE
5. MARKET SIZE AND GROWTH FORECASTS (VALUE)
6. COMPETITIVE LANDSCAPE
7. MARKET OPPORTUNITIES AND FUTURE OUTLOOK
Market Definitions and Key Coverage
Segmentation Overview
Detailed Research Methodology and Data Validation
Primary Research
Desk Research
Market-Sizing & Forecasting
Data Validation & Update Cycle
Why Mordor's Industrial Ethernet Baseline Commands Confidence
Benchmark comparison
| Market Size | Anonymized source | Primary gap driver | ||
|---|---|---|---|---|
USD 11.15 B (2025) | Mordor Intelligence | Anonymized source:Mordor Intelligence | Primary gap driver: | |
USD 12.30 B (2024) | Regional Consultancy A | Uses earlier base year and a hardware-heavy scope, inflating total | ||
USD 11.00 B (2023) | Global Consultancy B | Limited protocol set and older exchange rates reduce comparability | ||
USD 10.15 B (2024) | Trade Journal C | Excludes stand-alone integration services and surveys only 40 nations |
Pricing Strategy for Semiconductor Components
3 Min Read
Accelerating Additive Manufacturing Adoption in India
3 Min Read
A Leading Sanitaryware Company’s Journey in Saudi Arabia
4 Min Read
When decisions matter, industry leaders turn to our analysts. Let’s talk.