Indonesia Devices Market Size and Share
Market Overview
| Study Period | 2020 - 2031 |
|---|---|
| Forecast Data Period | 2026 - 2031 |
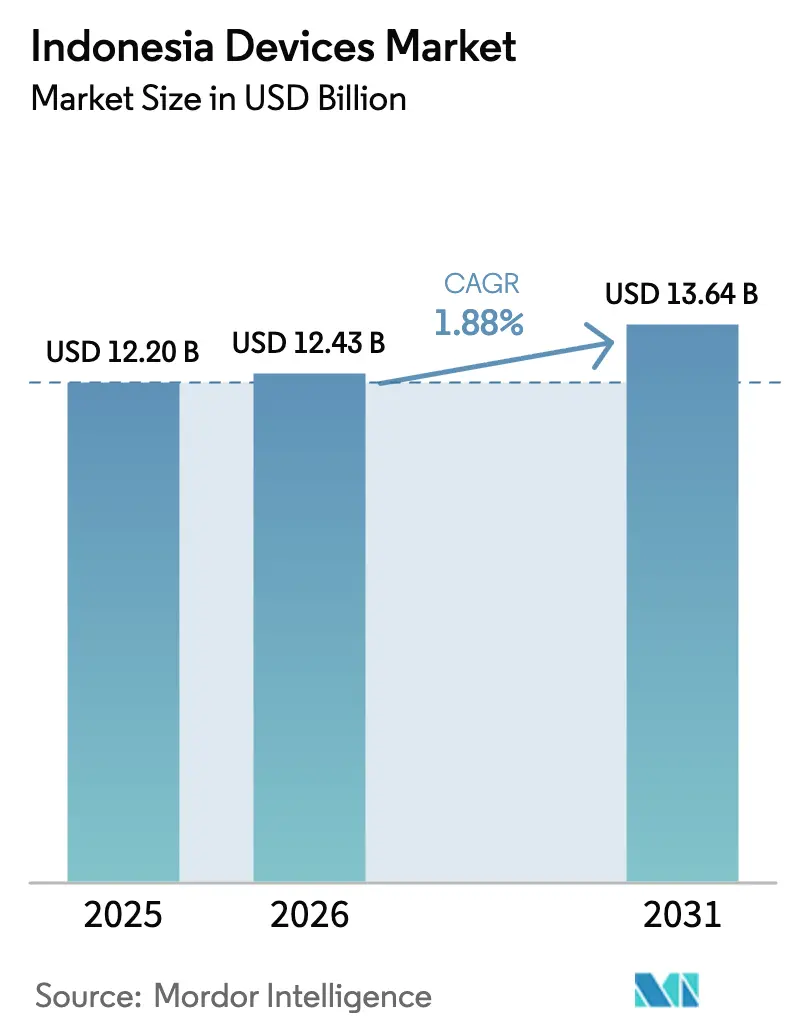
| Base Year Market Size (2025) | USD 12.20 Billion |
| Market Size (2026) | USD 12.43 Billion |
| Market Size (2031) | USD 13.64 Billion |
| Growth Rate (2026 - 2031) | 1.88% CAGR |
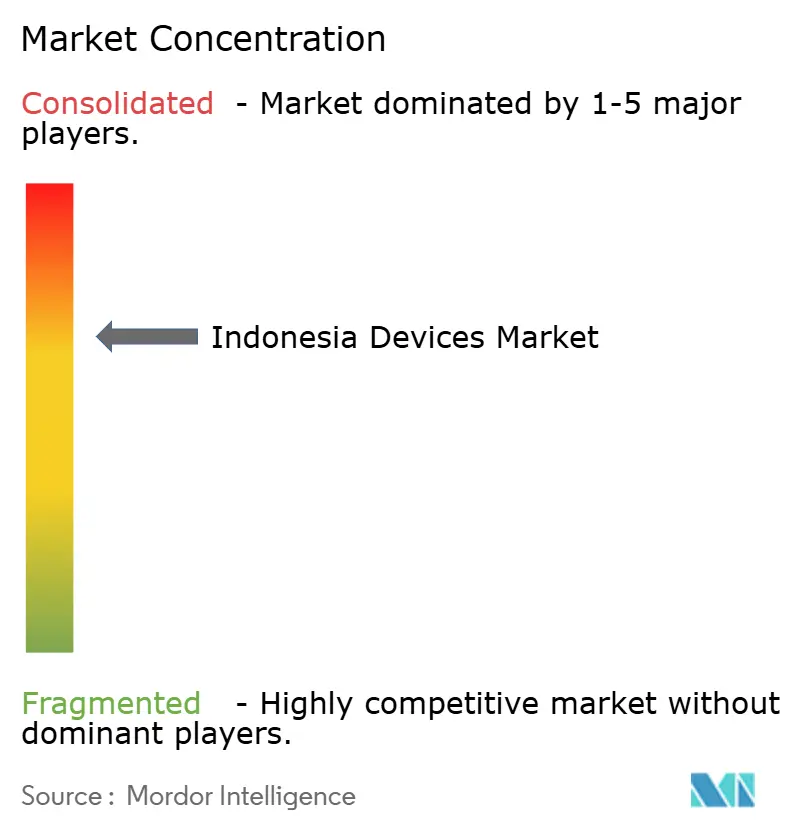
| Market Concentration | Medium |
Major Players *Disclaimer: Major Players sorted in no particular order Image © Mordor Intelligence. Reuse requires attribution under CC BY 4.0. | |
Indonesia Devices Market Analysis by Mordor Intelligence
The Indonesia devices market size is expected to grow from USD 12.20 billion in 2025 to USD 12.43 billion in 2026 and is forecast to reach USD 13.64 billion by 2031 at 1.88% CAGR over 2026-2031. Steady household income gains, 4G-to-5G upgrades, and tightening local-content rules channel growth toward higher-value products rather than raw shipment volumes. Premium smartphones and wearables outpace the broader market as affluent urban users seek advanced camera, health-monitoring, and low-latency features. Government programs that subsidize school laptops and fiber backbones further diversify device demand across education and enterprise segments. Meanwhile, policy emphasis on domestic manufacturing and component sourcing reshapes competitive strategies, rewarding brands that deliver TKDN compliance alongside innovation. Local supply chain expansion helps cushion rupiah volatility, yet lingering semiconductor constraints keep inventory cycles tight for smaller vendors.
Key Report Takeaways
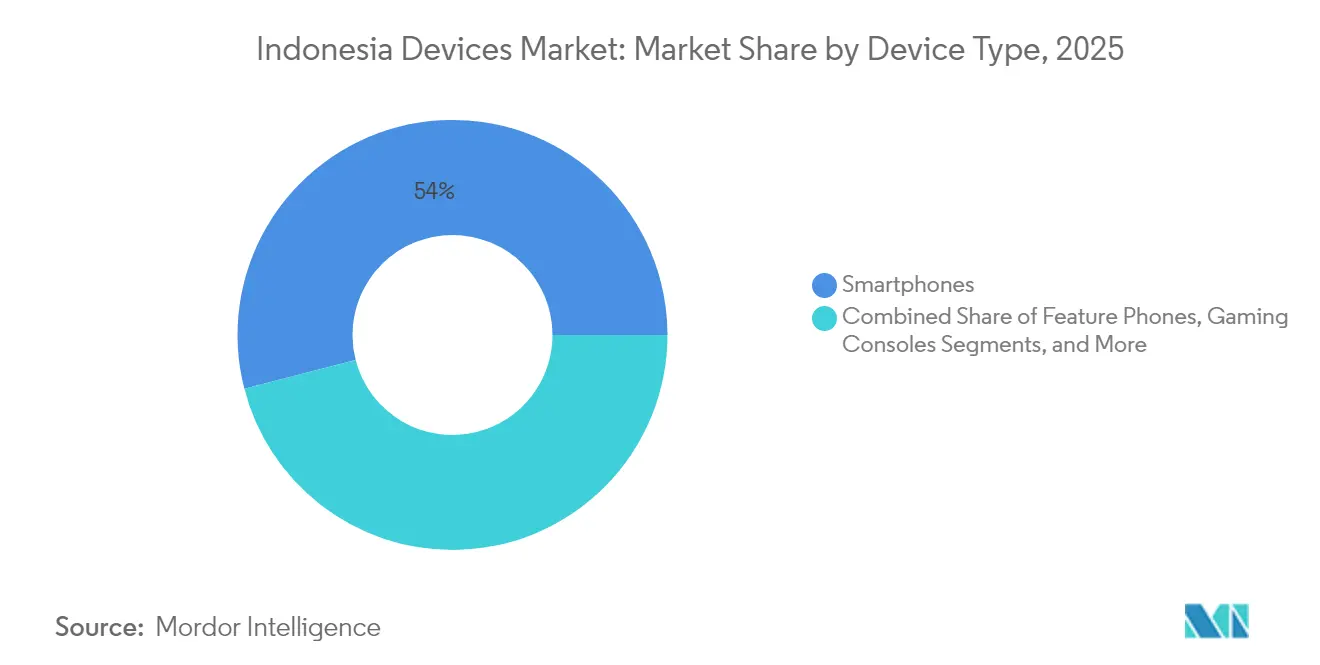
- By device type, smartphones led with 54.02% revenue share in 2025; wearables are projected to expand at a 3.02% CAGR through 2031.
- By pricing tier, the mid-range band held 46.68% of the Indonesia devices market share in 2025, while the premium band is advancing at a 3.38% CAGR to 2031.
- By operating system, Android commanded 87.10% share of the Indonesia devices market size in 2025 and alternative platforms are growing at a 4.11% CAGR through 2031.
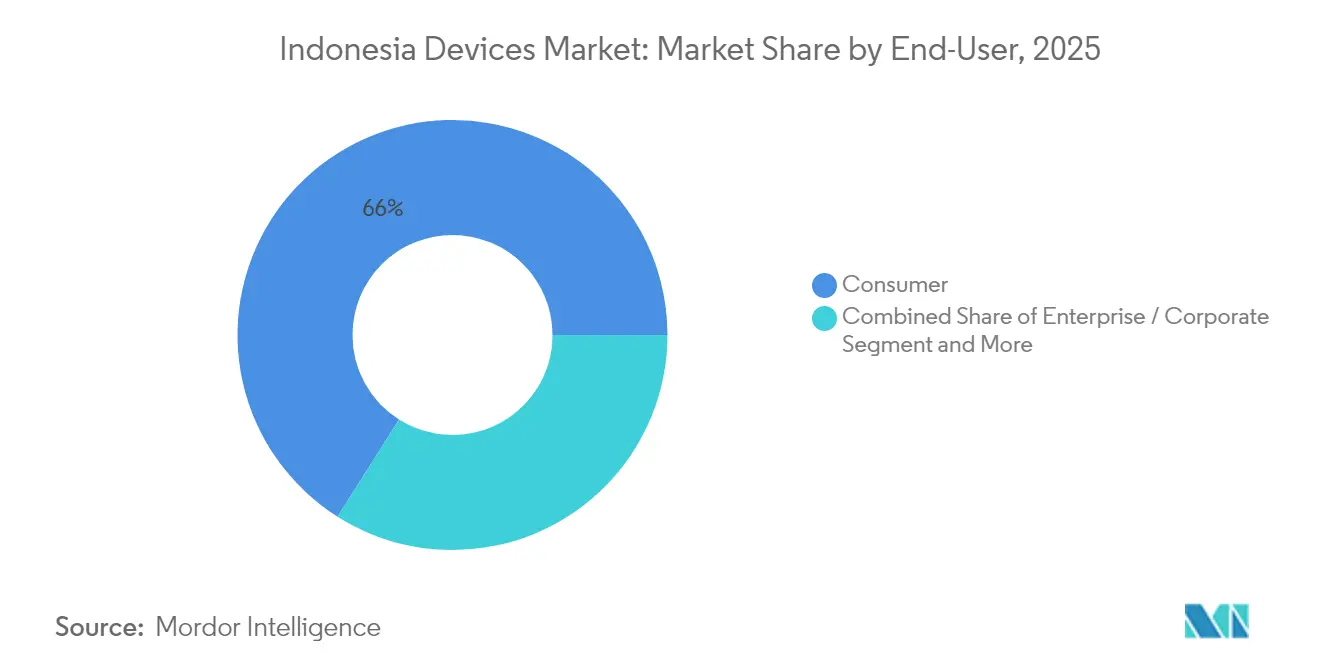
- By end-user, the consumer segment accounted for 66.02% of the Indonesia devices market size in 2025; education is growing at a 2.04% CAGR through 2031.
- By sales channel, online retailers captured 52.12% share in 2025, and the channel is forecast to post a 2.82% CAGR to 2031.
Note: Market size and forecast figures in this report are generated using Mordor Intelligence’s proprietary estimation framework, updated with the latest available data and insights as of 2026.
Indonesia Devices Market Trends and Insights
Drivers Impact Analysis*
| Driver | (~) % Impact on CAGR Forecast | Geographic Relevance | Impact Timeline |
|---|---|---|---|
| Rising disposable income and smartphone affordability | +0.8% | Java and Sumatra urban centers | Medium term (2-4 years) |
| Government push for digital economy and 4G/5G rollout | +0.6% | Nationwide, early gains in Java and Bali | Long term (≥ 4 years) |
| Expansion of remote work and e-learning post-COVID-19 | +0.4% | Urban areas nationwide | Short term (≤ 2 years) |
| E-commerce boom accelerating online device sales | +0.5% | Java, Sumatra, outer islands | Medium term (2-4 years) |
| Fintech super-app ecosystem driving device bundling | +0.3% | Java and urban Sumatra | Medium term (2-4 years) |
| OTT local-content quota fueling smart-TV upgrades | +0.2% | National, urban clusters | Long term (≥ 4 years) |
| Source: Mordor Intelligence | |||
Government Push for Digital Economy and 4G/5G Rollout
The USD 10 billion state-backed 4G/5G build-out and the Palapa Ring fiber backbone extend high-speed coverage to 34 provinces, making 5G-ready handsets a default choice among early adopters[1]Telkomsel, “5G Network Expansion Factsheet,” telkomsel.com . National plans to lift the digital economy to USD 315 billion by 2030 encourage enterprises to procure low-latency edge devices for automation, smart mining, and logistics. Telkomsel’s network already blankets 150 cities with 5G, prompting rising shipments of premium phones able to exploit millimeter-wave performance. Electronics is a priority under Making Indonesia 4.0, so the same policy environment that grows connectivity also rewards brands building or sourcing domestically. Together, spectrum availability and local-production incentives create a self-reinforcing demand loop for compliant, high-spec devices.
E-commerce Boom Accelerating Online Device Sales
Online marketplaces captured more than half of device value in 2024, and social-commerce mergers such as TikTok-Tokopedia expose even rural shoppers to live product demos. Checkout integration with fintech wallets enables installment plans that lift the attainable price ceiling for middle-income buyers. Manufacturers that master the livestream marketing cycle inventory faster and collect user feedback in real time, reducing model-refresh risk. Direct-to-consumer storefronts also raise gross margins versus legacy distributors. For outer islands, logistics partners piggyback on the e-commerce boom, smoothing last-mile delivery and enlarging the Indonesian devices market.
Fintech Super-App Ecosystem Driving Device Bundling
Super-apps such as Gojek embed device financing within ride-hailing and payment services, letting users lease premium phones through micro-instalments deducted from wallet balances. Telcos like Indosat pair 5G data with monthly handset payments, locking customers into three-year cycles that stabilize revenue. Education ministries employ the same model to equip students with tablets tied to e-learning platforms, mitigating upfront budget strain. By converting one-time hardware sales into recurring service bundles, fintech programs enlarge the total addressable pool for higher-priced devices. Brands that supply the bundles gain predictable volume and richer customer data.
Expansion of Remote Work and E-Learning Post-COVID-19
Government disbursement of IDR 3.7 trillion for 29,000 schools’ laptops established refresh expectations that persist well beyond pandemic urgency. Urban employers now formalize hybrid work policies, compelling staff to purchase webcams, secondary monitors, and productivity tablets. These accessory cohorts lift average selling prices even when the core smartphone replacement lengthens. Universities rely on device-loan programs that rotate hardware every three years, generating a predictable baseline for computing-device vendors. In the net effect, persistent digital-first work and study habits put a floor under Indonesia's device market demand.
Restraints Impact Analysis*
| Restraint | (~)% Impact on CAGR Forecast | Geographic Relevance | Impact Timeline |
|---|---|---|---|
| Rupiah volatility inflating import costs | −0.4% | Nationwide | Short term (≤ 2 years) |
| Semiconductor shortages and logistics bottlenecks | −0.3% | Manufacturing hubs | Medium term (2-4 years) |
| Stricter e-waste rules curbing refurbished imports | −0.2% | Java, Sumatra industrial zones | Long term (≥ 4 years) |
| Grey-market proliferation eroding brand margins | −0.3% | Border and informal markets | Medium term (2-4 years) |
| Source: Mordor Intelligence | |||
Rupiah Volatility Inflating Import Costs
Sudden currency swings elevate the landed cost of dollar-denominated semiconductors and OLED panels, forcing OEMs either to shrink margins or hike retail prices. Mid-range handsets, the most price-sensitive slice, bear disproportionate risk because shoppers can downgrade to ultra-low-end alternatives when prices move just a few percent. To counter volatility, brands accelerate local sourcing of plastics, batteries, and final assembly, but integrated circuits still arrive from offshore hubs and remain exposed. Fiscal measures aimed at stabilizing the rupiah help, yet financing constraints during swings slow channel sell-through, briefly shrinking the Indonesia devices market.
Semiconductor Shortages and Logistics Bottlenecks
Tight global chip supply increases lead times to 40-70 weeks for some power-management ICs, forcing vendors to prioritize flagship lines. Indonesia’s archipelago amplifies pain because inbound parts often bottleneck at Tanjung Priok port before crossing islands. Large players charter dedicated freight or leverage Batam-based Pegatron’s new 5G smart factory to keep high-margin models flowing. Smaller entrants lacking volume contracts lose shelf space, effectively raising market entry barriers and slowing assortment diversity for consumers.
*Our forecasts treat driver/restraint impacts as directional, not additive. The impact forecasts reflect baseline growth, mix effects, and variable interactions.
Segment Analysis
By Device Type: Smartphones Lead Amid Wearables Upswing
Smartphones accounted for 54.02% of 2025 revenue, anchoring the Indonesia devices market even as unit growth plateaus. Wearables post the fastest expansion at a 3.02% CAGR, buoyed by urban fitness trends and health monitoring needs. Computing devices gain tailwinds from school procurements and remote-work accessories, while feature phones persist in outer islands with sparse 4G coverage. Smart TVs ride a wave of OTT quotas that encourage households to upgrade screens for local streaming apps.
Runners in Jakarta and Surabaya triple smartwatch usage, pushing brands such as Garmin to scale distribution. Telko-bundled Android TVs cross 2 million installed units, proving carrier leverage in device ecosystems. Gaming consoles remain niche but benefit from Indonesia’s 150 million-strong player base, which values high-refresh displays and low-latency connectivity. Altogether, widening lifestyle applications keep the Indonesia devices market diversified and resilient.


By Pricing Tier: Premium Growth Defies Market Maturity
Mid-range units priced at IDR 3–7 million held 46.68% share in 2025, but premium devices over IDR 7 million clock the quickest 3.38% CAGR. Corporate executives and affluent millennials embrace pro-grade cameras, foldable designs, and AI photo processing, signaling a shift from mere mobility to personal branding. Entry-level phones still seed first-time connectivity in rural provinces yet face weaker refresh momentum because functionality gaps shrink.
Samsung’s Galaxy S25, assembled locally with 37.5% TKDN content, targets the premium tier left open by Apple’s delayed entry. Domestic brands experimenting with vegan-leather finishes narrow perception gaps versus imported flagships. Financing plans via super-apps soften sticker shock, extending premium access to aspirational buyers and sustaining the Indonesia devices market toward higher average sales prices.
By Operating System: Android Dominance Faces Alternative Drift
Android fueled 87.10% shipment share in 2025 thanks to broad chipset support and deep developer reach. Yet HarmonyOS and niche open-source forks advance at a 4.11% CAGR, encouraged by enterprises wary of geopolitical supply risk. Government agencies pilot non-US platforms for strategic autonomy, ordering tablets pre-loaded with local app stores. Windows maintains a lock on productivity laptops, while iOS lags due to historic TKDN hurdles now partially resolved.
Fragmentation challenges app publishers to optimize across ecosystems, but it also spurs middleware-as-a-service startups that ensure cross-platform analytics. For OEMs, running dual operating-system pipelines raises cost but secures optionality against trade surprises. This software plurality keeps innovation pressure high within the Indonesia devices industry.
By End-User: Consumer Dominance with Education Momentum
Consumers delivered 66.02% of 2025 revenue and continue to shape design priorities such as selfie algorithms and battery life. Education grows at a 2.04% CAGR as laptop grants and university BYOD policies standardize device ownership among students. Enterprises tighten security needs, prompting adoption of zero-trust firmware and remote-wipe features.
Government agencies favor locally assembled tablets with biometric authentication for public-service apps. Non-profit programs that recycle older notebooks extend digital inclusion to remote districts, indirectly lengthening product life cycles. Balanced multi-segment demand stabilizes production planning and buffers the Indonesia devices market against consumer cyclicality.
By Sales Channel: Online Dominance Reshapes Distribution
E-commerce captured 52.12% of sales value in 2025 and will sustain a 2.82% CAGR as social-stream shopping entrenches. Brand-run webstores now debut limited-edition models exclusively online, creating scarcity buzz and data-rich feedback loops. Modern-trade electronics chains reposition as experience centers where shoppers test foldables and mixed-reality headsets.
Independent dealers remain crucial in Kalimantan and Papua, accepting cash and providing after-sales repair that builds local trust. Telco bundles broaden from smartphones to include Android TVs and smartwatches, exploiting billing relationships to cross-sell hardware. A hybrid channel strategy becomes table stakes for capturing the full Indonesia devices market.
Geography Analysis
Java dominates revenue on the back of 58.7% GDP share and dense 5G coverage that accelerates premium device take-up in Jakarta, Bandung, and Surabaya. University clusters fuel steady notebook demand, while manufacturing zones in West Java help vendors meet TKDN thresholds cost-effectively. Digital-nomad influx to Bali also lifts high-spec laptop and camera purchases, benefiting regional retailers.
Sumatra ranks second as resource-driven prosperity in Medan and Palembang widens middle-class discretionary spending. The Trans-Sumatra toll road and Palapa Ring connectivity close logistical gaps, supporting e-commerce growth and smartphone upgrades. Mining firms in Riau deploy rugged tablets for field operations, adding an enterprise flavor to regional consumption.
Kalimantan, Sulawesi, and the eastern provinces offer catch-up potential, posting double-digit shipment jumps where fresh fiber nodes come online. Pegatron’s Batam smart factory signals a northern Riau Islands manufacturing corridor that can shorten supply lines to Sulawesi’s industrial parks. Government digital-inclusion grants seed school tablet programs in Papua and Maluku, laying groundwork for future consumer follow-on sales. Collectively, geographic dispersion widens the addressable base and tempers saturation risk in the Indonesia devices market.
Competitive Landscape
The market stays moderately fragmented: the top five brands jointly hold near 70% share, validating room for challengers. Transsion leads with 18.3% share, leveraging sub-USD 100 handsets optimized for local language interfaces and multi-SIM battery life. Samsung follows at 16.5%, refreshed by TKDN-compliant flagship production. Oppo and Xiaomi cluster close behind, each refining offline-plus-online hybrid channels.
Localization stands out as a principal differentiator. Vendors that invest in Batam or West Java assembly plants secure faster product homologation and avoid import-duty swings. Component co-development with Indonesian PCB and battery suppliers also strengthens compliance positions. Marketing increasingly centers on esports sponsorships and health challenges tied to wearables, extending brand reach beyond traditional above-the-line tactics.
Strategic moves in 2025 underscore the pivot to ecosystem control. Samsung folded SmartThings home appliances into carrier bundles, while Transsion debuted its own AI voice assistant tuned to Bahasa slang. Oppo invested in a Jakarta design hub to tailor UI skins to Indonesian preferences. Such ecosystem layering transforms one-off sales into recurring service touchpoints, intensifying competition yet raising switching costs for users and sustaining long-run margins inside the Indonesia devices market.
Indonesia Devices Industry Leaders
Lenovo Group Limited
Samsung Electronics
Apple Inc.
Dell Inc.
The Hewlett-Packard Company(HP)
- *Disclaimer: Major Players sorted in no particular order

Recent Industry Developments
- July 2025: Five U.S. technology firms committed USD 23.21 billion to Indonesian digital infrastructure projects, led by Oracle’s USD 6.5 billion Batam data center.
- April 2025: Pegatron opened the world’s largest 5G smart factory on Batam Island in partnership with Telkomsel, featuring a private network across the facility.
- April 2025: LG cancelled its USD 7.7 billion EV-battery mega-project yet maintained its existing West Java battery joint venture.
- March 2025: Apple secured TKDN certification for iPhone 16 models after pledging local manufacturing and RandD investments.
- February 2025: Apple explored an AirTag plant in Batam to supply 65% of global demand by 2026.


Indonesia Devices Market Report Scope
Personal computers (PCs) are portable and multifunctional machines designed for individual use. PCs are made to be operated directly by end users rather than by any third party or computer expert. Telephony describes the technology that allows people to interact and communicate across long distances through the electronic transmission of voice.
The Indonesian devices market is segmented by type and region. By type, the market is segmented into PC and telephony. By region, the market is segmented into Java, Sumatra, Kalimantan, and other regions. The market sizes and forecasts are provided in terms of value (USD) for all the above segments.
| Computing Devices (Laptops, Desktops, Tablets) |
| Smartphones |
| Feature Phones |
| Wearables (Smartwatches, Fitness Bands) |
| Smart TVs and Set-top Boxes |
| Gaming Consoles |
| Entry-Level (< IDR 3 mn) |
| Mid-Range (IDR 3 - 7 mn) |
| Premium (> IDR 7 mn) |
| Android |
| iOS |
| Windows |
| Others (HarmonyOS, Linux, ChromeOS) |
| Consumer |
| Enterprise / Corporate |
| Education |
| Government and Public Sector |
| Online Retailers and Marketplaces |
| Brand E-Stores |
| Organised Offline Retail (Modern Trade) |
| Independent Dealers and Mom-and-Pop Stores |
| Telco-Operator Bundles |
| By Device Type | Computing Devices (Laptops, Desktops, Tablets) |
| Smartphones | |
| Feature Phones | |
| Wearables (Smartwatches, Fitness Bands) | |
| Smart TVs and Set-top Boxes | |
| Gaming Consoles | |
| By Pricing Tier | Entry-Level (< IDR 3 mn) |
| Mid-Range (IDR 3 - 7 mn) | |
| Premium (> IDR 7 mn) | |
| By Operating System | Android |
| iOS | |
| Windows | |
| Others (HarmonyOS, Linux, ChromeOS) | |
| By End-User | Consumer |
| Enterprise / Corporate | |
| Education | |
| Government and Public Sector | |
| By Sales Channel | Online Retailers and Marketplaces |
| Brand E-Stores | |
| Organised Offline Retail (Modern Trade) | |
| Independent Dealers and Mom-and-Pop Stores | |
| Telco-Operator Bundles |


Key Questions Answered in the Report
How big is the Indonesia Devices Market?
The Indonesia Devices Market size is expected to reach USD 12.43 billion in 2026 and grow at a CAGR of 1.88% to reach USD 13.64 billion by 2031.
What is the current Indonesia Devices Market size?
In 2026, the Indonesia Devices Market size is expected to reach USD 12.43 billion.
Who are the key players in Indonesia Devices Market?
Lenovo Group Limited, Samsung Electronics, Apple Inc., Dell Inc. and The Hewlett-Packard Company(HP) are the major companies operating in the Indonesia Devices Market.
What years does this Indonesia Devices Market cover, and what was the market size in 2025?
In 2025, the Indonesia Devices Market size was estimated at USD 12.43 billion. The report covers the Indonesia Devices Market historical market size for years: 2019, 2020, 2021, 2022, 2023 and 2024. The report also forecasts the Indonesia Devices Market size for years: 2026, 2027, 2028, 2029, 2030 and 2031.
How fast is the market expected to grow?
It is projected to rise to USD 13.64 billion by 2031 at a 1.88% CAGR.
Which device category is expanding the quickest?
Wearables are forecast to post the highest 3.02% CAGR through 2031.
Why are premium smartphones gaining share?
Affluent users seek 5G, flagship cameras, and AI features, while financing plans lower entry barriers.
How important is e-commerce for device sales in Indonesia?
Online channels already control 52.12% of value and will keep growing at a 2.82% CAGR.
What role do local-content rules play?
TKDN mandates of 35-40% compel brands to assemble locally, influencing competitive positioning and supply chains.
Page last updated on:


