Market Overview
| Study Period | 2020 - 2031 |
|---|---|
| Forecast Data Period | 2026 - 2031 |
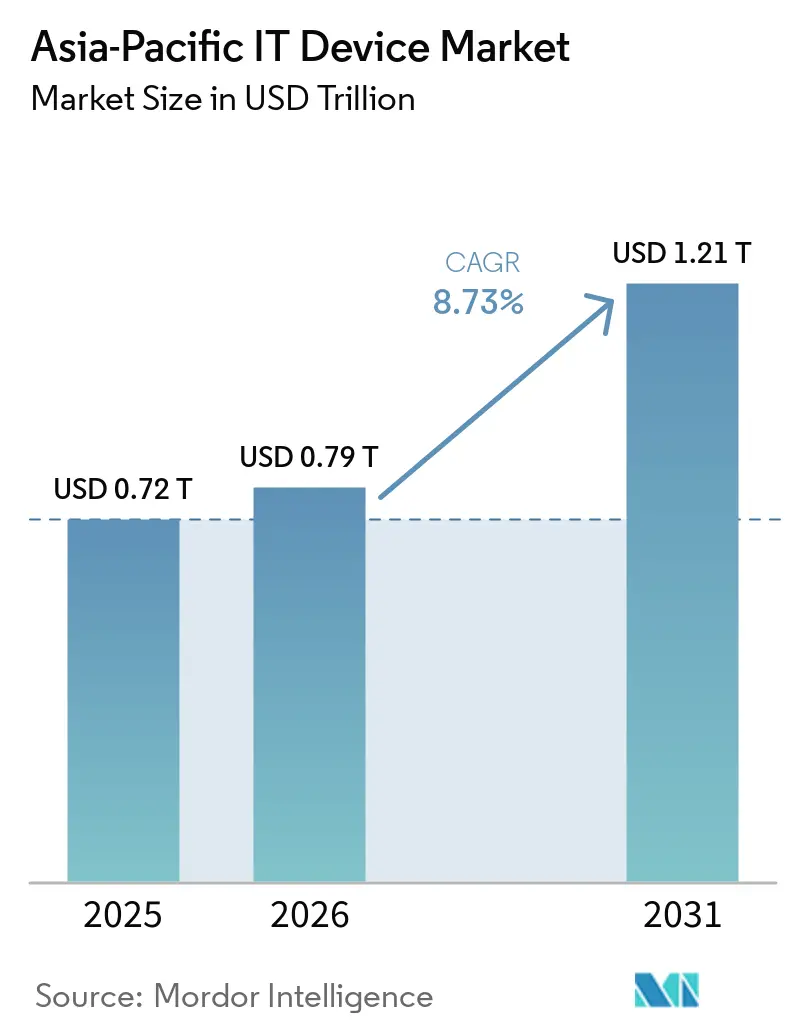
| Base Year Market Size (2025) | USD 0.72 Trillion |
| Market Size (2026) | USD 0.79 Trillion |
| Market Size (2031) | USD 1.21 Trillion |
| Growth Rate (2026 - 2031) | 8.73% CAGR |
| Market Concentration | Medium |
Major Players *Disclaimer: Major Players sorted in no particular order Image © Mordor Intelligence. Reuse requires attribution under CC BY 4.0. | |
Asia-Pacific IT Device Market Analysis by Mordor Intelligence
The Asia-Pacific IT device market size is expected to grow from USD 0.72 trillion in 2025 to USD 0.79 trillion in 2026 and is forecast to reach USD 1.21 trillion by 2031 at an 8.73% CAGR over 2026-2031. Government sovereign-AI mandates, rapid 5G deployment, and aggressive local-manufacturing incentives are reshaping demand patterns from cyclical replacement to strategic fleet upgrades. Enterprises are prioritizing devices that support on-device inference to meet data-residency requirements, while consumers in tier-2 and tier-3 cities are trading up to mid-premium specifications through fintech-enabled installment plans. Memory-chip cost inflation is squeezing OEM margins, but vertical-integration plays such as custom silicon and generative-AI firmware are unlocking new value pools. Competitive intensity remains moderate, with smartphone leaders controlling scale advantages even as fragmentation persists in tablets, laptops, and wearables.
Key Report Takeaways
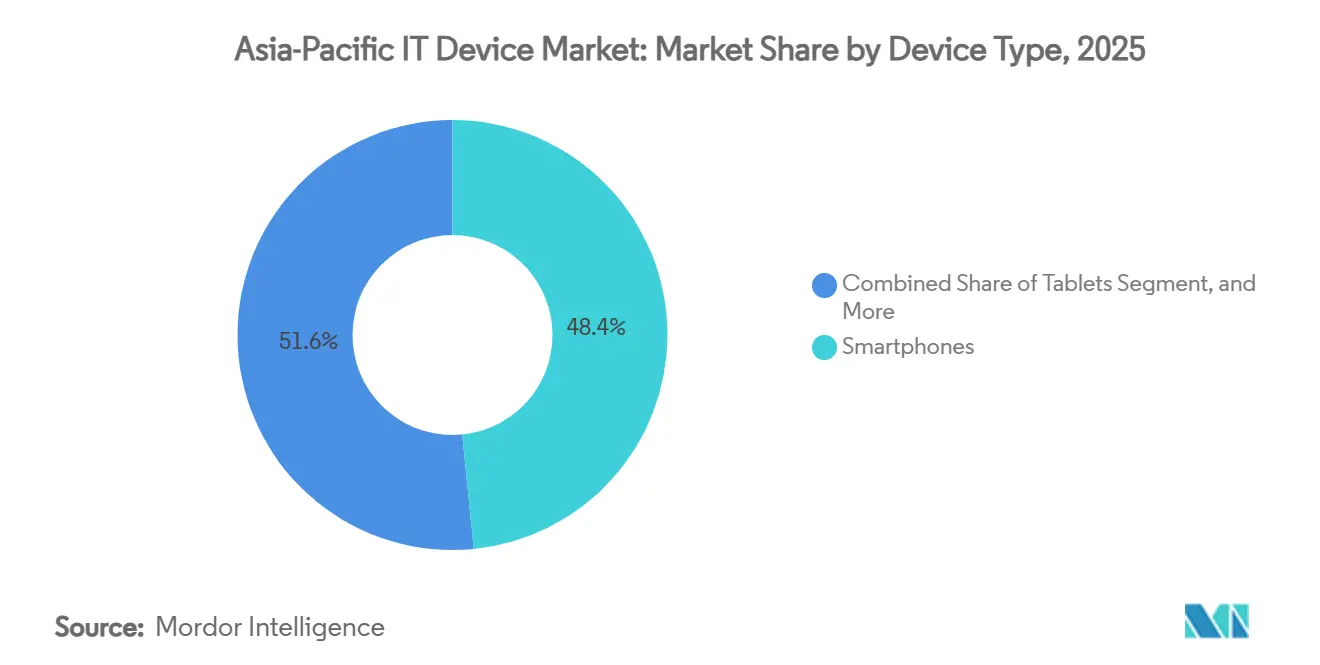
- By device type, smartphones led the Asia-Pacific IT device market with 48.43% share in 2025; wearables are projected to expand at a 9.93% CAGR through 2031.
- By end-user industry, the consumer segment held 67.14% of 2025 revenue, while enterprise procurement is forecast to grow at a 9.53% CAGR between 2026 and 2031.
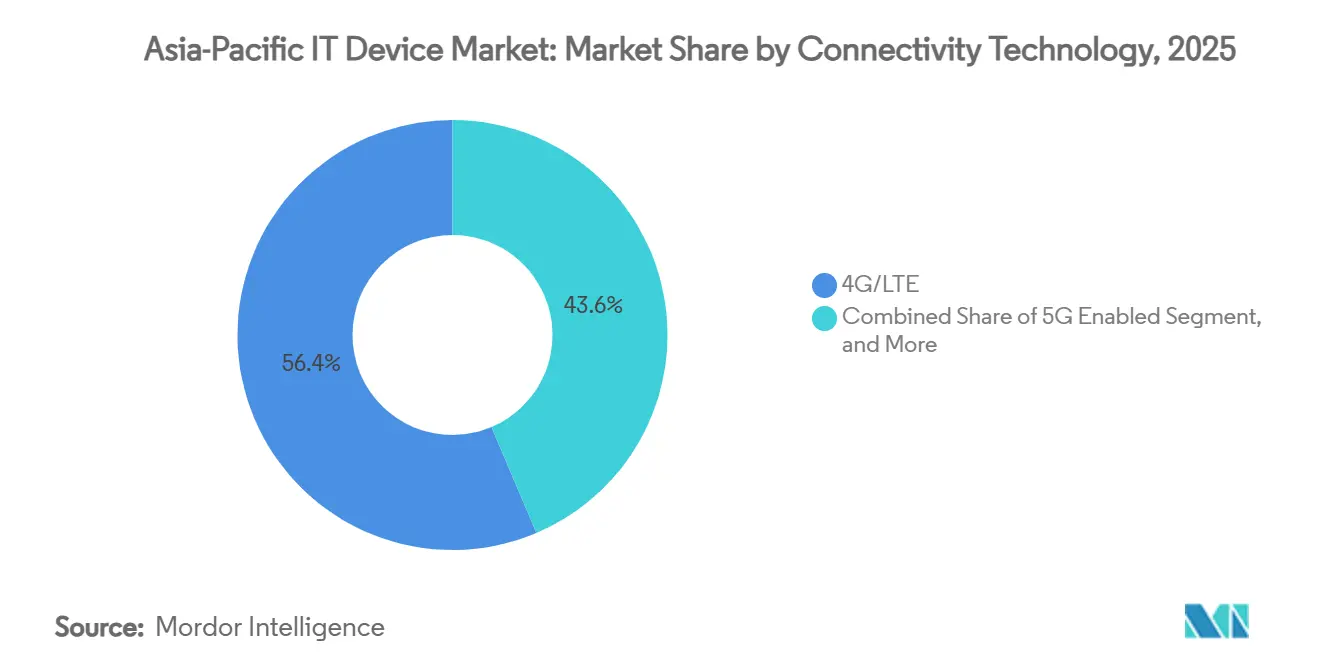
- By connectivity technology, 4G/LTE devices accounted for 56.39% of the market share in 2025, whereas 5G-enabled units are expected to post a 9.74% CAGR over the forecast period.
- By distribution channel, offline retail accounted for 58.51% of 2025 sales; online platforms are advancing at a 9.98% CAGR, driven by tier-2 and tier-3 city penetration.
- By geography, China dominated with 41.84% share in 2025, while India is projected to be the fastest-growing major market at a 9.93% CAGR through 2031.
Note: Market size and forecast figures in this report are generated using Mordor Intelligence’s proprietary estimation framework, updated with the latest available data and insights as of January 2026.
Asia-Pacific IT Device Market Trends and Insights
Driver Impact Analysis*
| Driver | (~) % Impact on CAGR Forecast | Geographic Relevance | Impact Timeline |
|---|---|---|---|
| Rapid 5G Infrastructure Roll-out Accelerating Device Refresh Cycles | +2.1% | APAC core (Malaysia, India, Thailand, Philippines), spill-over to Indonesia and Vietnam | Medium term (2-4 years) |
| Emerging AI-On-Device Use-Cases in Consumer Electronics | +1.8% | Global, with early adoption in China, South Korea, Japan | Short term (≤ 2 years) |
| Government Incentives for Local Electronics Manufacturing | +1.5% | India, Vietnam, Thailand, Indonesia | Long term (≥ 4 years) |
| Growing BYOD Adoption in Small and Medium Enterprises | +1.2% | Singapore, Australia, urban hubs in India, Malaysia | Medium term (2-4 years) |
| Expanding E-commerce Penetration for Electronics in Tier-2 and Tier-3 Cities | +0.9% | India, Indonesia, Philippines, Vietnam | Medium term (2-4 years) |
| Gamification and Esports Fueling Demand for High-Performance Devices | +0.7% | Southeast Asia core (Philippines, Indonesia, Thailand), China, South Korea | Short term (≤ 2 years) |
| Source: Mordor Intelligence | |||
Rapid 5G Infrastructure Roll-out Accelerating Device Refresh Cycles
Standalone 5G coverage surpassed 80% of Malaysia’s population by December 2025, prompting logistics and manufacturing firms to replace 4G handhelds with 5G tablets that enable real-time routing and warehouse automation. India's leading operator extended standalone 5G to 300 cities, cutting network latency below 10 milliseconds, making cloud gaming and industrial IoT viable on mid-tier smartphones. Operators in Thailand and the Philippines now bundle 5G plans with device-financing offers, shortening replacement intervals. Although IMT-2020 rules retain backward compatibility, enterprises find that 4G chipsets cannot sustain the packet inspection overhead of network slicing policies, leading to the accelerated obsolescence of devices bought as recently as 2023.[1]International Telecommunication Union, “IMT-2020 Specifications,” itu.int The largest gains are occurring in healthcare and manufacturing verticals that require guaranteed quality of service for mission-critical workloads.
Emerging AI-On-Device Use-Cases in Consumer Electronics
Data-localization laws in India, Indonesia, and Vietnam bar cross-border transfer of biometric and financial data, driving OEMs to shift inference workloads to the edge. Flagship smartphones launched in 2026 are running 7-billion-parameter language models locally, enabling real-time translation, meeting transcription, and privacy-preserving voice assistance without cloud calls. Samsung expects to preload Galaxy AI on 800 million devices during 2026, expanding monetization through premium subscriptions for productivity add-ons. Automotive OEMs are adopting custom AI chipsets for infotainment, signaling that on-device intelligence will transcend traditional computing form factors. The premium tier commands a 30-40% price uplift, as dedicated neural engines deliver lower latency and better battery life compared to CPU-bound inference on budget models.
Government Incentives for Local Electronics Manufacturing
Production-Linked Incentive (PLI) programs in India, Vietnam, and Thailand offer 4-6% rebates on incremental sales and mandate local-value thresholds, catalyzing USD 15 billion in foreign direct investment into India’s handset and component ecosystem since 2021. Apple already assembles 14% of global iPhones locally and targets 25% by 2027, while Vietnam has secured new semiconductor-packaging lines from Intel and Samsung through extended tax holidays. Thailand grants eight-year corporate-tax exemptions for plants that achieve 40% local content, drawing hard-disk and server assembly to the Eastern Economic Corridor. These schemes embed technology-transfer clauses that require joint ventures, talent development, and domestic tooling, accelerating supplier-base maturity and shortening regional lead times.
Growing BYOD Adoption in Small and Medium Enterprises
Unified endpoint management software has commoditized security features such as containerization and remote wipe, enabling SMEs to formalize bring-your-own-device policies without the historic cost premium. A 2025 survey showed that 68% of SMEs in Singapore had BYOD frameworks, up from 42% in 2023. Small businesses in Australia and urban India are expensing personal laptops and smartphones for inventory, invoicing, and point-of-sale tasks, eroding the boundary between consumer and enterprise procurement channels. Telstra case studies highlight logistics staff using personal 5G smartphones for barcode scanning and real-time order tracking, replacing proprietary handheld scanners. Device-as-a-service bundles that wrap hardware and software into monthly subscriptions are further aligning procurement with operating budgets.
Restraint Impact Analysis*
| Restraint | (~) % Impact on CAGR Forecast | Geographic Relevance | Impact Timeline |
|---|---|---|---|
| Semiconductor Supply Chain Volatility | -0.8% | Global, acute in China, South Korea, Taiwan | Short term (≤ 2 years) |
| Intensifying Regulatory Scrutiny on E-waste Management | -0.5% | Thailand, Malaysia, Hong Kong, India, Australia, New Zealand | Medium term (2-4 years) |
| Currency Fluctuations Impacting Import-Dependent OEMs | -0.3% | India, Indonesia, Vietnam, Philippines | Short term (≤ 2 years) |
| Saturation of Premium Smartphone Segment in Urban Hubs | -0.2% | China, Japan, South Korea, Singapore | Long term (≥ 4 years) |
| Source: Mordor Intelligence | |||
Semiconductor Supply Chain Volatility
DRAM spot prices jumped 90-95% quarter-on-quarter in early 2026, and NAND prices rose 55-60%, as high-bandwidth memory was diverted to AI accelerators. Consumer laptops and entry-level tablets now face 16-20-week lead times for LPDDR5 modules, delaying product launches or forcing bill-of-materials redesigns around older memory that compromises battery life. PC OEMs have explored sourcing from second-tier suppliers, raising performance-validation and geopolitical concerns. Realme, Honor, and other mid-tier smartphone brands lack the purchasing clout to lock in long-term supply, squeezing already-thin margins in the sub-USD 300 bracket. Foundries remain cautious about adding capacity because the memory market is historically cyclical and could swing to oversupply by 2027.
Intensifying Regulatory Scrutiny on E-waste Management
Thailand banned the import of used electronics from January 2026, closing refurbishment channels that previously absorbed end-of-life laptops and smartphones. Hong Kong now imposes producer fees of HKD 50-80 per unit to fund recycling, while Singapore aims for 60% device recovery rates by 2027.[2]Hong Kong Environmental Protection Department, “Extended Producer Responsibility for IT Equipment,” epd.gov.hk Malaysia’s prohibition on plastic waste imports complicates disposal logistics because discarded circuit boards are often bundled with plastic scrap. India fines non-compliant OEMs up to INR 1 million (approximately USD 12,000) per violation, deterring smaller entrants. Multinationals must therefore run separate compliance teams for each jurisdiction’s unique rules, elevating administrative overhead and favoring incumbents with dedicated regulatory affairs divisions.
*Our forecasts treat driver/restraint impacts as directional, not additive. The impact forecasts reflect baseline growth, mix effects, and variable interactions.
Segment Analysis
By Device Type: Wearables Gain Momentum While Smartphones Dominate
Wearables are projected to post a 9.93% CAGR through 2031, while smartphones retained 48.43% of the Asia-Pacific IT device market share in 2025. The segment’s rise is driven by health-monitoring functions such as ECG, blood-oxygen saturation, and continuous glucose monitoring that qualify users for 10-15% insurance premium discounts in Japan, South Korea, and Singapore. Ruggedized wearables equipped with barcode scanners and thermal cameras are also replacing legacy handhelds in logistics operations, capturing incremental demand from enterprise buyers. Tablets recorded double-digit shipment growth in 2025 as India and Indonesia distributed devices for education programs, yet volumes remain susceptible to fiscal cycles. Laptops experienced mixed dynamics, such as corporate upgrades surged ahead of Windows 10's end-of-support in October 2025, but consumer demand slowed due to memory price inflation, which added USD 50-80 per unit. Desktops and workstations serve niche applications such as CAD design and algorithmic trading, where users pay premiums for multi-core CPUs and discrete GPUs.
Smartphone differentiation is now software-led, with generative AI assistants and federated learning platforms augmenting the user experience without compromising privacy. Lenovo’s cross-device assistant synchronizes tasks between laptops, tablets, and phones, demonstrating convergence across form factors. Hearables and smart rings, which carry 40-50% gross margins versus 20-25% for smartphones, extend the wearables family and diversify revenue streams. The Asia-Pacific IT device market for rugged handhelds in logistics is small today but expanding rapidly as 5G connectivity and edge AI reduce reliance on legacy Windows CE terminals.


By End-User Industry: Enterprise Outpaces Consumer Growth
Enterprise buyers are forecast to expand at a 9.53% CAGR, narrowing the gap with consumers, who generated 67.14% of 2025 revenue but now upgrade less frequently. Hybrid work models require laptops with hardware root-of-trust (HRT) features to meet zero-trust security standards, prompting fleet renewals across finance, healthcare, and technology verticals. Device-as-a-service offerings bundle hardware, software, and support into opex-friendly subscriptions, attracting SMEs that lack scale for volume discounts. Education procurements spiked in 2025 when Indonesia’s Ministry of Education deployed 1.5 million tablets, though funding for 2027 is uncertain.
Government agencies specify energy-efficiency and recyclability metrics, adding procurement hurdles that favor established OEMs with mature compliance processes. SMEs remain technology laggards in some ASEAN markets, yet a 2025 survey showed 75% adopting new digital-payment tools, signaling broader digitization that will lift hardware demand. The Asia-Pacific IT device market for enterprise laptops is expected to expand steadily as Windows 11 hardware baselines and AI co-processors become standard.
By Connectivity Technology: 4G Holds Share While 5G Leads Growth
4G/LTE devices accounted for 56.39% of 2025 shipments, reflecting the sizeable legacy installed base, yet 5G-enabled units are projected to climb at a 9.74% CAGR. Malaysia’s nationwide 5G rollout achieved 80% population coverage by late 2025, but only 40% device penetration due to a USD 100-150 premium on chipsets. India’s rapid urban adoption now supports cloud gaming and AR navigation, but rural adoption lags due to price sensitivity. Wi-Fi-only tablets remain popular in education and office settings where fixed networking suffices, delivering 20-30% cost savings over cellular versions.
Wired desktops continue to decline in unit terms, yet grow in value, as workstation buyers demand high-bandwidth Ethernet connections for AI modeling and video rendering. The Asia-Pacific IT device market size attributable to Wi-Fi-only education tablets spiked during government tenders but is expected to normalize post-2026. Operators in Thailand and the Philippines are focusing 5G investments on industrial parks and tourist corridors, reinforcing a two-speed connectivity landscape that forces retailers to juggle inventory across 4G and 5G SKUs.
By Distribution Channel: Online Retail Gains Traction in Smaller Cities
Offline retail secured 58.51% of 2025 sales, as consumers still value hands-on evaluation, while online retail is growing at a 9.98% CAGR, capturing incremental demand from tier-2 and tier-3 cities. Amazon’s 2025 festival data showed electronics average order values of INR 38,000 (USD 456) in smaller cities, a 22% premium over metro baskets, implying aspirational upgrades. Indonesian e-commerce platforms partner with fintech providers to offer zero-interest installment plans, lowering the barrier to entry for mid-premium smartphones and laptops. Enterprise direct sales remain the procurement path for large corporations that require custom configurations, extended warranties, and lifecycle services.
Offline chains are evolving into experience centers with trade-in counters and same-day fulfillment, while online platforms deploy virtual try-ons and liberal return policies to reduce buyer friction. Value-added resellers face margin pressure as cloud-based endpoint-management tools commoditize their configuration role, pushing them toward cybersecurity and managed services. The Asia-Pacific IT device market share captured by online pure-plays is expected to continue outpacing store-based growth as logistics networks reach remote districts and digital payments adoption rises.
Geography Analysis
China accounted for 41.84% of the Asia-Pacific IT device market in 2025, yet unit shipments declined 4% year on year amid macro headwinds and near-full smartphone penetration in urban centers. Domestic chipmakers are scaling DRAM and NAND capacity, but process-node gaps versus South Korean peers limit adoption in flagship handsets. Xiaomi earmarked RMB 40 billion (USD 5.6 billion) for 2026 R&D spending to deepen vertical integration through custom silicon and AI firmware. Japan’s buyers remain loyal to premium domestic brands; Sony’s True RGB TVs, launched in early 2026, target affluent consumers seeking 4,000-nit peak brightness displays. The South Korean won appreciated 8% against the dollar in 2025, prompting Samsung and LG to shift additional assembly to Vietnam and India.
India is the fastest-growing large geography, forecast to expand at a 9.93% CAGR until 2031, underpinned by PLI incentives totaling INR 62,919 crore (USD 7.55 billion) for handsets and components. Apple already assembles more than one in seven iPhones locally and aims to reach one in four by 2027. E-commerce growth in smaller cities accounts for 60% of incremental sales, with average electronics baskets showing a premium to metros, indicating rising aspirational demand. Australia and New Zealand are mature but will see corporate refresh cycles ahead of Windows 10 retirement and the rollout of AI PCs with dedicated neural engines.
Southeast Asian nations, grouped as Rest of Asia-Pacific, benefit from supply-chain diversification. Vietnam secured semiconductor-packaging investments through 15-year tax holidays, while Thailand attracted server assembly lines via eight-year income tax exemptions. Currency weakness in India, Indonesia, and the Philippines, with 3-5% depreciation during 2025, inflated import costs but also encouraged local assembly.[3]Vietnam Investment Review, “Vietnam Attracts Semiconductor Packaging Investments,” vir.com.vn Regulatory heterogeneity across e-waste, import duties, and data localization continues to increase compliance complexity, favoring incumbents that can maintain localized legal and logistics teams.
Competitive Landscape
Market concentration is moderate. The top five smartphone vendors, Samsung, Apple, Xiaomi, OPPO, and Vivo, accounted for roughly 60% of 2025 shipments, but tablets, laptops, and wearables remain fragmented, with regional challengers. Xiaomi’s USD 28 billion five-year R&D plan includes USD 8.7 billion for AI models and USD 6.9 billion for custom silicon, underscoring a vertical-integration push that reduces reliance on Qualcomm and MediaTek. Lenovo led global PCs with a 25.5% share in Q3 2025, leveraging its cross-device Qira assistant to address enterprise data-sovereignty concerns.[4]Lenovo, “Lenovo Unveils Qira AI Assistant at CES 2026,” news.lenovo.com ASUS set a 30% APAC notebook-share goal for 2026, positioning AI PCs at its core, while Acer eyes double-digit regional growth and diversifies into air purifiers.
Rugged-device vendors are capitalizing on logistics and field-service digitalization; 5G handhelds now integrate barcode scanners, thermal cameras, and edge inference, replacing aging Windows CE terminals. Disruptors such as Transsion dominate ultra-low-cost smartphones in the Philippines and Africa, proving that sub-USD 100 price points can yield scale advantages. Realme’s return as an OPPO sub-brand in January 2026 signals consolidation at the mid-tier as marketing costs escalate. Tech differentiation centers on on-device generative AI; Samsung and OPPO have each demonstrated smartphones running large language models at ≥15 tokens per second, enabling real-time translation and content creation.
Legacy Japanese consumer-electronics brands are gradually exiting commoditized computing segments, pivoting to niche enterprise hardware and industrial PCs. Supply-chain resilience is emerging as a competitive moat; HP, Dell, Acer, and ASUS explored secondary DRAM suppliers in early 2026 to mitigate memory shortages. Meanwhile, regulatory compliance capabilities, especially in e-waste and data governance, are increasingly decisive in government and large-enterprise tenders. Partnerships between OEMs and fintech firms offering installment finance are also differentiating go-to-market execution in Indonesia, Vietnam, and the Philippines.
Asia-Pacific IT Device Industry Leaders
Apple Inc
Huawei Technologies Co., Ltd.
Xiaomi Corporation
Lenovo Group Limited
Samsung Electronics Co. , Ltd.
- *Disclaimer: Major Players sorted in no particular order

Recent Industry Developments
- February 2026: HP, Dell, Acer, and ASUS began evaluating DRAM supply from China’s ChangXin Memory Technologies amid a 90-95% jump in spot prices for mainstream memory.
- February 2026: Hyundai and Kia announced development of a custom AI chip for in-vehicle infotainment, signaling deeper vertical integration.
- January 2026: Xiaomi launched MiMo-V2-Pro and MiMo-V2-Omni AI models capable of fully on-device inference using 8-bit quantization.
- January 2026: LG Electronics unveiled its Micro RGB evo TV lineup with Tandem WOLED panels and the Alpha 11 processor.


Asia-Pacific IT Device Market Report Scope
The Asia-Pacific IT Device Market encompasses the production, distribution, and consumption of electronic computing and communication devices used for personal, enterprise, educational, and government applications across the region. This market includes a wide range of connected and non-connected hardware, including smartphones, tablets, laptops and notebooks, desktops and workstations, wearables, and PC monitors and peripherals.
The Asia-Pacific IT Device Market Report is Segmented by Device Type (Smartphones, Tablets, Laptops and Notebooks, Desktops and Workstations, Wearables, and PC Monitors and Peripherals), End-User Industry (Consumer, Enterprise, Government and Public Sector, and Education), Connectivity Technology (5G Enabled, 4G/LTE, Wi-Fi Only, and Wired), Distribution Channel (Offline Retail, Online Retail, Enterprise Direct Sales, and Value-Added Resellers), and Geography (China, Japan, India, South Korea, Australia and New Zealand, and Rest of Asia-Pacific). The Market Forecasts are Provided in Terms of Value (USD).
By Device Type
| Smartphones |
| Tablets |
| Laptops and Notebooks |
| Desktops and Workstations |
| Wearables |
| PC Monitors and Peripherals |
By End-User Industry
| Consumer |
| Enterprise |
| Government and Public Sector |
| Education |
By Connectivity Technology
| 5G Enabled |
| 4G/LTE |
| Wi-Fi Only |
| Wired |
By Distribution Channel
| Offline Retail |
| Online Retail |
| Enterprise Direct Sales |
| Value-Added Resellers |
By Geography
| China |
| Japan |
| India |
| South Korea |
| Australia and New Zealand |
| Rest of Asia Pacific |
| By Device Type | Smartphones |
| Tablets | |
| Laptops and Notebooks | |
| Desktops and Workstations | |
| Wearables | |
| PC Monitors and Peripherals | |
| By End-User Industry | Consumer |
| Enterprise | |
| Government and Public Sector | |
| Education | |
| By Connectivity Technology | 5G Enabled |
| 4G/LTE | |
| Wi-Fi Only | |
| Wired | |
| By Distribution Channel | Offline Retail |
| Online Retail | |
| Enterprise Direct Sales | |
| Value-Added Resellers | |
| By Geography | China |
| Japan | |
| India | |
| South Korea | |
| Australia and New Zealand | |
| Rest of Asia Pacific |


Key Questions Answered in the Report
What is the forecast size of Asia-Pacific IT device demand by 2031?
Regional spending is projected to reach USD 1.21 trillion by 2031, rising from USD 0.79 tillion in 2026 at an 8.73% CAGR.
Which device category is set to expand fastest through 2031?
Wearables are on track for a 9.93% CAGR as health-monitoring sensors and enterprise rugged use cases accelerate adoption.
How quickly are enterprise buyers boosting their hardware budgets?
Enterprise procurement is expected to grow at a 9.53% CAGR between 2026-2031 as hybrid-work and zero-trust security drive fleet refreshes.
Why do 5G handset upgrades still trail network coverage in the region?
A USD 100-150 chipset price premium and limited mid-tier use cases keep many users on 4G/LTE devices even where standalone 5G now blankets 80% of populations in key markets.
How are tightening e-waste regulations affecting electronics brands?
Mandatory producer fees, import bans on used devices, and higher recovery-rate targets are adding compliance costs and favoring large incumbents with dedicated recycling programs.
What share of smartphone shipments do the top five vendors control?
Samsung, Apple, Xiaomi, OPPO, and Vivo collectively hold roughly 60% of regional smartphone volumes, indicating moderate concentration.
Page last updated on:


