Market Overview
| Study Period | 2020 - 2031 |
|---|---|
| Forecast Data Period | 2026 - 2031 |
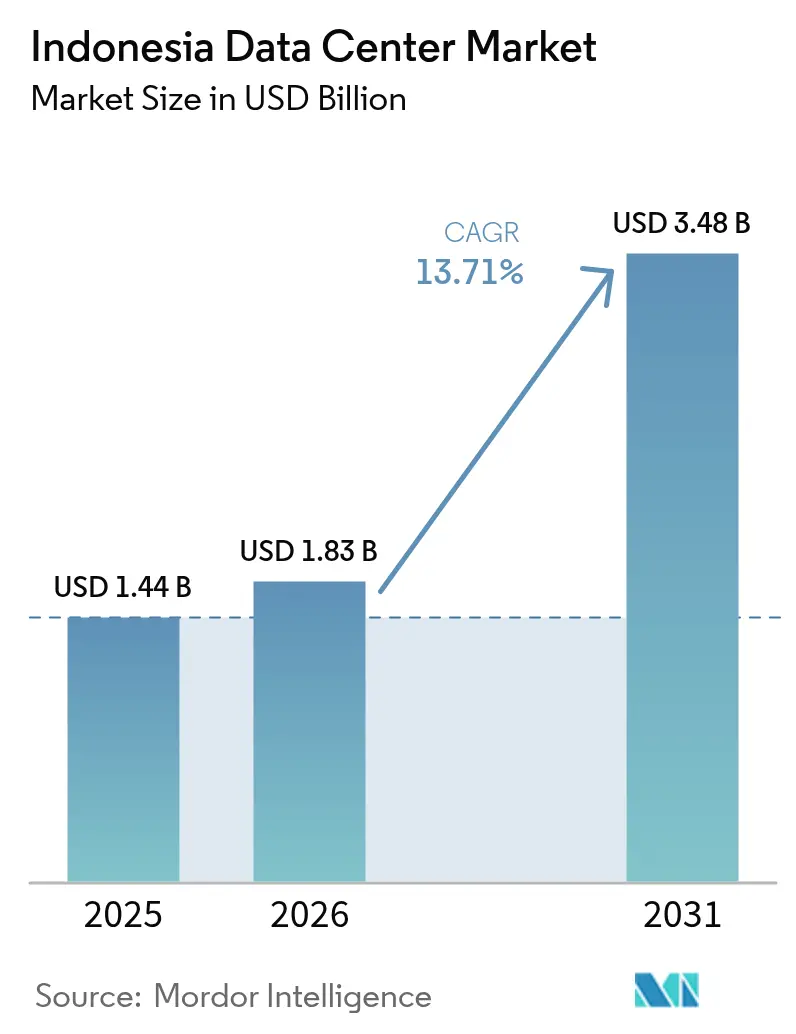
| Base Year Market Size (2025) | USD 1.44 Billion |
| Market Size (2026) | USD 1.83 Billion |
| Market Size (2031) | USD 3.48 Billion |
| Growth Rate (2026 - 2031) | 13.71% CAGR |
| Market Concentration | Medium |
Major Players *Disclaimer: Major Players sorted in no particular order Image © Mordor Intelligence. Reuse requires attribution under CC BY 4.0. | |
Indonesia Data Center Market Analysis by Mordor Intelligence
The Indonesia Data Center Market size was valued at USD 1.61 billion in 2025 and estimated to grow from USD 1.83 billion in 2026 to reach USD 3.48 billion by 2031, at a CAGR of 13.71% during the forecast period (2026-2031). In terms of IT load capacity, the market is expected to grow from 1.44 thousand megawatt in 2025 to 3.56 thousand megawatt by 2030, at a CAGR of 19.89% during the forecast period (2025-2030). The market segment shares and estimates are calculated and reported in terms of MW. Rapid hyperscaler roll-outs, tax exemptions that allow 100% foreign ownership in Special Economic Zones, and a sharp rise in digital consumption among 272 million residents position the Indonesia data center market as one of Southeast Asia’s most dynamic digital infrastructure frontiers.[1]Venkatachalam Anbumozhi, “Rethinking Asia’s Low-Carbon Growth in the Post-Covid World,” ERIA, eria.org Jakarta dominates capacity deployment due to its dense fiber network and submarine cable landing points, while Batam’s proximity to Singapore attracts spillover demand, accelerating greenfield builds. Colocation still commands most deployments, yet hyperscale investments are advancing more than 21% a year as global cloud providers localize platforms to comply with strict data-residency laws. Tier 3 designs remain the default architecture, reflecting enterprises’ need for concurrent maintainability without the premium of Tier 4, and long-term PLN power-purchase agreements unlock renewable megawatt blocks that support AI-ready configurations.
Key Report Takeaways
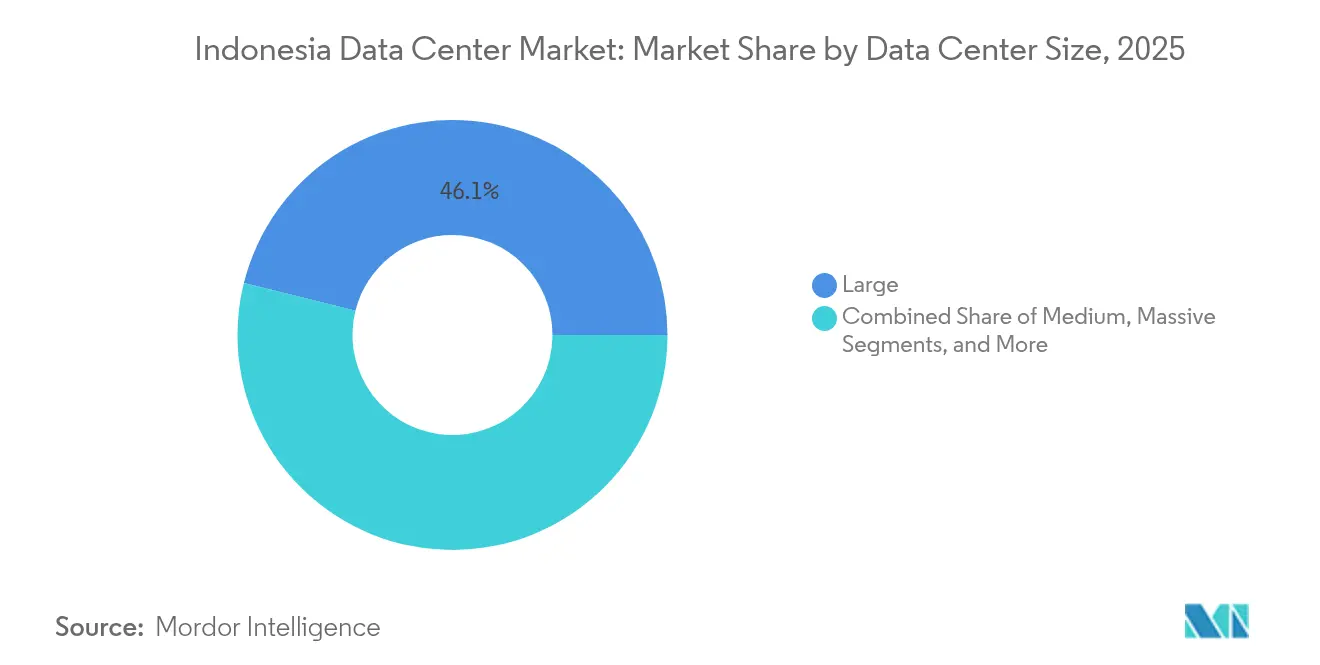
- By data center size, large accounted for 46.12% of the Indonesia data center market size in 2025; medium is advancing at a 21.18% CAGR to 2031.
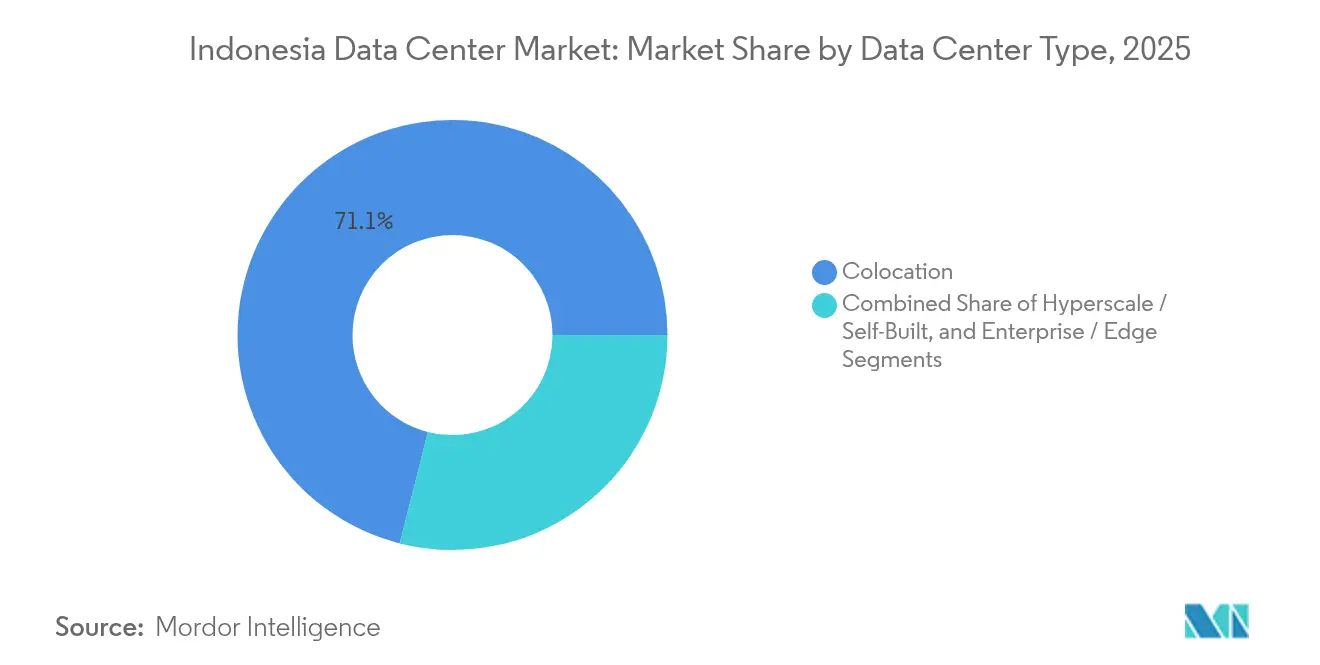
- By data center type, colocation accounted for 71.05% of the Indonesia data center market size in 2025; hyperscale deployments are advancing at a 20.95% CAGR to 2031.
- By tier standard, Tier 3 facilities captured 83.90% of the Indonesia data center market share in 2025 and are forecast to grow at a 20.31% CAGR through 2031.
- By end user industry, IT and telecom represented 51.10% of the Indonesia data center market size in 2025, whereas BFSI is set to post the fastest 19.92% CAGR by 2031.
- By hotspot, Jakarta held 56.72% of the Indonesia data center market share in 2025, while Batam is expanding at a 21.70% CAGR through 2031.
Note: Market size and forecast figures in this report are generated using Mordor Intelligence’s proprietary estimation framework, updated with the latest available data and insights as of 2026.
Indonesia Data Center Market Trends and Insights
Drivers Impact Analysis*
| Driver | (~) % Impact on CAGR Forecast | Geographic Relevance | Impact Timeline |
|---|---|---|---|
| Accelerating hyperscaler cloud region roll-outs (AWS, Microsoft, Google) | +4.2% | Jakarta, Batam, spill-over to West Java | Medium term (2-4 years) |
| Government tax incentives and eased foreign ownership for digital infrastructure | +3.1% | National, with early gains in Jakarta, Batam SEZ | Short term (≤ 2 years) |
| Rapidly rising internet and mobile data consumption among Indonesia's young population | +5.8% | Java-concentrated, urban centers nationwide | Long term (≥ 4 years) |
| Undersupply of Tier-3/4 capacity versus estimated 1 GW demand by 2030 | +3.7% | Jakarta metro, secondary cities (Surabaya, Bandung) | Medium term (2-4 years) |
| Secured long-term PLN PPAs enabling AI-ready megawatt blocks | +2.4% | Industrial zones with grid access (Cikarang, Batam) | Long term (≥ 4 years) |
| Batam SEZ emerging as spill-over hub for Singapore load balancing | +0.7% | Batam, potential extension to Riau Islands | Short term (≤ 2 years) |
| Source: Mordor Intelligence | |||


Accelerating Hyperscaler Cloud Region Roll-outs
AWS, Google Cloud, and Microsoft have each activated or announced multi-AZ regions, guaranteeing sub-20 ms latency for domestic workloads and driving a pipeline of wholesale colocation deals exceeding 250 MW in Jakarta and Batam. The Indosat–NVIDIA USD 250 million AI factory that went live in October 2024 already serves more than 20 Indonesian enterprises and plans to migrate from H100 to Blackwell GB200 GPUs within 18 months to satisfy generative-AI inferencing demand. Hyperscalers’ strict renewable-energy procurement policies catalyze long-term power contracts with PLN that bundle renewable certificates, helping operators meet sustainability targets. Local carriers benefit by bundling last-mile connectivity and managed services, which embeds stickiness in an enterprise market still migrating core systems to the cloud. These deployments anchor Indonesia in global traffic routes, redirecting workloads that would otherwise terminate in Singapore or Kuala Lumpur. The resulting capex cycle raises construction wages and tightens the skilled-labor pool, hastening the need for workforce upskilling agreements between providers and polytechnic institutes.
Government Tax Incentives and Eased Foreign Ownership
Indonesia allows 100% foreign ownership in data-center projects located within Special Economic Zones and grants accelerated depreciation on digital-infrastructure investments, lowering effective project IRR thresholds by 250–300 basis points for greenfield builds. Cikarang and Batam SEZs each offer 0% VAT on imported equipment, shaving up-front capex by around 11%. The streamlined Online Single Submission (OSS) system compresses approval timelines from 24 to as little as 10 weeks for compliant projects. These incentives have attracted joint ventures such as Korea Investment Partners–Sinar Mas Land and Digital Realty–Mitra Aditama, which collectively announced more than USD 750 million in commitments since 2024. Policymakers view digital infrastructure as a cornerstone for the USD 130 billion digital economy target by 2025, ensuring continuity of fiscal privileges even under changing administrations. While tariff holidays lower barriers, developers must still meet stringent local content requirements for construction materials, prompting partnerships with Indonesian EPC contractors.
Rapid Internet and Mobile Data Consumption
Average mobile data usage jumped from 7.2 GB per connection in 2020 to more than 14 GB in 2024 and is forecast to reach 22 GB by 2026. Nationwide smartphone penetration crossed 214.5 million users, with 79.5% of citizens online and daily internet usage averaging 7 hours 38 minutes. E-commerce GMV hit USD 65 billion in 2024 and underpins digital-payment volumes expected to top IDR 2,908 trillion (USD 188 billion) in 2025, which requires low-latency payment-gateway hosting inside the Indonesia data center market to comply with Bank Indonesia rules. Social-commerce livestreaming, already 12% of total GMV, further inflates video-traffic loads that hyperscalers must backhaul into GPU clusters for automated content moderation. As real-time gaming and ride-hailing adoption expands to tier-2 cities, operators are deploying micro-edge nodes to reduce backhaul congestion toward Jakarta cores. These trends highlight a sustained bandwidth multiplier effect that keeps the Indonesia data center market on a steep capacity curve for at least the next five years.
Undersupply of Tier 3/4 Capacity
Market demand models indicate a 1 GW shortfall in concurrently maintainable capacity by 2030, given that total live inventory stands near 1.44 GW and utilization in prime campuses already exceeds 70%. Jakarta land scarcity and grid-interconnect queues lengthen construction lead times to 30 months, compelling developers to adopt multi-story, high-power-density designs that reach 3.2 kW per square meter. EdgeConneX’s 200 MW pipeline and STT GDC’s 24 MW Jakarta-2 build only partially close the gap, ensuring pricing power for incumbent operators in wholesale negotiations. Enterprises migrating latency-sensitive workloads still face capacity bottlenecks and resort to hybrid clouds that interconnect domestic colocation with hyperscale nodes. The supply crunch is acute for Tier 4, where fewer than five facilities nationwide offer fault-tolerant specifications, and those footprints are almost fully pre-leased to BFSI and gaming customers. This imbalance reinforces the Indonesia data center market’s upward pricing trajectory until at least 2028, when large brownfield conversions in Bekasi are due to come online.
Restraints Impact Analysis*
| Restraint | (~) % Impact on CAGR Forecast | Geographic Relevance | Impact Timeline |
|---|---|---|---|
| Grid carbon intensity and coal reliance increasing sustainability compliance costs | -2.8% | National, acute in Java grid | Medium term (2-4 years) |
| High import tariffs and non-tariff barriers on critical IT and cooling equipment | -1.9% | National, affecting all facility types | Short term (≤ 2 years) |
| Permitting complexity and land-acquisition hurdles across multi-agency approvals | -1.5% | Urban centers, particularly Jakarta metro | Medium term (2-4 years) |
| Limited domestic skilled workforce for GPU-dense operations driving wage inflation | -1.2% | Jakarta, Batam, emerging tech hubs | Long term (≥ 4 years) |
| Source: Mordor Intelligence | |||
Grid Carbon Intensity Increases Compliance Costs
Coal still accounts for 40.5% of the national generation mix, exposing operators to Scope 2 emissions that conflict with the net-zero mandates of multinational clients.[2]Krissy Yustika, “Pathways to financial sustainability for PLN,” IEEFA, ieefa.org PLN’s financial reliance on IDR 123 trillion (USD 8 billion) in subsidies constrains the rapid build-out of renewable energy, forcing data-center developers to source off-grid solar-plus-storage or biomass co-firing contracts to meet their carbon budgets. Renewable energy certificates (RECs) sell at premium prices because supply lags behind demand, adding roughly USD 6 per MWh to power costs. Hyperscalers negotiate virtual PPAs but face counterparty risk until PLN finalizes unbundling of grid-injection rights. Further complicating matters, Bank Indonesia’s data center accreditation checklist now requires life-cycle carbon disclosures, increasing audit overhead for BFSI clients. Until large-scale hydropower from Papua is delivered in the 2030s, the Indonesian data center industry must balance growth aspirations with steep decarbonization expenses.
High Import Tariffs on Critical Equipment
Servers, chillers, and PDUs imported outside bonded logistics zones incur tariffs and VAT adding up to 17%, inflating capex per MW by USD 800,000 if operators fail to secure SEZ status.[3]U.S. Department of Commerce, “Indonesia – Market Challenges,” trade.gov Customs clearance for advanced immersion-cooling hardware can stretch beyond 60 days due to multi-agency inspections, delaying project timelines and triggering liquidated-damages clauses in hyperscale contracts. While local assembly of server racks exists, domestic manufacturing lacks the tolerance standards necessary for GPU-dense configurations, resulting in continued reliance on imports. The government’s proposal to waive duties on green-energy equipment has yet to be extended to data-center gear, although industry associations lobby for parity. As a stop-gap, operators stage critical components in Singapore free-trade warehouses, but round-trip logistics add at least eight calendar days and extra handling risk, negatively affecting project NPV.
*Our forecasts treat driver/restraint impacts as directional, not additive. The impact forecasts reflect baseline growth, mix effects, and variable interactions.
Segment Analysis
By Data Center Size: Large Footprints Retain Scale Advantage
Large facilities held 46.12% of the Indonesia data center market share in 2025, reflecting enterprises’ preference for single-campus solutions that offer resilient power, carrier-neutral connectivity, and campus-wide PUE below 1.5. The Indonesia data center market size for large builds is predicted to widen further as Telkom’s Cikarang expansion raises its campus capacity to 60 MW by 2025, and EdgeConneX commits to multi-phase developments of 30 MW each in Bekasi. Medium-sized facilities, however, are pacing the field with a 21.18% CAGR because distributed enterprises deploy edge nodes closer to users. Operators such as NeutraDC already run 19 micro-edge sites branded neuCentrIX across tier-2 cities, highlighting how geography drives smaller footprints. Mega and massive categories are emerging, exemplified by the Indosat–NVIDIA AI factory that reserves 80 MW for future phases, underlining how GPU clusters skew power density design toward 80 kW per rack. Small modular data centers remain niche, mainly supporting government edge workloads and rural connectivity pilots on outer islands. Overall, operators are diversifying build templates to strike a balance between Jakarta megawatts and the islands’ distributed latency needs, thus sustaining parallel demand across size cohorts.
Medium-size capacity gains are likely to accelerate once PLN’s substation upgrades in Surabaya and Bandung unlock 150 MVA of spare load by 2027. Developers deploying 4 – 6 MW pods in those metros can monetize demand from fintechs and e-commerce platforms that require sub-5 ms latency for payment processing. Meanwhile, hyperscalers continue to sign pre-lease agreements for entire data halls exceeding 10 MW each, anchoring large-site expansions. As a result, project financing models increasingly bundle diversified revenue streams, wholesale anchor tenants plus retail edge cages, to optimize capex payback under Indonesia’s 10-year tax-holiday horizon. The resulting hybrid business models underscore how the Indonesia data center market incentivizes flexible capacity planning to capture both scale and reach.


By Tier Standard: Tier 3 Dominates Enterprise Specifications
Tier 3 facilities captured 83.90% of the Indonesia data center market share in 2025 and will remain the de facto standard owing to concurrent maintainability that satisfies BFSI and telecom SLAs without the 35% cost premium of Tier 4 builds. Tier 4 supply is restricted to a handful of suites within major campuses where gaming publishers and high-frequency traders demand fault-tolerant uptime. Tier 1-2 footprints persist in edge deployments serving IoT and smart-city pilots in Balikpapan and Yogyakarta, where lifecycle economics trump redundancy. Regulatory checklists issued under the Personal Data Protection Law require dual-power feeds and N + 1 cooling, effectively making Tier 3 the entry barrier for new builds. NeutraDC’s Cikarang complex holds both Uptime Tier III and Tier IV certifications and utilizes modular electrical skids to facilitate seamless transitions between tiers, eliminating the need to migrate racks, a feature that appeals to enterprises scaling over time.
Future tier designs will incorporate sustainability metrics such as WUE and render traditional classifications less comprehensive. Operators are already integrating rooftop solar that supplies 5% of annual consumption, a figure expected to double once PLN finalizes net-metering rules. In addition, GPU-dense halls demand liquid-cooling loops that complicate tier labels because cooling redundancy becomes rack-level rather than hall-level. Despite such shifts, Tier 3 will retain dominance because it balances cost, compliance, and reliable uptime for 90% of enterprise workloads, thereby remaining integral to Indonesia's data center market growth.
By Data Center Type: Colocation Services Lead, Hyperscale Gains Velocity
Colocation controlled 71.05% of 2025 revenues, cementing its role as the default entry point for enterprises migrating on-premises IT into carrier-neutral environments. Retail colocation, priced on a per-rack model, caters to SMEs and public-sector agencies, while wholesale blocks above 250 kW cater to cloud and content networks. Hyperscale self-builds, although only 28.95% of installed MW, are expanding at 20.95% CAGR because global providers seek full-stack control over network, security, and sustainability. Deals such as AWS’s Jakarta Region lease-to-own model underscore how hyperscalers use colocation as a bridge until land acquisition clears regulatory checks. Edge and enterprise data centers round out the mix, providing latency-optimized hosting for streaming caches, telco control planes, and IoT device hubs located nearer to customer clusters.
Industry M&A is reshaping supply. IOH’s USD 170 million divestiture of data-center assets to BDx Indonesia in January 2024 signals how telcos monetize legacy capacity to reinvest in 5G. Telkom Indonesia’s ongoing strategic-investor hunt, advised by Goldman Sachs and Bank Mandiri, could unlock USD 1 billion for greenfield hyperscale campuses and further consolidate the Indonesia data center industry. As hyperscalers negotiate decade-long take-or-pay contracts, operators that can fund rapid, multi-phase builds stand to capture the lion’s share of incremental MW demand.
By End User Industry: IT and Telecom Drive Base Load; BFSI Scales Fast
IT and Telecom users generated 51.10% of 2025 revenue, leveraging pre-existing fiber assets and last-mile networks to bundle hosting, connectivity, and managed services. The Indonesia data center market benefits from telcos’ captive traffic, which guarantees baseline rack uptake during build-out phases. BFSI workloads, however, are projected to log a 19.92% CAGR through 2031 as digital banking, e-wallets, and peer-to-peer lending expand. Financial institutions must store primary and disaster-recovery data within the Indonesian jurisdiction, as mandated by Bank Indonesia Regulation 4/2023, which requires the use of domestic racks. E-commerce, now accounting for USD 65 billion in GMV, is another heavy consumer as marketplaces add AI-driven recommendation engines and same-day-delivery logistics platforms.
The public sector is emerging as a capacity anchor following the National Data Center’s commissioning in March 2025, in Cikarang. While the sovereign facility consolidates ministerial workloads, many regional agencies still contract private colocation for redundancy. The media-streaming and gaming sectors also expand their footprints for edge caching to maintain sub-50 ms round-trip latency across the archipelago. Manufacturing adoption is steadier, driven by Industry 4.0 retrofits requiring private 5G edge clouds inside industrial estates. Overall, diverse vertical demand adds resiliency to the Indonesia data center market, shielding operators from over-reliance on a single sector.
Geography Analysis
Jakarta’s role as Indonesia’s economic nerve center keeps it firmly atop deployment priorities. Its 56.72% share reflects unparalleled carrier density, with more than 180 on-net providers ensuring competitive cross-connect pricing that lowers total cost of ownership for tenants. The March 2025 commissioning of the National Data Center in Cikarang adds sovereign workloads to the metro and demonstrates government confidence in the corridor’s infrastructure resiliency Coupled with STT GDC's 24 MW Jakarta-2 groundbreaking and Telkom’s incremental 18 MW expansion, the area’s aggregate pipeline surpasses 400 MW through 2028.
Batam’s meteoric rise stems from policy and geography. SEZ incentives shave duty costs, and the island’s 25 ms round-trip latency to Singapore’s central business district makes it an attractive redundancy site. NeutraDC’s hyperscale campus and Princeton Digital Group’s 96 MW plan both exemplify how the island converts cross-strait cables into data-center demand. As Singapore extends its moratorium on power-intensive builds, Batam remains the primary overflow valve for regional workloads.
Secondary markets such as Surabaya and Bandung serve regional enterprises and content-delivery networks seeking to reduce latency for East Java’s 40 million residents. Telin’s neuCentrIX edge grid provides Tier-2 and Tier-3 sites across Denpasar, Makassar, and Balikpapan, collectively adding 4,167 sq m of white space that supports smart-city pilots and IoT backhaul. The Sulawesi coast may emerge as the next hotspot once the Bifrost Cable system delivers bandwidth headroom for media-streaming traffic. However, cost of capital and fiber-access bottlenecks keep these regions on a slower growth trajectory relative to Jakarta and Batam.
Competitive Landscape
Competition remains moderate as domestic telcos battle global hyperscalers and infrastructure-focused newcomers. Telkom’s NeutraDC leads with 42 MW live across 33 sites and 70% utilization, leveraging carrier ownership to bundle IP-transit at scale. EdgeConneX, Princeton Digital Group, and STT GDC join the fray with dedicated hyperscale campuses that promise sub-1.3 PUE designs and liquid-cooling-ready halls, underscoring how efficiency differentiates wholesale propositions. IOH’s USD 170 million asset sale to BDx Indonesia exemplifies consolidation, while Telkom’s planned equity divestiture aims to mobilize USD 1 billion for further expansion.
Global cloud providers deploy both self-build and lease models. AWS anchors its Jakarta Region in multiple availability zones, Google Cloud deepens enterprise alliances, and Microsoft targets hybrid deployments with telco partners. Their sustainability requirements accelerate renewable PPAs, which smaller domestic operators might struggle to secure at competitive tariffs, widening the gap in client acquisition. Strategic MoUs such as Telin-Equinix’s January 2025 accord signal co-operation on interconnection ecosystems that could blur competitive lines between carrier-owned and neutral colocation providers. Over the next five years, scale economics, renewable-energy sourcing, and edge-network coverage will dictate competitive positioning inside the Indonesia data center market.
Indonesia Data Center Industry Leaders
PT. Telkom Data Ekosistem (NeutraDC)
PT DCI Indonesia
Alibaba Cloud
NTT Ltd.
Amazon Web Services, Inc.
- *Disclaimer: Major Players sorted in no particular order

Recent Industry Developments
- March 2025: Indonesia’s National Data Center in Cikarang commenced operations, consolidating ministerial data on sovereign infrastructure.
- February 2025: Telin completed the Bifrost Cable landing in Manado and Jakarta, adding a new trans-Pacific bandwidth corridor.
- January 2025: Telin signed an MoU with Equinix to enhance cross-border interconnection for Indonesian enterprises.
- November 2024: PLN inked MoUs with Huawei and SDIC Power to accelerate grid digitalization and renewable hydropower development.


Indonesia Data Center Market Report Scope
Greater Jakarta are covered as segments by Hotspot. Large, Massive, Medium, Mega, Small are covered as segments by Data Center Size. Tier 1 and 2, Tier 3, Tier 4 are covered as segments by Tier Type. Non-Utilized, Utilized are covered as segments by Absorption.By Data Center Size
| Large |
| Massive |
| Medium |
| Mega |
| Small |
By Tier Standard
| Tier 1 and 2 |
| Tier 3 |
| Tier 4 |
By Data Center Type
| Hyperscale / Self-Built | ||
| Enterprise / Edge | ||
| Colocation | Non-Utilized | |
| Utilized | Retail Colocation | |
| Wholesale Colocation | ||
By End User Industry
| BFSI |
| IT and ITES |
| E-Commerce |
| Government |
| Manufacturing |
| Media and Entertainment |
| Telecom |
| Other End Users |
By Hotspot
| Jakarta |
| Batam |
| Rest of Indonesia |
| By Data Center Size | Large | ||
| Massive | |||
| Medium | |||
| Mega | |||
| Small | |||
| By Tier Standard | Tier 1 and 2 | ||
| Tier 3 | |||
| Tier 4 | |||
| By Data Center Type | Hyperscale / Self-Built | ||
| Enterprise / Edge | |||
| Colocation | Non-Utilized | ||
| Utilized | Retail Colocation | ||
| Wholesale Colocation | |||
| By End User Industry | BFSI | ||
| IT and ITES | |||
| E-Commerce | |||
| Government | |||
| Manufacturing | |||
| Media and Entertainment | |||
| Telecom | |||
| Other End Users | |||
| By Hotspot | Jakarta | ||
| Batam | |||
| Rest of Indonesia | |||


Market Definition
- IT LOAD CAPACITY - The IT load capacity or installed capacity, refers to the amount of energy consumed by servers and network equipments placed in a rack installed. It is measured in megawatt (MW).
- ABSORPTION RATE - It denotes the extend to which the data center capacity has been leased out. For instance, a 100 MW DC has leased out 75 MW, then absorption rate would be 75%. It is also referred as utilization rate and leased-out capacity.
- RAISED FLOOR SPACE - It is an elevated space build over the floor. This gap between the original floor and the elevated floor is used to accommodate wiring, cooling, and other data center equipment. This arrangement assist in having proper wiring and cooling infrastructure. It is measured in square feet (ft^2).
- DATA CENTER SIZE - Data Center Size is segmented based on the raised floor space allocated to the data center facilities. Mega DC - # of Racks must be more than 9000 or RFS (raised floor space) must be more than 225001 Sq. ft; Massive DC - # of Racks must be in between 9000 and 3001 or RFS must be in between 225000 Sq. ft and 75001 Sq. ft; Large DC - # of Racks must be in between 3000 and 801 or RFS must be in between 75000 Sq. ft and 20001 Sq. ft; Medium DC # of Racks must be in between 800 and 201 or RFS must be in between 20000 Sq. ft and 5001 Sq. ft; Small DC - # of Racks must be less than 200 or RFS must be less than 5000 Sq. ft.
- TIER TYPE - According to Uptime Institute the data centers are classified into four tiers based on the proficiencies of redundant equipment of the data center infrastructure. In this segment the data center are segmented as Tier 1,Tier 2, Tier 3 and Tier 4.
- COLOCATION TYPE - The segment is segregated into 3 categories namely Retail, Wholesale and Hyperscale Colocation service. The categorization is done based on the amount of IT load leased out to potential customers. Retail colocation service has leased capacity less than 250 kW; Wholesale colocation services has leased capacity between 251 kW and 4 MW and Hyperscale colocation services has leased capacity more than 4 MW.
- END CONSUMERS - The Data Center Market operates on a B2B basis. BFSI, Government, Cloud Operators, Media and Entertainment, E-Commerce, Telecom and Manufacturing are the major end-consumers in the market studied. The scope only includes colocation service operators catering to the increasing digitalization of the end-user industries.
| Keyword | Definition |
|---|---|
| Rack Unit | Generally referred as U or RU, it is the unit of measurement for the server unit housed in the racks in the data center. 1U is equal to 1.75 inches. |
| Rack Density | It defines the amount of power consumed by the equipment and server housed in a rack. It is measured in kilowatt (kW). This factor plays a critical role in data center design and, cooling and power planning. |
| IT Load Capacity | The IT load capacity or installed capacity, refers to the amount of energy consumed by servers and network equipment placed in a rack installed. It is measured in megawatt (MW). |
| Absorption Rate | It denotes how much of the data center capacity has been leased out. For instance, if a 100 MW DC has leased out 75 MW, then the absorption rate would be 75%. It is also referred to as utilization rate and leased-out capacity. |
| Raised Floor Space | It is an elevated space built over the floor. This gap between the original floor and the elevated floor is used to accommodate wiring, cooling, and other data center equipment. This arrangement assists in having proper wiring and cooling infrastructure. It is measured in square feet/meter. |
| Computer Room Air Conditioner (CRAC) | It is a device used to monitor and maintain the temperature, air circulation, and humidity inside the server room in the data center. |
| Aisle | It is the open space between the rows of racks. This open space is critical for maintaining the optimal temperature (20-25 °C) in the server room. There are primarily two aisles inside the server room, a hot aisle and a cold aisle. |
| Cold Aisle | It is the aisle wherein the front of the rack faces the aisle. Here, chilled air is directed into the aisle so that it can enter the front of the racks and maintain the temperature. |
| Hot Aisle | It is the aisle where the back of the racks faces the aisle. Here, the heat dissipated from the equipment’s in the rack is directed to the outlet vent of the CRAC. |
| Critical Load | It includes the servers and other computer equipment whose uptime is critical for data center operation. |
| Power Usage Effectiveness (PUE) | It is a metric which defines the efficiency of a data center. It is calculated by: (𝑇𝑜𝑡𝑎𝑙 𝐷𝑎𝑡𝑎 𝐶𝑒𝑛𝑡𝑒𝑟 𝐸𝑛𝑒𝑟𝑔𝑦 𝐶𝑜𝑛𝑠𝑢𝑚𝑝𝑡𝑖𝑜𝑛)/(𝑇𝑜𝑡𝑎𝑙 𝐼𝑇 𝐸𝑞𝑢𝑖𝑝𝑚𝑒𝑛𝑡 𝐸𝑛𝑒𝑟𝑔𝑦 𝐶𝑜𝑛𝑠𝑢𝑚𝑝𝑡𝑖𝑜𝑛). Further, a data center with a PUE of 1.2-1.5 is considered highly efficient, whereas, a data center with a PUE >2 is considered highly inefficient. |
| Redundancy | It is defined as a system design wherein additional component (UPS, generators, CRAC) is added so that in case of power outage, equipment failure, the IT equipment should not be affected. |
| Uninterruptible Power Supply (UPS) | It is a device that is connected in series with the utility power supply, storing energy in batteries such that the supply from UPS is continuous to IT equipment even during utility power is snapped. The UPS primarily supports the IT equipment only. |
| Generators | Just like UPS, generators are placed in the data center to ensure an uninterrupted power supply, avoiding downtime. Data center facilities have diesel generators and commonly, 48-hour diesel is stored in the facility to prevent disruption. |
| N | It denotes the tools and equipment required for a data center to function at full load. Only "N" indicates that there is no backup to the equipment in the event of any failure. |
| N+1 | Referred to as 'Need plus one', it denotes the additional equipment setup available to avoid downtime in case of failure. A data center is considered N+1 when there is one additional unit for every 4 components. For instance, if a data center has 4 UPS systems, then for to achieve N+1, an additional UPS system would be required. |
| 2N | It refers to fully redundant design wherein two independent power distribution system is deployed. Therefore, in the event of a complete failure of one distribution system, the other system will still supply power to the data center. |
| In-Row Cooling | It is the cooling design system installed between racks in a row where it draws warm air from the hot aisle and supplies cool air to the cold aisle, thereby maintaining the temperature. |
| Tier 1 | Tier classification determines the preparedness of a data center facility to sustain data center operation. A data center is classified as Tier 1 data center when it has a non-redundant (N) power component (UPS, generators), cooling components, and power distribution system (from utility power grids). The Tier 1 data center has an uptime of 99.67% and an annual downtime of <28.8 hours. |
| Tier 2 | A data center is classified as Tier 2 data center when it has a redundant power and cooling components (N+1) and a single non-redundant distribution system. Redundant components include extra generators, UPS, chillers, heat rejection equipment, and fuel tanks. The Tier 2 data center has an uptime of 99.74% and an annual downtime of <22 hours. |
| Tier 3 | A data center having redundant power and cooling components and multiple power distribution systems is referred to as a Tier 3 data center. The facility is resistant to planned (facility maintenance) and unplanned (power outage, cooling failure) disruption. The Tier 3 data center has an uptime of 99.98% and an annual downtime of <1.6 hours. |
| Tier 4 | It is the most tolerant type of data center. A Tier 4 data center has multiple, independent redundant power and cooling components and multiple power distribution paths. All IT equipment are dual powered, making them fault tolerant in case of any disruption, thereby ensuring interrupted operation. The Tier 4 data center has an uptime of 99.74% and an annual downtime of <26.3 minutes. |
| Small Data Center | Data center that has floor space area of ≤ 5,000 Sq. ft or the number of racks that can be installed is ≤ 200 is classified as a small data center. |
| Medium Data Center | Data center which has floor space area between 5,001-20,000 Sq. ft, or the number of racks that can be installed is between 201-800, is classified as a medium data center. |
| Large Data Center | Data center which has floor space area between 20,001-75,000 Sq. ft, or the number of racks that can be installed is between 801-3,000, is classified as a large data center. |
| Massive Data Center | Data center which has floor space area between 75,001-225,000 Sq. ft, or the number of racks that can be installed is between 3001-9,000, is classified as a massive data center. |
| Mega Data Center | Data center that has a floor space area of ≥ 225,001 Sq. ft or the number of racks that can be installed is ≥ 9001 is classified as a mega data center. |
| Retail Colocation | It refers to those customers who have a capacity requirement of 250 kW or less. These services are majorly opted by small and medium enterprises (SMEs). |
| Wholesale Colocation | It refers to those customers who have a capacity requirement between 250 kW to 4 MW. These services are majorly opted by medium to large enterprises. |
| Hyperscale Colocation | It refers to those customers who have a capacity requirement greater than 4 MW. The hyperscale demand primarily originates from large-scale cloud players, IT companies, BFSI, and OTT players (like Netflix, Hulu, and HBO+). |
| Mobile Data Speed | It is the mobile internet speed a user experiences via their smartphones. This speed is primarily dependent on the carrier technology being used in the smartphone. The carrier technologies available in the market are 2G, 3G, 4G, and 5G, where 2G provides the slowest speed while 5G is the fastest. |
| Fiber Connectivity Network | It is a network of optical fiber cables deployed across the country, connecting rural and urban regions with high-speed internet connection. It is measured in kilometer (km). |
| Data Traffic per Smartphone | It is a measure of average data consumption by a smartphone user in a month. It is measured in gigabyte (GB). |
| Broadband Data Speed | It is the internet speed that is supplied over the fixed cable connection. Commonly, copper cable and optic fiber cable are used in both residential and commercial use. Here, optic cable fiber provides faster internet speed than copper cable. |
| Submarine Cable | A submarine cable is a fiber optic cable laid down at two or more landing points. Through this cable, communication and internet connectivity between countries across the globe is established. These cables can transmit 100-200 terabits per second (Tbps) from one point to another. |
| Carbon Footprint | It is the measure of carbon dioxide generated during the regular operation of a data center. Since, coal, and oil & gas are the primary source of power generation, consumption of this power contributes to carbon emissions. Data center operators are incorporating renewable energy sources to curb the carbon footprint emerging in their facilities. |


Research Methodology
Mordor Intelligence follows a four-step methodology in all our reports.
- Step-1: Identify Key Variables: In order to build a robust forecasting methodology, the variables and factors identified in Step-1 are tested against available historical market numbers. Through an iterative process, the variables required for market forecast are set and the model is built on the basis of these variables.
- Step-2: Build a Market Model: Market-size estimations for the forecast years are in nominal terms. Inflation is not a part of the pricing, and the average selling price (ASP) is kept constant throughout the forecast period for each country.
- Step-3: Validate and Finalize: In this important step, all market numbers, variables and analyst calls are validated through an extensive network of primary research experts from the market studied. The respondents are selected across levels and functions to generate a holistic picture of the market studied.
- Step-4: Research Outputs: Syndicated Reports, Custom Consulting Assignments, Databases & Subscription Platforms


