Refurbished Computers and Laptops Market Size and Share
Market Overview
| Study Period | 2020 - 2031 |
|---|---|
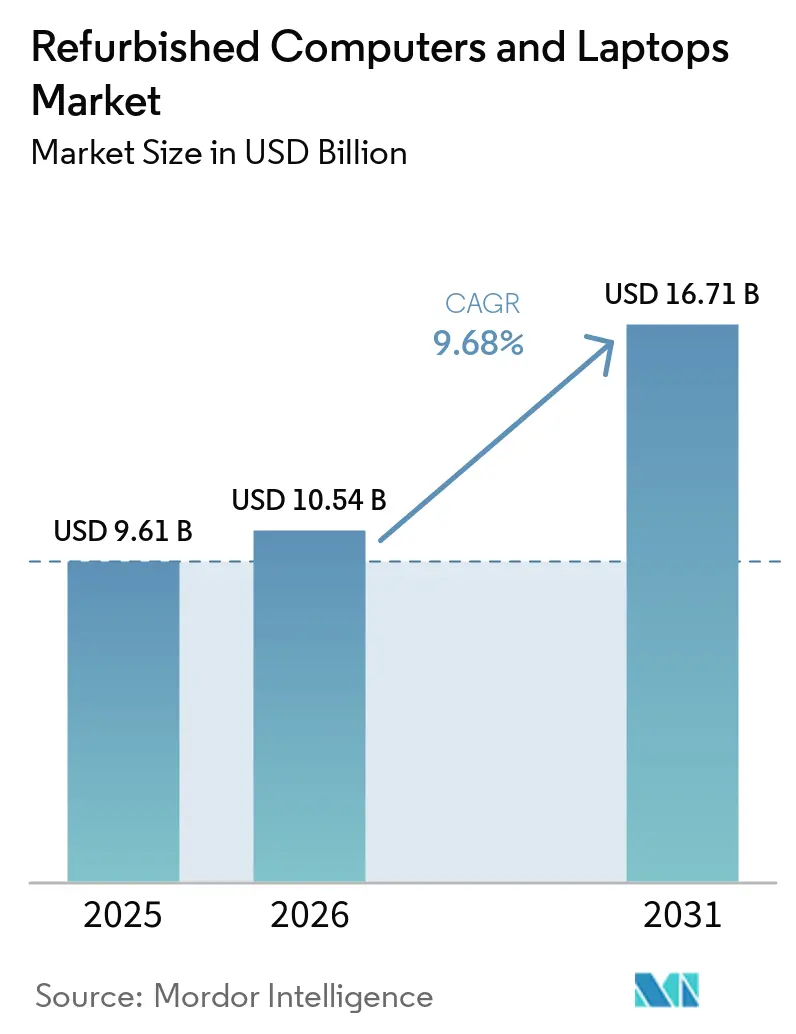
| Market Size (2026) | USD 10.54 Billion |
| Market Size (2031) | USD 16.71 Billion |
| Growth Rate (2026 - 2031) | 9.68% CAGR |
| Fastest Growing Market | Asia Pacific |
| Largest Market | North America |
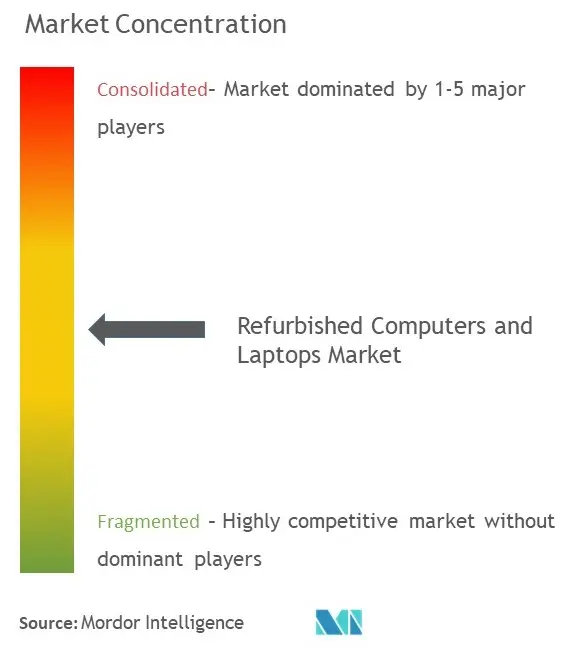
| Market Concentration | Medium |
Major Players *Disclaimer: Major Players sorted in no particular order Image © Mordor Intelligence. Reuse requires attribution under CC BY 4.0. | |
Refurbished Computers and Laptops Market Analysis by Mordor Intelligence
The refurbished computers and laptops market size is expected to grow from USD 9.61 billion in 2025 to USD 10.54 billion in 2026 and is forecast to reach USD 16.71 billion by 2031 at 9.68% CAGR over 2026-2031. Growth has been supported by rising corporate sustainability mandates, widening digital-inclusion programs, and rapid improvements in refurbishment standards that narrow the performance gap between used and new devices. Enterprises have embedded circular procurement targets into broader ESG scorecards, driving large-volume refresh cycles that create steady secondary-device supply. The market also benefits from the end-of-Windows-10 support and the nascent AI-PC upgrade wave, both of which are releasing high-specification assets into refurbishment streams. Online marketplaces continued to expand reach and transparency, improving buyer confidence through standardized grading, warranty harmonization, and carbon-impact labelling.
Key Report Takeaways
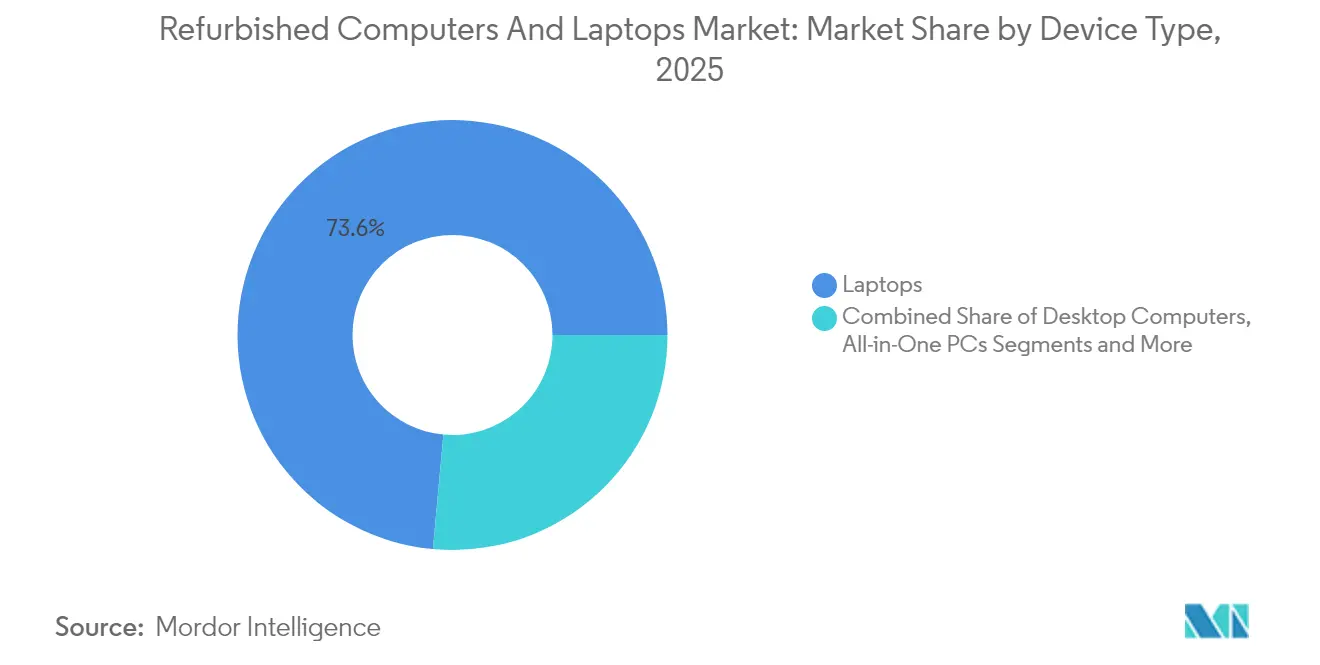
- By device type, laptops led with 73.55% of refurbished computers and laptops market share in 2025, while thin clients and mini PCs are forecast to expand at a 10.35% CAGR to 2031.
- By product grade, Grade A units captured 47.95% of the refurbished computers and laptops market size in 2025 and are advancing at a 9.92% CAGR through 2031.
- By operating system, Chrome OS devices represented the fastest-growing sub-segment at an 11.38% CAGR from 2026-2031.
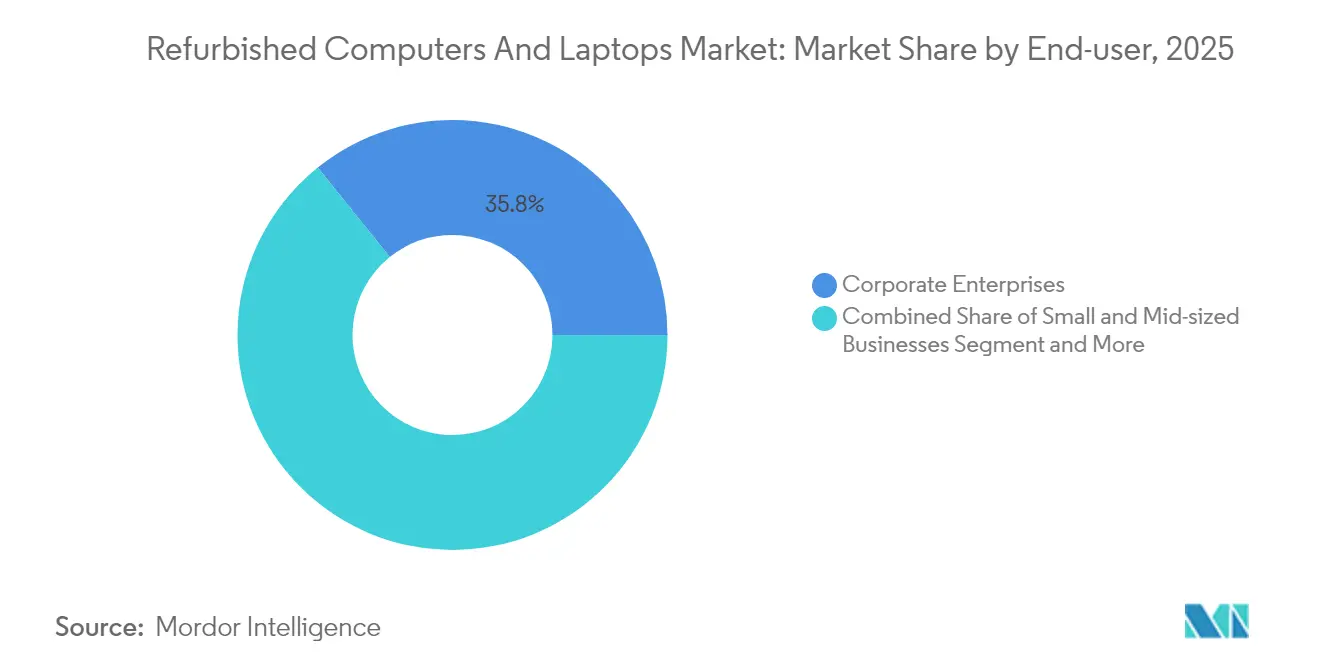
- By end-user, corporate enterprises held 35.78% revenue share in 2025; educational institutions record the highest projected CAGR at 10.14% through 2031.
- By distribution channel, online marketplaces commanded 62.74% of the refurbished computers and laptops market size in 2025 and are growing at an 11.28% CAGR.
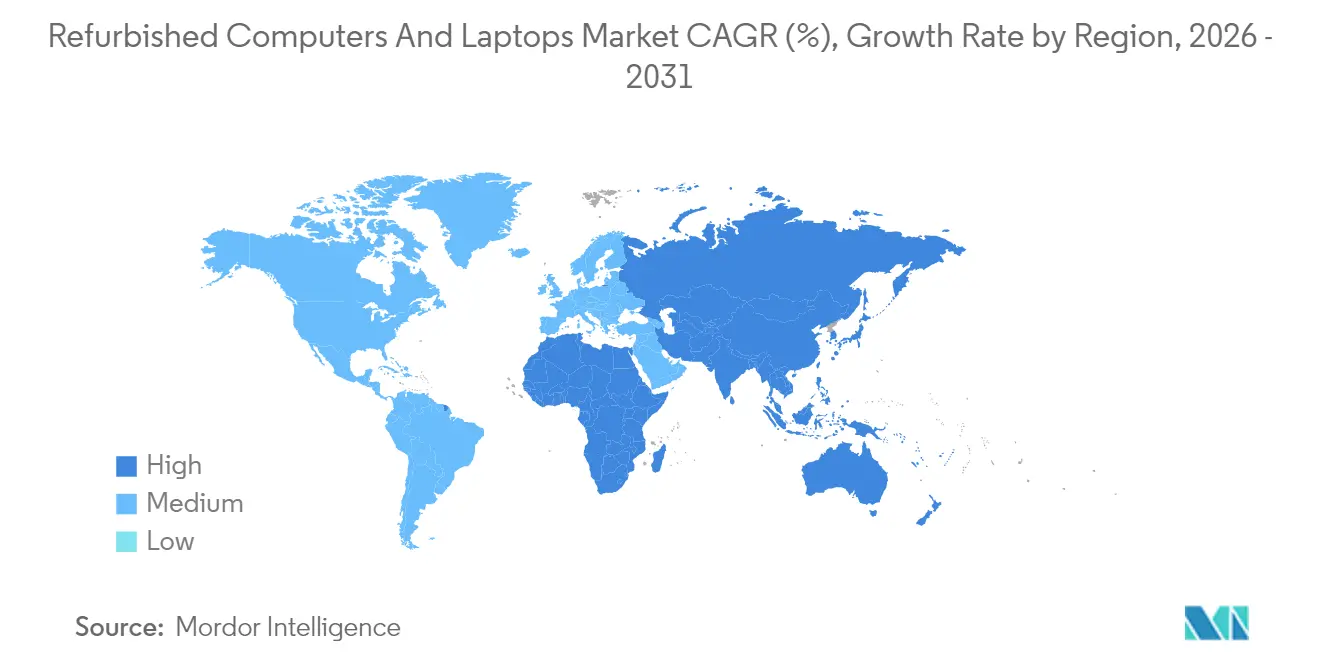
- By geography, North America led with 32.18% revenue share in 2025; Asia-Pacific is projected to expand at a 9.86% CAGR between 2026-2031.
Note: Market size and forecast figures in this report are generated using Mordor Intelligence’s proprietary estimation framework, updated with the latest available data and insights as of 2026.
Global Refurbished Computers and Laptops Market Trends and Insights
Drivers Impact Analysis*
| Driver | (~) % Impact on CAGR Forecast | Geographic Relevance | Impact Timeline |
|---|---|---|---|
| Cost-savings and affordability of refurbished devices | +3.2% | Global; highest in Asia-Pacific and Latin America | Short term (≤ 2 years) |
| Corporate ESG mandates favouring circular IT procurement | +2.1% | North America and Europe; emerging in Asia-Pacific | Medium term (2-4 years) |
| End-of-Windows-10 support expands Windows-11-ready used stock | +1.8% | Global; strongest in enterprise-heavy markets | Short term (≤ 2 years) |
| AI-PC upgrade cycle generates higher trade-in volumes | +1.5% | North America, Europe, developed Asia-Pacific | Medium term (2-4 years) |
| Growing e-waste regulations and consumer eco-awareness | +1.0% | Global; most stringent in EU | Long term (≥ 4 years) |
| Government green-procurement preferences | +0.8% | EU, North America, select Asia-Pacific states | Medium term (2-4 years) |
| Source: Mordor Intelligence | |||
Cost-savings and affordability of refurbished devices
Price-positioning remained the strongest near-term catalyst. Refurbished products typically carried a 30-70% discount versus new equivalents, delivering immediate budget relief for households and organizations alike. Enterprises managing multi-thousand-unit deployments reported that refurbished fleets generated equivalent user satisfaction with 20-40% lower total cost of ownership, once depreciation, warranty, and servicing were included. Schools leveraged the pricing gap to broaden one-to-one device ratios without exceeding public-funding envelopes. Marketplaces reinforced the value proposition by layering standardized condition grading and a one-year default warranty, limiting perceived downside risk. As inflationary pressures relaxed, affordability continued to underpin uptake in price-sensitive emerging markets, especially where financing options remained limited.
Corporate ESG mandates favouring circular IT procurement
Environmental scorecards moved from voluntary disclosure to mandatory reporting across many stock exchanges, incentivizing companies to quantify product-life extension. Dell pledged to reuse or recycle device volume equal to all new sales by 2030, a benchmark that formalized device take-back as a core KPI rather than a marketing pledge [1]Dell Technologies, “Accelerating the Circular Economy,” dell.com. Lenovo disclosed that 71% of collected devices were refurbished or redeployed rather than shredded, underscoring rapid operationalization of circular metrics. Corporate buyers incorporated lifecycle-carbon calculators into request-for-proposal templates, systematically rewarding vendors that supplied refurbished alternatives. The practice spread to global subsidiaries in Asia-Pacific, underpinning the region’s double-digit growth outlook and reinforcing the refurbished computers and laptops market as a pillar of enterprise climate strategy.
End-of-Windows-10 support expands “Windows-11-ready” used stock
Microsoft’s scheduled termination of Windows 10 security updates in October 2025 prompted firms to audit device fleets and prioritize hardware that met Windows 11’s Trusted Platform Module and CPU requirements. Industry estimates suggested that 40% of installed enterprise laptops required replacement, injecting a surge of three-to-five-year-old units into refurbishers’ pipelines. Microsoft Authorized Refurbishers gained early-mover advantage by bundling legitimate Windows 11 licences, easing compliance concerns for educational and public-sector buyers. As a result, Windows-11-certified refurbished devices commanded price premiums of 10-15% over Windows-10-only stock without slowing turnover, strengthening supply depth during the crucial 2025-2026 refresh window.
AI-PC upgrade cycle generates higher trade-in volumes
Rapid commercialisation of laptops featuring on-board neural processing units intensified refresh momentum. Enterprises pursuing local AI inference for privacy or latency reasons replaced otherwise serviceable systems, effectively front-loading the replacement cycle. Lenovo’s global trade-in program offered Visa gift-card rebates, orchestrating a closed-loop pipeline that channelled premium business-grade hardware into refurbishment centres. Resulting “AI-ready” secondary devices showcased high-resolution displays, 16 GB+ RAM, and NVMe storage, enabling refurbishers to broaden price bands while retaining attractive specifications. The segment’s growth improved average selling prices and margin mix across the refurbished computers and laptops market, pushing technology-lifecycle management firmly toward circular design.
Restraints Impact Analysis*
| Restraint | (~) % Impact on CAGR Forecast | Geographic Relevance | Impact Timeline |
|---|---|---|---|
| Warranty and quality-perception gaps | −1.2% | Global; heightened in emerging markets | Medium term (2-4 years) |
| Tight supply of premium-grade inventory (lease extensions) | −0.8% | North America, Europe | Short term (≤ 2 years) |
| Cross-border tariff and customs uncertainties on used IT | −0.7% | Global; disrupts inter-regional trade | Medium term (2-4 years) |
| High data-sanitisation compliance costs | −0.5% | Global; strictest where data-privacy laws prevail | Long term (≥ 4 years) |
| Source: Mordor Intelligence | |||
Warranty and quality-perception gaps
Historical inconsistencies in condition grading left lingering doubts among risk-averse buyers, and 68% of hesitant shoppers still cited warranty length as the primary barrier. Coverage varied from 90 days at smaller refurbishers to 12 months at brand-aligned outlets. Apple’s decision to match its new-product one-year warranty on Certified Refurbished devices nudged industry norms upward, yet disparity persisted across the long tail of vendors. To protect brand equity, premium marketplaces implemented strict seller scorecards, suspending partners whose defect rate exceeded 5%. Over time, clearer battery-health metrics and third-party inspection audits have narrowed perception gaps, but sustained marketing investments remain vital to accelerate broad enterprise adoption.
High data-sanitisation compliance costs
Regulations such as NIST SP 800-88 and the EU General Data Protection Regulation raised minimum erasure standards. Certified multi-pass wiping and serialised reporting added USD 18-35 per device to processing costs, a sizeable share of margin on lower-value units. [2]Bitraser, “NIST SP 800-88 Guidelines for Media Sanitization,” bitraser.com Automated hardware-level shredding mitigated labour expense, yet capital outlays for degaussers and compliance software locked out smaller entrants, reinforcing scale advantages for industrial refurbishers. Although efficiency gains tempered cost growth, the tension between stringent privacy protection and economic feasibility persisted, especially for bulk low-specification stock originating from consumer channels.
*Our forecasts treat driver/restraint impacts as directional, not additive. The impact forecasts reflect baseline growth, mix effects, and variable interactions.
Segment Analysis
By Device Type: Portable form factors anchor demand
Laptops maintained leadership, delivering 73.55% of refurbished computers and laptops market share in 2025 and remaining the cornerstone of multiyear corporate refresh cycles. Their portability, integrated battery, and uniform component ecosystem simplified large-scale redeployment, enabling refurbishers to secure higher recovery values than desktops. The refurbished computers and laptops market revealed that 2-year-old premium notebooks retained 60-70% of original RAM and SSD configurations, reducing rework costs and supporting a healthy resale premium. Thin clients and mini PCs represented the fastest-growing niche at a 10.35% CAGR through 2031, reflecting enterprise migration toward virtualized desktops and tighter energy budgets. Dell’s Wyse 5070 showcased how compact designs offered enterprise-grade performance with a 50% lower power draw.
Desktop towers preserved relevance where PCI-e expansion or raw processing power outweighed spatial constraints. Their share declined but stabilised in call-centre and engineering labs, where refurbishment economics delivered a compelling price-performance edge. All-in-One PCs expanded modestly as libraries and reception areas prioritised clutter-free workstations. Energy-efficiency certification emerged as a new differentiator; ENERGY STAR-labelled refurbished stock fetched 15-20% premiums and delivered measurable operating-cost savings, particularly attractive to procurement teams accountable for scope-2 emissions. Overall, device mix diversification strengthened supply continuity and allowed the refurbished computers and laptops market to satisfy budget, form-factor, and ESG criteria simultaneously.


By Product Grade: Premium refurbishment sets the benchmark
Grade A inventory accounted for 47.95% of the refurbished computers and laptops market size in 2025, expanding 9.92% annually as transparent grading systems improved buyer trust. The refurbished computers and laptops market established three broad quality tiers: pristine-cosmetic Grade A, value-balanced Grade B, and function-first Grade C. Dell’s explicit “New and Unused,” “Like New,” and “Scratch and Dent” labelling scheme illustrated best practice in expectation management. Premium positioning rested on multi-point diagnostics, battery-health assurances above 85%, and Microsoft-issued fresh operating-system licences, justifying a 25-35% higher average selling price relative to Grade B.
Grade B maintained steady traction among small and midsize businesses seeking resilient hardware at accessible pricing. Uniform performance testing reduced return rates below 4%, narrowing functional disparity between Grades A and B and ensuring low total cost of ownership. Grade C units met demand in cash-constrained settings, particularly vocational training centres, where cosmetic wear held minimal relevance. Emerging battery-health metrics and expansion of component warranties to 12 months even in Grade B stock signalled a sector-wide shift toward quality parity, further elevating the refurbished computers and laptops market’s reputation.
By Operating System: Chrome OS accelerates in academia
Windows devices retained 65.62% share in 2025, mirroring decades of entrenched enterprise adoption. The Windows-11 transition created two distinct sub-segments: non-compliant Windows-10 machines priced at deeper discounts and premium Windows-11-ready stock commanding higher valuations. Chrome OS, meanwhile, achieved an 11.38% CAGR through 2031, fuelled by district-level education contracts that prioritized web-based learning solutions. Refurbished Chromebooks were typically 50-70% cheaper than new models, encouraging wider student-device ratios without compromising update longevity.
MacOS devices carved a lucrative niche, bolstered by Apple’s end-to-end refurbishment process and brand loyalty. Two-year-old refurbished MacBooks retained 65-75% of initial sale value, outpacing Windows equivalents. Linux distributions remained marginal but served developers extending hardware life past official vendor support. Cloud-first application stacks flattened performance requirements across operating systems, enabling lower-specification refurbished stock to remain serviceable for routine productivity tasks, diversifying customer choice within the refurbished computers and laptops market.
By End-user: Education surges as budgets tighten
Corporate enterprises led with 35.78% revenue in 2025, embedding refurbished procurement into ESG scorecards and cost-optimisation frameworks. Many blue-chip companies stipulated that entry-level or non-customer-facing roles shall default to refurbished devices, reducing capital expenditure and supporting carbon-reduction targets. Educational institutions stood out as the fastest-growing group at a 10.14% CAGR, underpinned by pandemic-era digital-equity programs that transitioned into permanent one-device-per-student objectives. Non-profits such as Laptops4Learning demonstrated how circular IT could merge affordability and environmental stewardship.
Small and midsize enterprises adopted refurbished fleets to balance cash preservation with workforce digitalisation. Government departments started setting minimum percentages for reused equipment in tender documents, stimulating demand for fully compliant Grade A stock with comprehensive audit trails. The personal/home segment showcased heterogeneous needs; budget-conscious families prioritised price, whereas creatives gravitated toward refurbished MacBooks for high-value performance. Device-as-a-Service subscriptions, bundling refurbished hardware, financing, and remote support, gained traction as organisations sought predictability and operational agility, elevating lifetime-service revenue streams across the refurbished computers and laptops market.
By Distribution Channel: E-commerce platforms redefine trust
Online marketplaces commanded 62.74% of 2025 revenue, advancing at 11.28% CAGR as they streamlined discovery, grading transparency, and warranty uniformity. Back Market’s standard one-year warranty and 25-point inspection set a consumer-friendly baseline, driving repeat-purchase rates above 30%. Amazon Renewed applied similar protocols, leveraging its fulfilment network to shorten delivery times and facilitate easy returns. Manufacturer-certified portals—Apple, Dell, HP, Lenovo—captured premium clientele by guaranteeing original-part replacement and direct service integration.
Independent retailers retained regional importance where e-commerce penetration remained low, offering face-to-face consultation and optional hardware customisation. Offline wholesalers and VARs supplied volume orders to large enterprises, bundling imaging, asset-tagging, and deployment services. Across channels, emissions-avoided calculators gained traction; Philips highlighted carbon-savings data alongside prices to quantify the environmental dividend. Enhanced transparency reinforced buyer confidence, enlarging the addressable pool for the refurbished computers and laptops market far beyond traditional bargain hunters.
Geography Analysis
North America preserved leadership with 32.18% of global sales in 2025. Mature IT asset disposition infrastructure ensured predictable inflows of ex-corporate devices, while stringent e-waste regulations aligned economic incentives with environmental targets. The growth of the North America IT Asset Disposition Market continues to strengthen refurbishment supply chains by facilitating secure device recovery, data sanitization, and remarketing of enterprise hardware. United States school districts used refurbished fleets to narrow connectivity gaps; nonprofit Digitunity alone distributed over 41,000 units to learners between 2021-2024, illustrating market scale. Canada’s federal-procurement guidelines mandated environmental-benefit scoring, fuelling institutional demand. Mexican SMBs accelerated adoption as e-commerce logistics improved cross-border supply and peer warranties.
Europe operated under the world’s most advanced circular-economy framework, driving both supply quality and end-user confidence. The United Kingdom and Germany spearheaded refurbishment centres certified to ISO 14001 environmental standards. France’s repairability-index labelling raised consumer awareness, nudging buyers toward refurbished alternatives with visible sustainability scores. Regional preference for premium Grade A stock enabled higher average selling prices, sustaining margins despite intense competition. EU-wide green public procurement directives stipulated minimum recycled or refurbished content, institutionalising demand that will underpin long-term growth of the refurbished computers and laptops market.
Asia-Pacific emerged as the fastest-expanding territory at a 9.86% CAGR from 2026-2031. Japan and South Korea’s sophisticated reverse-logistics operations supplied high-grade devices to domestic and export markets. India’s Digital India initiative catalysed public-private programmes that equipped rural schools with affordable refurbished laptops, and local platforms such as Budli.in elevated grading and warranty standards. China balanced vast domestic refurbishment capacity with restrictive import rules, compelling global refurbishers to partner with licensed local operators. Multinational corporations rolled out uniform circular-IT KPIs, injecting consistent procurement volumes and accelerating regional professionalism across the refurbished computers and laptops market.

Competitive Landscape
Competition remained moderate and diversified across three structural layers. OEM-certified programmes from Apple, Dell, HP, and Lenovo dominated the premium bracket by exploiting controlled supply, original-parts replacement, and brand trust. These vendors bundled extended warranties and direct financing, reinforcing one-stop convenience for enterprises pursuing single-vendor frameworks. Specialised marketplaces such as Back Market and Amazon Renewed aggregated multi-source inventory under unified quality metrics, achieving marketing economies of scale and high site traffic that small refurbishers could not match.
The mid-tail featured region-specific refurbishers like Kimbrer Computer, Recompute, and Ecofurb, who differentiated through sector expertise or value-added services such as asset imaging and deployment. Service-led disruptors introduced Device-as-a-Service models combining refurbished hardware, OS licencing, endpoint security, and refresh swaps every 24–36 months, targeting CFOs seeking predictable cash flow. Technology leadership hinged on automated diagnostic suites; leaders deployed AI-based visual-inspection systems that detected micro-scratches and keyboard wear, cutting manual review time by up to 40%.
Strategic moves intensified throughout 2024-2025. HP extended its Certified Refurbished PC program to the United Kingdom, widening European reach and signalling confidence in localised circular-economy demand. Lenovo’s enhanced global trade-in scheme embedded circular loops into point-of-sale touchpoints, while Dell’s Device Life Extension Service offered modular upgrades to prolong useful life before units entered the secondary market. Back Market’s USD 380 million Series E accelerated geographic expansion and bolstered AI-driven quality-control engines, raising competitive thresholds for new entrants. The refurbished computers and laptops market consequently grew more professional, service-centric, and capital-intensive.
Refurbished Computers and Laptops Industry Leaders
Apple Certified Refurbished
Dell Refurbished
Lenovo Renew
HP Renew
Amazon Renewed
- *Disclaimer: Major Players sorted in no particular order

Recent Industry Developments
- May 2025: HP expanded its Certified Refurbished PC program to the UK market, offering sustainable options to partners serving cost-conscious customers.
- April 2025: Lenovo launched a global Trade-In Program exchanging old devices for Visa gift cards usable on new purchases, strengthening circular material flows.
- March 2025: Dell introduced Device Life Extension Service, adding performance upgrades to elongate device life cycles before refurbishment.
- January 2025: Dell, HP, and Lenovo unveiled business laptops with on-board AI acceleration, foreshadowing a wave of premium trade-ins.


Research Methodology Framework and Report Scope
Market Definitions and Key Coverage
Our study defines the refurbished computers and laptops market as revenue generated from certified devices that have undergone systematic inspection, component repair or upgrade, secure data wiping, and repackaging before resale with a limited warranty.
Scope Exclusions: Units sold "as-is," tablets, smartphones, and loose spare parts sit outside our coverage.
Segmentation Overview
- By Device Type
- Desktop Computers
- Laptops
- All-in-One PCs
- Thin Clients / Mini PCs
- By Product Grade
- Grade A (Like New)
- Grade B (Good)
- Grade C (Functional)
- By Operating System
- Windows
- macOS
- Chrome OS
- Linux / Other
- By End-user
- Corporate Enterprises
- Small and Mid-sized Businesses
- Educational Institutions
- Government and Public Sector
- Personal / Home Users
- Other End-users
- By Distribution Channel
- Online Marketplaces
- Manufacturer / Certified Refurb Stores
- Independent Retailers
- Offline Wholesalers and VARs
- By Geography
- North America
- United States
- Canada
- Mexico
- South America
- Brazil
- Argentina
- Rest of South America
- Europe
- Germany
- United Kingdom
- France
- Italy
- Spain
- Russia
- Rest of Europe
- Asia-Pacific
- China
- Japan
- India
- South Korea
- ASEAN
- Rest of Asia-Pacific
- Middle East and Africa
- Middle East
- Saudi Arabia
- United Arab Emirates
- Turkey
- Rest of Middle East
- Africa
- South Africa
- Nigeria
- Kenya
- Rest of Africa
- Middle East
- North America
Detailed Research Methodology and Data Validation
Primary Research
Mordor analysts interviewed refurbishers, corporate IT buyers, university tech-desk heads, and major marketplace operators across North America, Europe, and Asia-Pacific. Discussions clarified grade mixes, typical pass-through yields, regional average selling prices, and gaps left by public data, enabling us to tighten model assumptions.
Desk Research
We built the baseline with public datasets such as UN Comtrade, US ITC tariff files, Eurostat, and India's DGFT import logs, which reveal cross-border flows of second-hand PCs. E-waste volumes from the Global E-Waste Monitor, refresh-cycle notes from IDC and BSA, and circular-IT white papers from regional refurbisher associations supplied context on stock availability. Company 10-Ks, SEC filings, and press releases showed off-lease returns and warranty program rollouts. Subscription resources, including D&B Hoovers for financial cues and Dow Jones Factiva for deal news, helped us cross-check inventory liquidation values. These sources illustrate our secondary backbone; many other open documents informed finer validations.
Market-Sizing & Forecasting
A top-down construct starts with new PC and laptop shipments, applies average refresh intervals, and layers verified take-back penetration to size the pool eligible for refurbishment. Observed pass-through rates and weighted ASP bands convert this pool to value. Supplier roll-ups and sampled marketplace listings provide bottom-up checkpoints that fine-tune totals. Key variables like enterprise refresh cadence, e-waste legislation milestones, online marketplace share, grade-A yield, and regional ASP convergence feed a multivariate regression that extends forecasts to 2030. Interview consensus bounds any assumption lacking hard data.
Data Validation & Update Cycle
Outputs pass peer review and variance checks against trade flows, marketplace revenue signals, and macro indicators before sign-off. Reports refresh each year, with interim updates when material regulatory or supply events arise. A final analyst sweep ensures clients receive the newest view.
Why Our Refurbished Computers and Laptops Baseline Commands Reliability
Published estimates often diverge because firms choose different device mixes, grade thresholds, ASP deflators, and refresh cadences.
By anchoring scope to certified grade-based units, refreshing annually, and running dual-pass modeling, Mordor minimizes both over-counting of low-grade stock and under-counting of corporate off-lease pools.
Benchmark comparison
| Market Size | Anonymized source | Primary gap driver |
|---|---|---|
| USD 9.61 B (2025) | Mordor Intelligence | - |
| USD 5.7 B (2025) | Global Consultancy A | Excludes refurbished desktops; applies uniform 45 % ASP discount |
| USD 8.16 B (2025) | Industry Research B | Laptops only; sizes market via e-waste trend proxy |
These comparisons show that Mordor's balanced inclusion of all certified device types and its transparent variable mix deliver a dependable starting point for strategic decisions.


Key Questions Answered in the Report
What was the refurbished computers and laptops market size in 2026?
The refurbished computers and laptops market generated USD 10.54 billion in 2026 and is forecast to reach USD 16.71 billion by 2031.
Which device segment leads the refurbished computers and laptops market?
Laptops remained dominant, providing 73.55% of 2025 revenue, thanks to high corporate refresh rates and strong residual value.
Why are educational institutions driving growth?
Schools and universities adopted refurbished units to stretch limited budgets and meet digital-access goals, producing a 10.14% CAGR for the segment through 2031.
How do online marketplaces build buyer confidence?
Platforms such as Back Market and Amazon Renewed use multi-point inspections, seller scorecards, and one-year standard warranties to reduce quality concerns.
What impact will Windows 11 have on refurbished supply?
End-of-support for Windows 10 in 2025 is prompting enterprises to offload large fleets of still-functional devices, expanding Windows-11-ready refurbished inventory.
Are refurbished devices environmentally beneficial?
Yes. Choosing refurbished hardware avoids the embodied carbon of new manufacturing and diverts e-waste from landfills, aligning with corporate and governmental ESG targets.
Page last updated on:


