
Technology, Media and Telecom
5th MayPricing Strategy for Semiconductor Components
3 Min Read
Indonesia E-Services Market Report is Segmented by Type (Online Gambling, Online Education and More), Payment Method (Digital Wallets, Credit/Debit Cards, Bank Transfers / VA and More), Platform (Mobile Apps, Web Browser, Super-App Integration), Age Group (15-24 Years, 25-34 Years and More). The Market Forecasts are Provided in Terms of Value (USD).
Market Overview
| Study Period | 2020 - 2031 |
|---|---|
| Base Year For Estimation | 2025 |
| Forecast Data Period | 2026 - 2031 |
| Market Size (2026) | USD 2.22 Billion |
| Market Size (2031) | USD 3.84 Billion |
| Growth Rate (2026 - 2031) | 11.56 % CAGR |
| Market Concentration | Medium |
Major Players *Disclaimer: Major Players sorted in no particular order. Image © Mordor Intelligence. Reuse requires attribution under CC BY 4.0. |
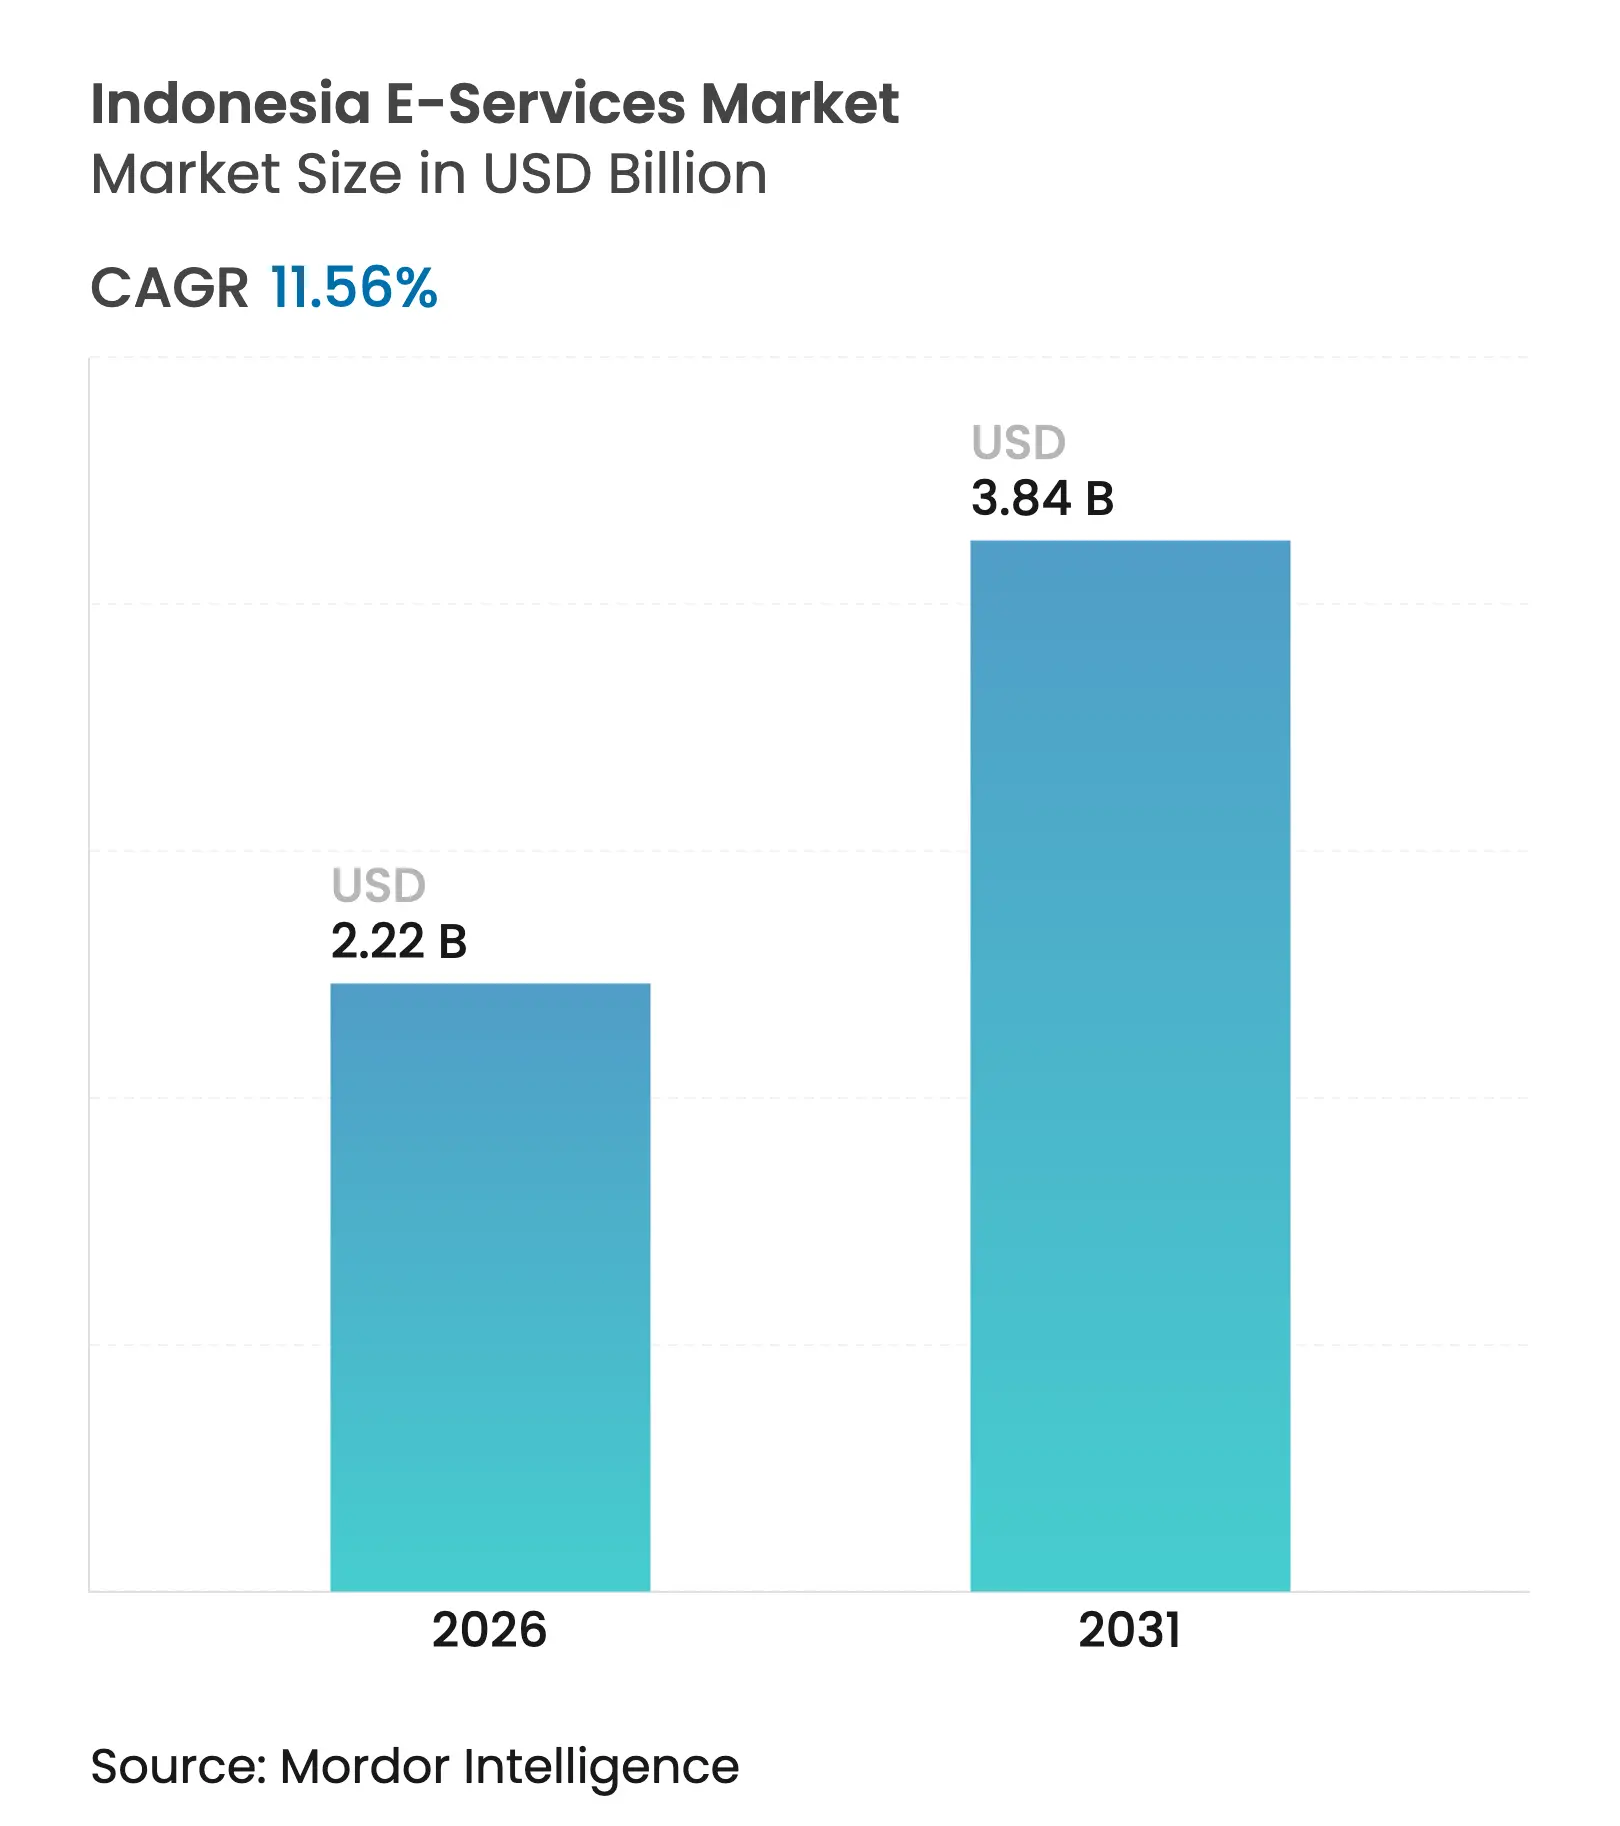
The Indonesia E-Services Market size in 2026 is estimated at USD 2.22 billion, growing from 2025 value of USD 1.99 billion with 2031 projections showing USD 3.84 billion, growing at 11.56% CAGR over 2026-2031. This expansion mirrors the country’s status as Southeast Asia’s largest digital economy, underpinned by its fourth-largest global population, widening smartphone use, and nationwide connectivity spending. Super-app integration reshapes service delivery, while QR-code interoperability and real-time payment rails lower transaction frictions. Government incentives, from tax breaks to the Payment Systems Blueprint 2030, attract foreign capital into satellites, fibre backbones, and AI hubs. Younger digital-native cohorts fuel demand for education, entertainment, and social commerce, yet regulatory crack-downs on illegal gambling and stricter data-privacy rules temper short-term growth. Competition intensifies as entrenched ecosystems such as GoTo and Shopee leverage scale advantages, while newcomers confront licensing and localisation hurdles.
Key Report Takeaways
Note: Market size and forecast figures in this report are generated using Mordor Intelligence's proprietary estimation framework, updated with the latest available data and insights as of 2026.
Drivers Impact Analysis
| Driver | (~) % Impact on CAGR Forecast | Geographic Relevance | Impact Timeline | |||
|---|---|---|---|---|---|---|
Rise in
mobile super-apps
Rise in
mobile super-apps
| +2.8% | Nationwide, strongest in Java and other large urban areas | Medium term (2-4 years) |
(~)
% Impact on CAGR Forecast
:
+2.8%
|
Geographic
Relevance
:
Nationwide,
strongest in Java and other large urban areas
|
Impact
Timeline
:
Medium
term (2-4 years)
|
Expansion
of digital payment infrastructure
Expansion
of digital payment infrastructure
| +2.1% | Nationwide, led by Java, Sumatra and Bali | Short term (≤2 years) | |||
Gen-Z
demand for OTT education and entertainment
Gen-Z
demand for OTT education and entertainment
| +1.9% | Nationwide, higher penetration in cities | Medium term (2-4 years) | |||
Government
digital-economy incentives and tax breaks
Government
digital-economy incentives and tax breaks
| +1.6% | Nationwide, with extra focus on outer-island development | Long term (≥4 years) | |||
Social-commerce
and livestream monetisation
Social-commerce
and livestream monetisation
| +1.4% | Nationwide, particularly strong in Java and Sumatra | Short term (≤2 years) | |||
Satellite
and FTTH roll-outs bridging connectivity gaps
Satellite
and FTTH roll-outs bridging connectivity gaps
| +1.2% | Outer islands: Kalimantan, Sulawesi, Maluku and Papua | Long term (≥4 years) | |||
| Source: Mordor Intelligence | ||||||
Rise in Accessibility via Mobile “Super-Apps
Consolidation around multi-service apps reshapes the Indonesia digital services market. TikTok’s USD 1.5 billion purchase of a 75% stake in Tokopedia combines social and conventional commerce, enabling the pair to tap 130 million local TikTok users.[1]South China Morning Post, “'From enemies into allies': TikTok's Tokopedia deal seen as a game-changer,” scmp.com GoTo’s own ecosystem posted a 74% year-on-year jump in core GTV to Rp72 trillion in Q3 2024 as ride-hailing, food delivery, and fintech converged. Nine government super-apps set for launch integrate digital ID, health, and welfare services, illustrating public-sector endorsement of the model. Unified login lowers customer acquisition costs and lifts transaction frequency, establishing durable network effects across the Indonesia digital services market.
Rapid Expansion of Digital Payment Infrastructure
QRIS, the national QR-code standard, reached 48.9 million users and 31.9 million merchants by April 2024 after 194.06% annual growth, while transaction volumes climbed 217.33% by August 2024.[2]Perbanas, “QRIS Transaction Surge in 2024,” perbanas.org Bank Indonesia’s BI-FAST upgrades in 2025 require proactive fraud controls as the system processes rising online gambling flows. Lower fees and real-time settlement bring micro and small enterprises into formal finance, broadening the Indonesia digital services market’s consumer base.
Government Digital-Economy Incentives & Tax Breaks
The Digital Vision 2045 blueprint positions Indonesia to become the fifth-largest global economy, leveraging policies that funnel capital into AI, fibre, and satellite projects.[3]Telecom Review Asia Pacific, “Indonesia's Golden Egg: Vision 2045,” telecomreviewasia.com Nvidia’s USD 200 million AI centre in Surakarta, backed by Indosat, exemplifies how tax incentives and spectrum support attract high-value investments. Such projects lift productivity and innovation, driving sustainable expansion of the Indonesia digital services market.
Gen-Z Demand for OTT Education & Entertainment
Gen-Z, 26% of the population, underpins new consumption patterns that prize lifestyle, streaming, and upskilling content.[4]The Jakarta Post, “Youth consumption and its challenges,” thejakartapost.com Edtech player Cakap saw 158% revenue growth and 5 million students by mid-2024, indicating appetite for language and vocational learning. Film audiences are forecast to return to 60 million in 2024, confirming the rebound of entertainment platforms. Content localisation and flexible pricing remain vital to unlock Gen-Z spending across the Indonesia digital services market.
Restraints Impact Analysis
| Restraint | (~) % Impact on CAGR Forecast | Geographic Relevance | Impact Timeline | |||
|---|---|---|---|---|---|---|
Regulatory
crack-downs on gambling and social commerce
Regulatory
crack-downs on gambling and social commerce
| -2.3% | Nationwide, enforcement strongest in major cities | Short term (≤ 2 years) |
(~)
% Impact on CAGR Forecast
:
-2.3%
|
Geographic
Relevance
:
Nationwide,
enforcement strongest in major cities
|
Impact
Timeline
:
Short
term (≤ 2 years)
|
Cyber-security
and data-privacy gaps
Cyber-security
and data-privacy gaps
| -1.8% | Nationwide, felt most in financial-services platforms | Medium term (2-4 years) | |||
Patchy
broadband outside Java
Patchy
broadband outside Java
| -1.5% | Outer islands: Sumatra, Kalimantan, Sulawesi, Maluku, Papua | Long term (≥ 4 years) | |||
Cultural
and religious limits on dating and gambling platforms
Cultural
and religious limits on dating and gambling platforms
| -1.1% | Nationwide, greater effect in conservative provinces | Long term (≥ 4 years) | |||
| Source: Mordor Intelligence | ||||||
Regulatory Crack-Downs on Gambling & Social Commerce
The Ministry of Communication cut online gambling transactions from Rp21 trillion in Q1 2024 to Rp4 trillion by Q3 2024 through domain blocking and payment stops. TikTok Shop’s closure under Permendag 31/2023 led to Rp197 billion in lost sales before its Tokopedia merger secured compliance. Planned VPN bans and mandatory e-commerce licences raise entry barriers, delaying some revenue in the Indonesia digital services market but channelling spending to regulated platforms.
Cyber-Security & Data-Privacy Vulnerabilities
Bank Indonesia Regulation 2/2024 obliges payment firms to adopt layered defences, pushing up compliance costs. OJK’s 2025 digital asset framework imposes strict custody and disclosure rules on crypto exchanges. Recurrent data breaches have dented PayLater user trust, with platform reputation now a key determinant of borrowing intention. Providers must balance security spending with affordable service delivery to sustain momentum in the Indonesia digital services market.
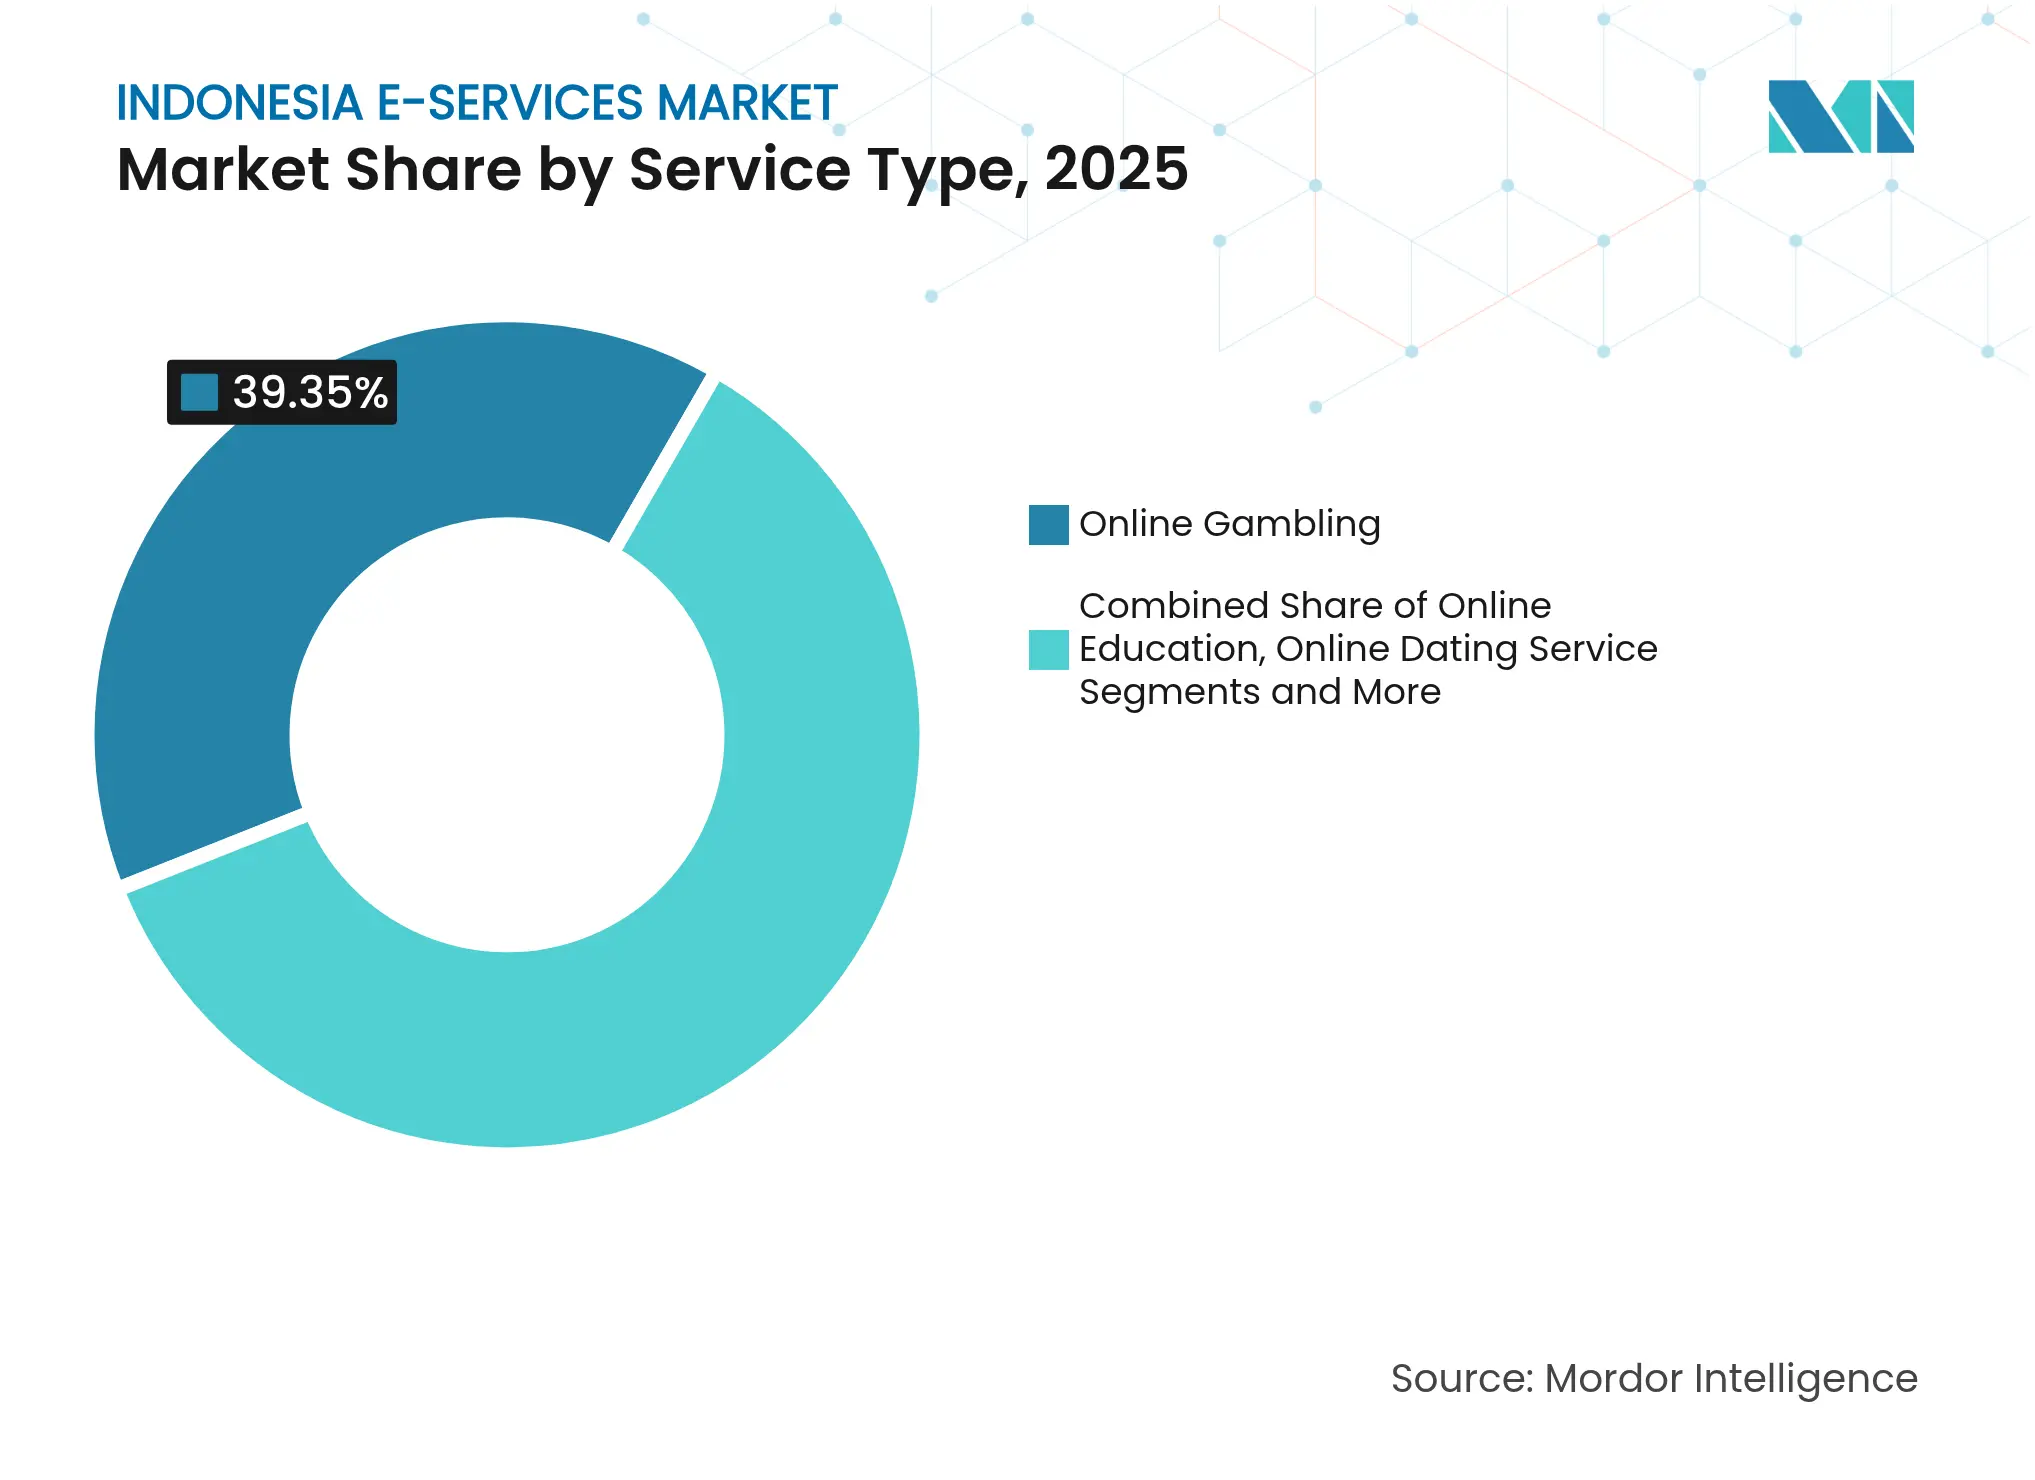
By Service Type: Gambling Dominates Despite Headwinds
Online Gambling controlled 39.35% of the Indonesia digital services market share in 2025, retaining a large audience despite tightened enforcement. Quarterly transaction value, however, fell from Rp21 trillion to Rp4 trillion after payment and VPN restrictions, signalling effective short-term deterrence. Sports betting and casino formats now seek alternative gateways, while compliant entertainment services profit from redirected spend. Professional & Vocational Online Education is forecast to grow at 17.95% CAGR, supported by corporate upskilling budgets and government workforce programmes. Providers emphasise micro-credentials and live tutoring to differentiate in a crowded field. K-12 supplements consolidate as weaker players exit, whereas event ticketing recovers with travel and concerts. Online dating expands slowly, constrained by cultural norms yet sustained by freemium tiers.The Indonesia digital services market size for gambling is still projected to rise modestly given entrenched user habits, though its growth rate will trail education and entertainment. Education platforms leverage adaptive curricula to target non-Java regions, broadening addressable demand. Ticketing services now integrate with super-apps to provide seamless journey planning. Dating platforms localise safety features and payment options to heighten trust.
Note: Segment shares of all individual segments available upon report purchase
By Payment Method: Digital Wallets Lead as BNPL Surges
Digital Wallets held 52.35% of the Indonesia digital services market size in 2025 as QRIS interoperability simplified scanning and settlement. High merchant acceptance and cashback campaigns cement wallet primacy, though fee caps challenge profitability. Buy-Now-Pay-Later usage is set to climb at 17.45% CAGR as underbanked consumers seek flexible credit. Regulators have introduced disclosure norms and caps on late fees to mitigate default risk. Cards and bank transfers retain relevance for higher-value goods, but their share steadily declines.BNPL providers harness alternative data for credit scoring, widening coverage beyond formal income earners. Wallet leaders bundle instalment features, loyalty schemes, and micro-investment to defend market share. Cash-on-Delivery remains prevalent in remote islands but will shrink as satellite internet and agent networks extend digital reach.
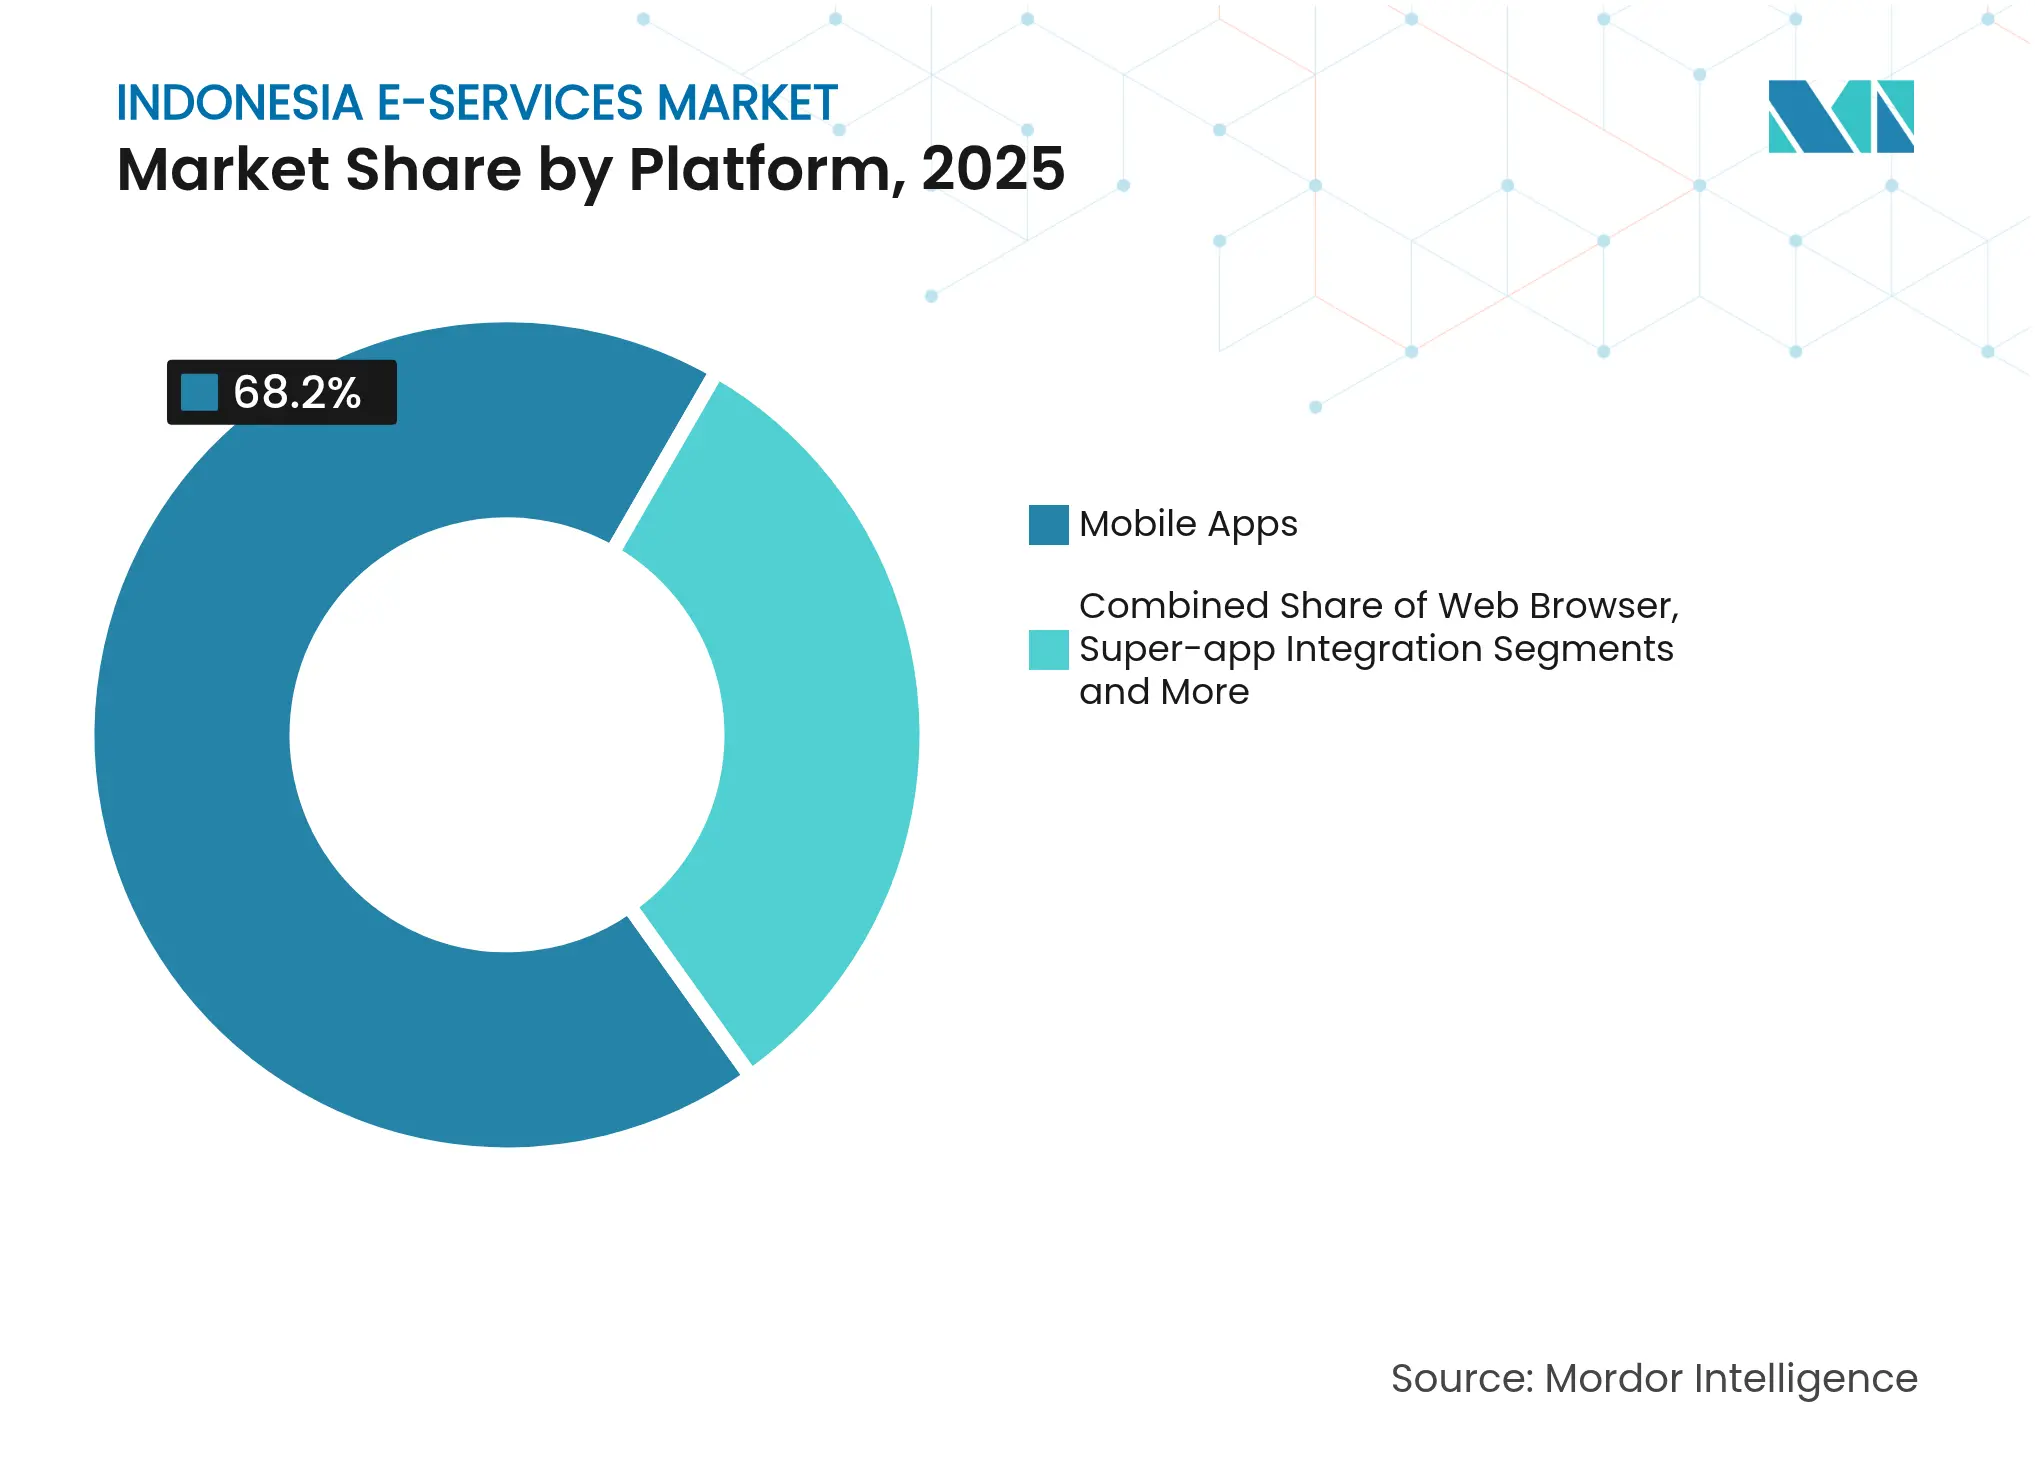
By Platform: Mobile Apps Dominate While Super-Apps Integrate
Mobile Apps accounted for 68.20% platform use in 2025, reflecting the archipelago’s mobile-first culture and limited fixed broadband. Web browsers serve niche corporate tasks, but everyday commerce pivots to apps for speed and interface familiarity. Super-app Integration is projected to expand at 16.25% CAGR as ecosystems bundle commerce, ride-hailing, and payments within single icons. TikTok–Tokopedia and GoTo exemplify the model by stitching discovery and checkout into one funnel.The Indonesia digital services market benefits from lower churn when services interlock. Public-sector super-apps will embed identity verification and benefit disbursement, legitimising the architecture. Cross-super-app interoperability remains limited, prompting debate on open-API mandates.
Note: Segment shares of all individual segments available upon report purchase
By Age Group: Millennials Lead While Gen-Z Drives Growth
Consumers aged 25-34 commanded 37.05% of the Indonesia digital services market in 2025 thanks to higher earnings and urban residency. They favour premium subscriptions for convenience and lifestyle value. Users aged 15-24 will grow at 13.92% CAGR, energised by social commerce, gamified learning, and content sharing. Their global cultural tastes combine with national identity, encouraging hybrid localisation strategies.Service providers adapt UI design, slang, and payment terms for this cohort. The 35-44 bracket shows steady uptake in financial planning apps, while users 45+ trail but gain momentum via peer mentoring and government literacy drives. The Indonesia digital services market thus spans diverse life-stage needs.
Java generated 55.40% of total market revenue in 2025 and is forecast to expand in line with the Indonesia digital services market average through 2031. Jakarta logs the highest Digital Competitiveness Index score at 78.2, helped by dense fibre coverage and smart-city projects. Telkom’s 176,663 km fibre backbone anchors 10.1 million fixed-broadband users, showing how legacy incumbents still shape infrastructure.Sumatra and Kalimantan follow, each benefiting from commodity-driven GDP and transport upgrades. Starlink’s pilot in Nusantara illustrates satellite potential to overcome sparse terrestrial networks. Telkom earmarked Rp280 billion to extend fibre to the new capital, signalling operator commitment outside Java.Sulawesi is the fastest-growing region at 13.62% CAGR. Government academies for digital literacy and entrepreneurship lift competitiveness scores and spur SME platform use. Bali & Nusa Tenggara ride tourism recovery, pushing event ticketing and cashless payments. Maluku & Papua remain frontier markets with scores as low as 17.8, yet Amazon Kuiper’s USD 20 million ground-station plan targets these gaps. Expanded backhaul and subsidised devices may unlock fresh demand across the Indonesia digital services market.
Market Concentration
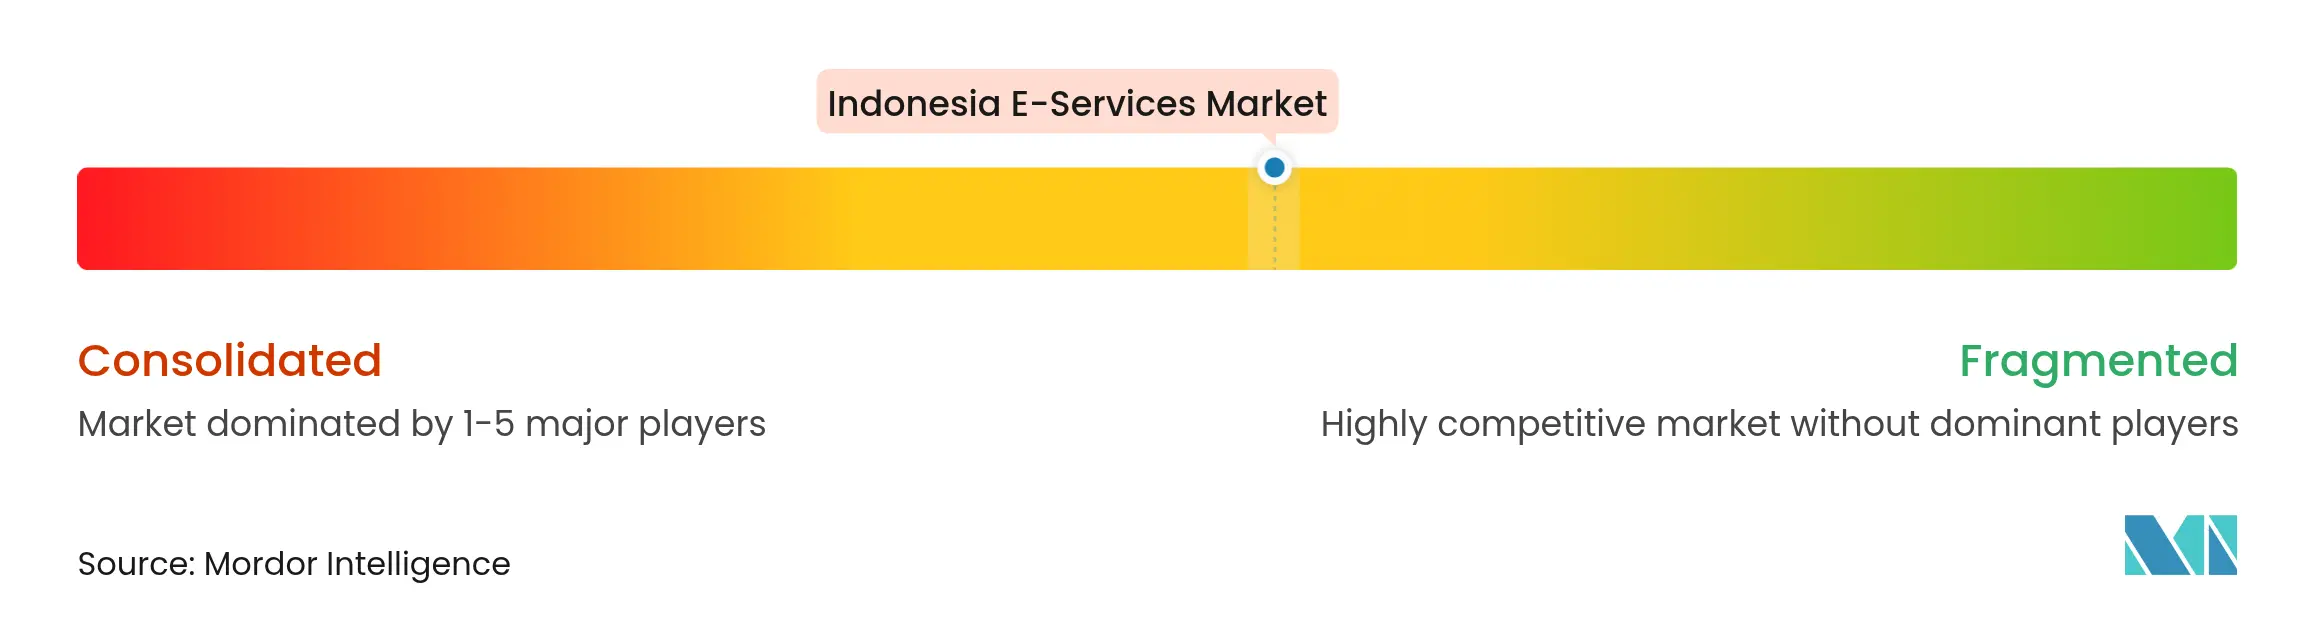
Competition is moderately concentrated. Shopee led e-commerce with 26.5% GMV (~USD 21 billion) in 2024. GoTo posted record GTV of Rp79.2 trillion in Q4 2024 and its first full-year underlying profit, proving the viability of a home-grown super-app. TikTok’s Tokopedia stake realigns the field, merging livestream discovery with established fulfilment.
Indosat and GoTo launched “Sahabat-AI,” a multilingual sovereign AI that handles Bahasa Indonesia and regional dialects, providing differentiated UX and data-sovereignty compliance. BNPL upstarts tap unbanked niches, but regulatory capital rules curb reckless expansion. Foreign hopeful Temu failed to secure an e-commerce licence, underscoring policy gatekeeping that shields domestic champions.
M&A and strategic alliances will continue as firms chase cross-selling gains and regulatory legitimacy. Investments in AI, satellite connectivity, and cybersecurity give incumbents scale-linked moats across the Indonesia digital services market.

*Disclaimer: Major Players sorted in no particular order
1. INTRODUCTION
2. RESEARCH METHODOLOGY
3. EXECUTIVE SUMMARY
4. MARKET LANDSCAPE
5. MARKET SIZE AND GROWTH FORECASTS (VALUE)
6. COMPETITIVE LANDSCAPE
7. MARKET OPPORTUNITIES AND FUTURE OUTLOOK
Market Definitions and Key Coverage
Segmentation Overview
Detailed Research Methodology and Data Validation
Primary Research
Desk Research
Market-Sizing & Forecasting
Data Validation & Update Cycle
Why Our Indonesia E-Services Baseline Earns Decision-Maker Trust
Benchmark comparison
| Market Size | Anonymized source | Primary gap driver | ||
|---|---|---|---|---|
USD 1.99 B (2025) | Mordor Intelligence | - | Anonymized source:Mordor Intelligence | Primary gap driver:- |
USD 1.58 B (2025) | Regional Consultancy A | Counts only licensed operators and omits gray-market app spend | ||
USD 19.3 B (2024) | Global Consultancy B | Blends retail e-commerce, ride-hailing, and streaming with core e-services | ||
USD 53.4 B (2025) | Industry Analytics C | Uses gross merchandise value of physical goods and includes refunds and cash-on-delivery sales |
Pricing Strategy for Semiconductor Components
3 Min Read
Accelerating Additive Manufacturing Adoption in India
3 Min Read
When decisions matter, industry leaders turn to our analysts. Let’s talk.