Indonesia Digital Media Market Size and Share
Market Overview
| Study Period | 2020 - 2031 |
|---|---|
| Forecast Data Period | 2026 - 2031 |
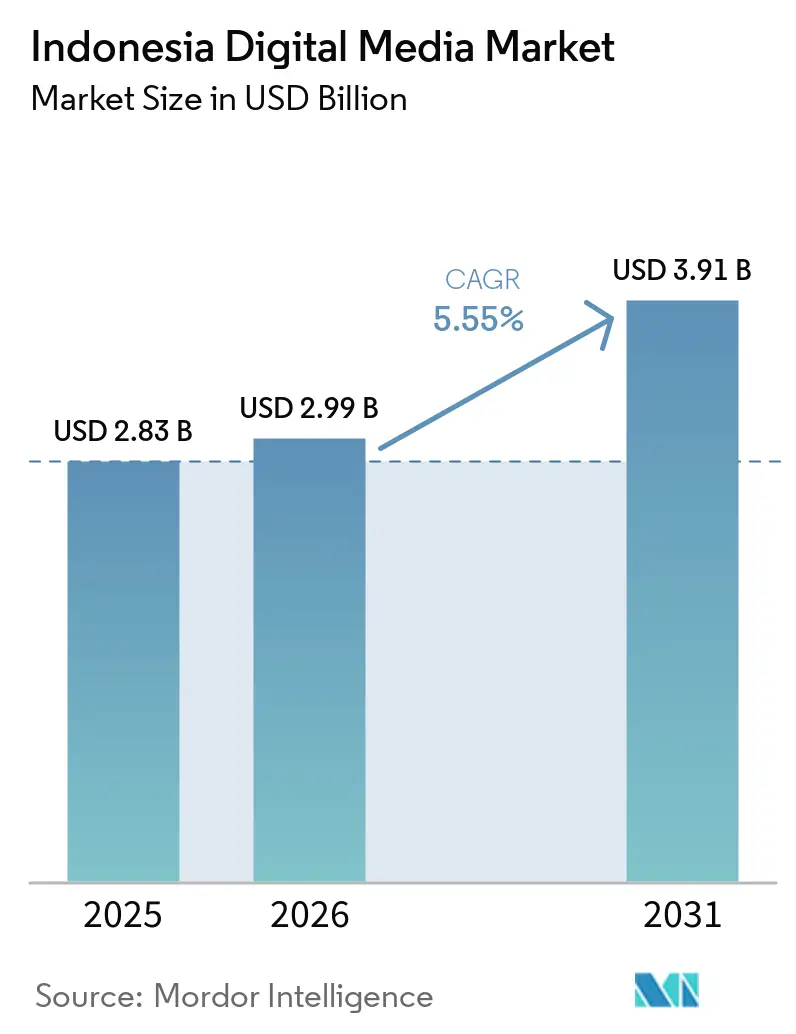
| Base Year Market Size (2025) | USD 2.83 Billion |
| Market Size (2026) | USD 2.99 Billion |
| Market Size (2031) | USD 3.91 Billion |
| Growth Rate (2026 - 2031) | 5.55% CAGR |
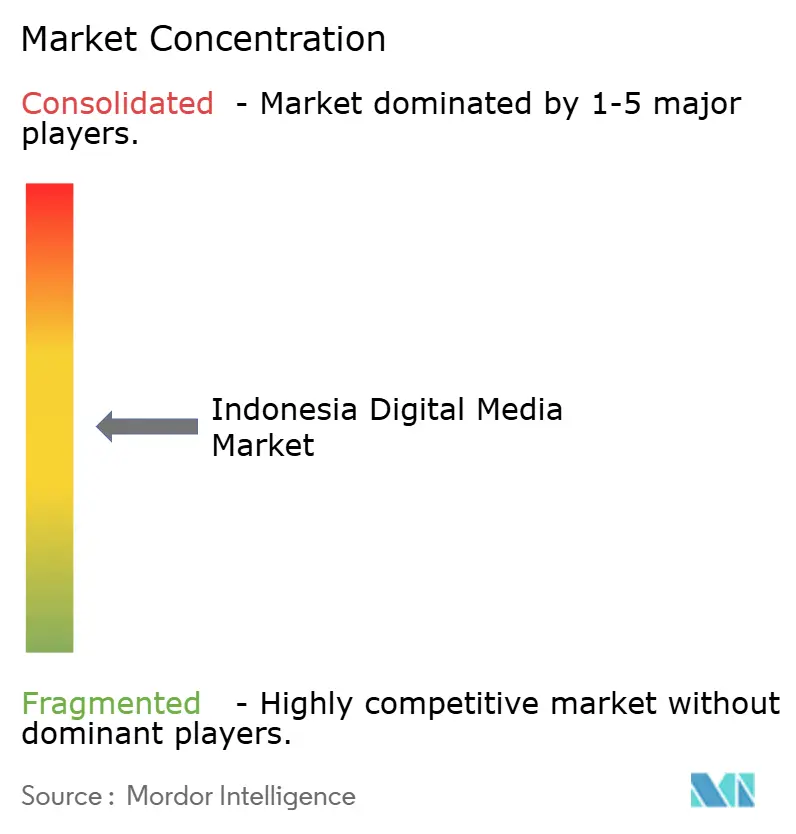
| Market Concentration | Medium |
Major Players
*Disclaimer: Major Players sorted in no particular order Image © Mordor Intelligence. Reuse requires attribution under CC BY 4.0. |
|
Indonesia Digital Media Market Analysis by Mordor Intelligence
The Indonesian digital media market size is expected to grow from USD 2.83 billion in 2025 to USD 2.99 billion in 2026 and is forecast to reach USD 3.91 billion by 2031 at 5.55% CAGR over 2026-2031. This growth reflects Indonesia’s position as Southeast Asia’s largest digital economy, supported by rapid smartphone adoption, improved mobile broadband coverage, and government programs that encourage local content creation.[1]Ministry of Communication and Digital, “Kemkomdigi Bahas Rencana Pembatasan Akun Media Sosial Anak,” indonesia.go.id Platform investment in Bahasa Indonesia productions, the maturation of digital payment ecosystems, and telco partnerships bundling data with content subscriptions further catalyze demand. At the same time, rising compliance costs under the Personal Data Protection Law and persistent digital piracy create operating challenges that are unlikely to derail overall momentum. Intensifying competition between global streamers and local players is spurring innovation in pricing, distribution, and monetization strategies, opening a USD 950 million revenue opportunity through 2030.
Key Report Takeaways
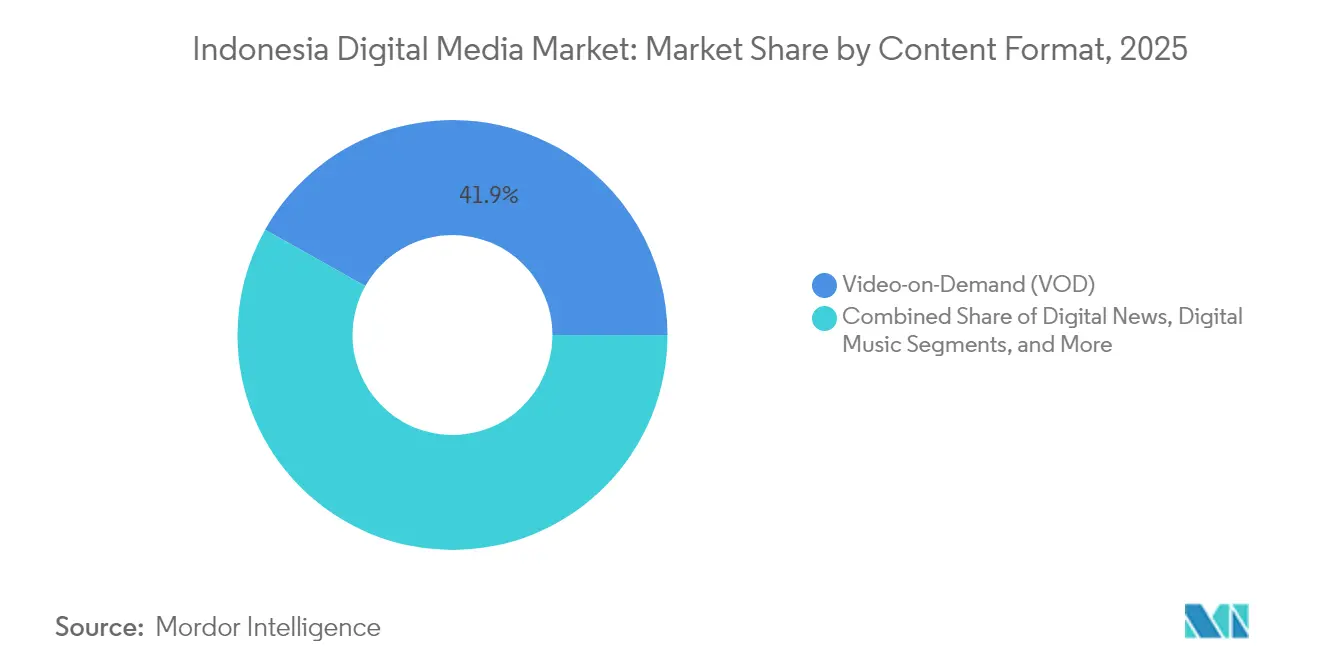
- By content format, Video-on-Demand held 41.85% of the Indonesian digital media market share in 2025, while Podcasts and Audio Books are forecast to grow at a 7.1% CAGR through 2031.
- By revenue model, subscriptions accounted for a 49.05% share of the Indonesian digital media market size in 2025; in-app purchases and micro-transactions are advancing at a 6.95% CAGR through 2031.
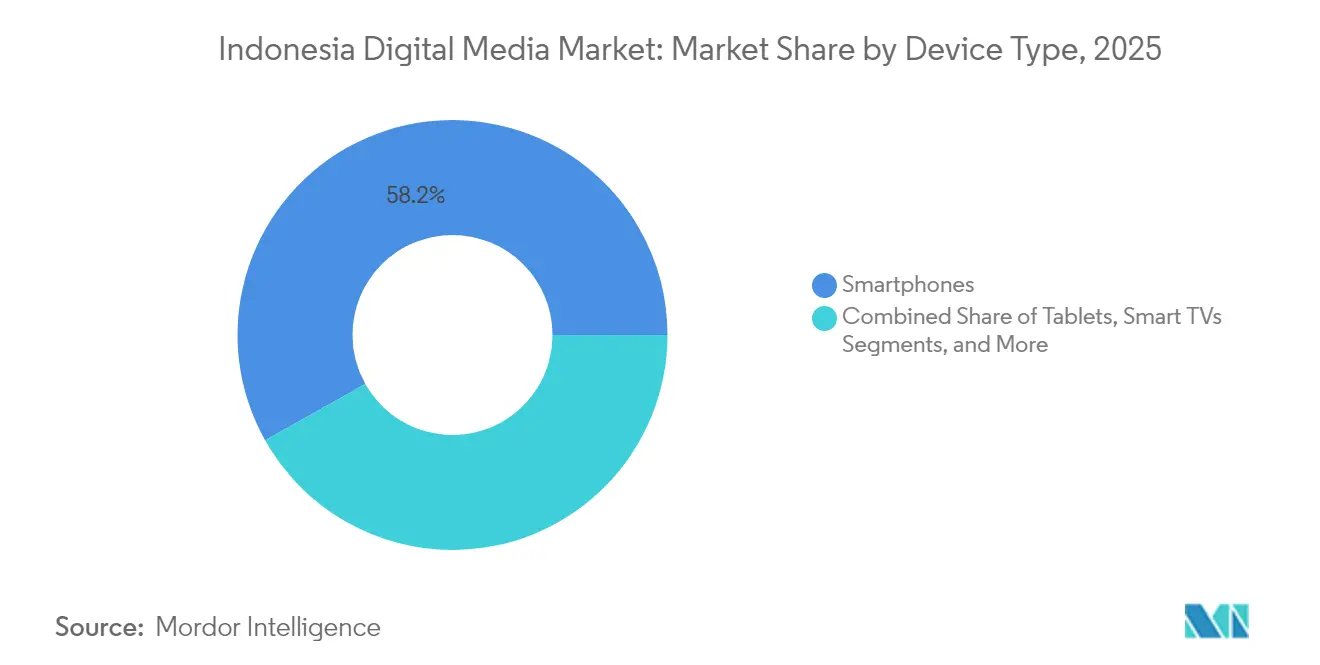
- By device type, smartphones commanded 58.15% of the Indonesian digital media market size in 2025, whereas smart TVs are projected to rise at a 7.22% CAGR to 2031.
- By age group, the 18-34 cohort generated 48.20% of total spending in 2025 of the Indonesian digital media market; the under-18 group is on track to expand at a 6.55% CAGR over the forecast horizon.
- By region, Java contributed 57.25% of Indonesia's digital media market value in 2025, and Bali and Nusa Tenggara are set to grow at a 6.62% CAGR through 2031.
Note: Market size and forecast figures in this report are generated using Mordor Intelligence’s proprietary estimation framework, updated with the latest available data and insights as of 2026.
Worldwide, activity is shaped by contributions from multiple countries and regions, with Indonesia representing one among them. The global report on digital media market by Mordor Intelligence reflects how these countries and regional layers combine into a single system.
Indonesia Digital Media Market Trends and Insights
Drivers Impact Analysis*
| Driver | (~) % Impact on CAGR Forecast | Geographic Relevance | Impact Timeline |
|---|---|---|---|
| Surging mobile broadband penetration and 5G rollout | +1.2% | Java, Bali and Nusa Tenggara, spillover to Sumatra | Medium term (2-4 years) |
| Rapid rise in OTT video subscriptions driven by local content | +1.0% | National, concentration in Java and urban centers | Short term (≤ 2 years) |
| Growing middle-class disposable income and digital spending | +0.8% | Java, Sumatra, emerging in Kalimantan and Sulawesi | Long term (≥ 4 years) |
| Expansion of digital payment ecosystems simplifying micro-transactions | +0.9% | National, led by Java with fast uptake in secondary cities | Medium term (2-4 years) |
| Emergence of telco-bundled data and content packages | +0.7% | National | Short term (≤ 2 years) |
| Government-backed push for local creative economy and IP monetization | +0.6% | National, policy focus on Jakarta and creative hubs | Long term (≥ 4 years) |
| Source: Mordor Intelligence | |||
Surging Mobile Broadband Penetration and 5G Rollout
Indonesia’s 5G build-out accelerates premium content uptake as Telkomsel’s network reached Bali and Nusa Tenggara in 2024, lifting peak data traffic by 26.35%. Smartphone penetration climbed to 76.3%, providing a broad addressable base for high-resolution streaming and cloud gaming. Edge computing and regional CDN nodes are mitigating latency challenges across the archipelago’s 17,000 islands, enabling platforms to deliver consistent viewing experiences even in secondary cities. Device vendors are pre-installing local streaming apps, improving discoverability and reducing user acquisition costs for platforms. These infrastructure and channel advantages underpin continued audience expansion.[2]Telkomsel, “5G Coverage Expansion Update,” telkomsel.com
Rapid Rise in OTT Video Subscriptions Driven by Local Content
Bahasa Indonesia originals now anchor subscriber growth. Netflix secured a 52% share of total viewing time after tripling its local production slate in 2024, while local champion Vidio leveraged Liga 1 soccer and original dramas to narrow the gap in urban youth audiences. Cross-promotion with cinemas and talent-led social campaigns amplify reach, and co-production deals with Korean studios set new quality benchmarks. The resulting virtuous cycle is stimulating investment in studios, postproduction facilities, and screenwriting talent, solidifying Indonesia as a regional content hub.The expansion of Indonesia Digital Software Solutions is enabling media companies to enhance audience targeting, automate content workflows, and improve digital advertising efficiency across platforms.
Growing Middle-Class Disposable Income and Digital Spending
Digital economy output grew 13% year-on-year to USD 90 billion in 2024, buoyed by a median age of 29 and rising household incomes. Subscription video, cloud gaming passes, and audiobook libraries are increasingly considered everyday necessities among middle-income families. Java accounts for a dominant share of this spending, yet payment data show accelerating ticket sizes in Sumatra and Kalimantan, signaling a broadening consumption base that supports long-term market expansion.
Expansion of Digital Payment Ecosystems Simplifying Micro-Transactions
Standardization around QRIS has unified payment acceptance, allowing e-wallets GoPay, OVO, and Dana to interoperate seamlessly. Single-click top-ups inside gaming titles and bite-sized subscription vouchers have reduced checkout abandonment, stimulating 7.2% CAGR growth in micro-transaction revenue. Streaming platforms are experimenting with usage-based charging, such as per-episode pricing for blockbuster series, confident that frictionless payment flows will maximize conversion rates.
Restraints Impact Analysis*
| Restraint | (~) % Impact on CAGR Forecast | Geographic Relevance | Impact Timeline |
|---|---|---|---|
| Escalating privacy and data-protection compliance costs | -0.8% | National, higher on international platforms | Short term (≤ 2 years) |
| Persistent digital piracy and unlicensed content circulation | -1.1% | Urban areas with stronger connectivity | Medium term (2-4 years) |
| Fragmented device infrastructure outside urban centers | -0.6% | Outer islands, rural Sumatra, Kalimantan, Sulawesi | Long term (≥ 4 years) |
| Rising CDN costs for last-mile traffic to outer islands | -0.5% | Maluku, Papua, remote Kalimantan, Sulawesi | Medium term (2-4 years) |
| Source: Mordor Intelligence | |||
Escalating Privacy and Data-Protection Compliance Costs
Full enforceability of the Personal Data Protection Law in January 2025 obliges platforms to localize user data and implement 4-hour takedown windows for critical content. Non-compliance risks fines up to 2% of annual revenue, driving investment in local data centers, AI content filters, and legal teams. Smaller platforms may exit or consolidate, potentially reducing content diversity but strengthening consumer trust in surviving services.[3]Kominfo Newsroom, “Perkuat Perlindungan Masyarakat di Ruang Digital,” infopublik.id
Persistent Digital Piracy and Unlicensed Content Circulation
Roughly 63% of Indonesian viewers still access pirated streams, dampening returns on high-budget originals. Although regulators blocked 1,000 illicit sites in 2024, mirror domains reappear within days. Platforms counter with aggressive pricing, password-sharing crackdowns, and live sport exclusives whose time sensitivity deters piracy. Over time, heightened IP awareness campaigns and faster legal remedies could narrow piracy’s appeal.[4]PS Engage, “Building a Safer Digital World for Kids,” ps-engage.com
*Our forecasts treat driver/restraint impacts as directional, not additive. The impact forecasts reflect baseline growth, mix effects, and variable interactions.
Segment Analysis
By Content Format: VOD Dominance Amid Audio Renaissance
Video-on-Demand generated 41.85% of Indonesia's digital media market revenue in 2025, driven by aggressive local production pipelines and tiered pricing that matches diverse budgets. Netflix widened its Indonesian catalog by 35% year on year, while Vidio premiered nine original series in early 2025 that captured prime-time social chatter. The segment’s scale enables platforms to negotiate bulk bandwidth rates, lowering delivery costs per stream. At the same time, premium sports rights safeguard churn-sensitive months, stabilizing recurring cash flows.
Podcasts and audiobooks are scaling quickly as commuting Indonesians turn to motivational and comedy shows, propelling a 7.1% CAGR. Advertisers appreciate the captive attention window of 1 hour-plus daily, enabling dynamic ad insertion at CPMs 22% higher than display banners. Local studios specializing in Bahasa Indonesia audiobooks report 80% repeat purchase rates, indicating the format’s stickiness among Gen Z and millennial listeners. The shift also unlocks ancillary revenue from live events and merchandise linked to hit audio franchises, underscoring audio’s evolving strategic importance within the Indonesian digital media market.


By Revenue Model: Subscription Stability Meets Gaming Innovation
With a 49.05% share in 2025, subscriptions remain the bedrock of predictable cash flow, especially for VOD and music services. Family plans and ad-supported tiers broaden the funnel while minimizing cannibalization. Direct carrier billing, present on 93% of mobile plans, shortens conversion paths and pushes average revenue per user upward. Robust subscriber data further refines personalization engines, lifting engagement metrics that advertisers value.
In-app purchases constitute the fastest-rising revenue stream at 6.95% CAGR as mobile gaming reaches a projected 192.1 million players in 2025. Game publishers experiment with limited-time loot crates, season passes, and virtual concerts, creating additional spending moments. QRIS adoption ensures that even users without credit cards can transact instantly, sustaining the Indonesian digital media market’s micro-transaction flywheel. Successful platforms, therefore, blend stable subscription bases with high-velocity transactional layers to optimize lifetime value.
By Device Type: Mobile Supremacy Challenged by Smart TV Growth
Smartphones accounted for 58.15% of total usage in 2025, reflecting cost-effective Android handsets and data-inclusive plans. Handheld gameplay and vertical-video formats dominate screen time, influencing content aspect ratios and user-interface design. However, rising living standards boost smart-TV penetration, which is growing at a 7.22% CAGR. Streaming apps pre-installed on new TV models create a lean-back family experience that advertisers find attractive for brand storytelling. Integrated remote-control QR codes now enable viewers to complete in-stream purchases without leaving the sofa, signaling future commerce potential.
PCs and laptops retain relevance for long-form esports viewing and high-fidelity MMO gaming, while gaming consoles benefit from expanding esports leagues that broadcast national tournaments on mainstream channels. Wearables and vehicle infotainment systems form a nascent “other” category that could capture niche niches such as fitness video, yet current bandwidth constraints limit scale.
By Age Group: Youth Demographics Drive Future Growth
Adults aged 18-34 generated 48.20% of revenue in 2025, valuing ad-free experiences and exclusive premieres enough to pay monthly fees. Their social influence amplifies word-of-mouth acquisition, which accounts for 37% of new sign-ups according to platform data. Disposable income growth in this cohort supports upselling to higher-price tiers bundled with cloud storage or e-learning access.
Consumers under 18 are expanding at a 6.55% CAGR, propelled by earlier access to hand-me-down smartphones and school digitalization. forthcoming parental-supervision rules, modeled on German law, require guardian consent for users under 16, nudging platforms to roll out kid-safe modes and standalone junior apps. Age-appropriate gaming titles like Mobile Legends Junior are in development, ensuring future monetization pathways while maintaining compliance.
Geography Analysis
Java continues to anchor the Indonesian digital media market with a 57.25% share, leveraging its economic heft, 83.64% connectivity, and Jakarta’s established production ecosystem. Leading platforms base engineering hubs in the capital, ensuring rapid iteration of app features that localize global best practices. Advertisers funnel more than half of national digital budgets into the island, attracted by sophisticated audience targeting and proven conversion metrics. Content houses cluster near studio facilities in West Jakarta, creating economies of scale in talent and post-production resources.
Sumatra and Kalimantan offer significant upside. Each boasts over 77% internet penetration, and rising household incomes from agribusiness and mining translate into steady subscription uptakes. Telco discount packages that include Vision+ or Vidio are resonating with first-time streamers in Palembang and Balikpapan. Local governments sponsor esports tournaments, stimulating gamer communities and local ad spend. Sulawesi’s 68.35% penetration signals room for infrastructure-led catch-up. Telco tower build-outs planned for 2026-2027 should narrow the gap, making the region attractive for early-mover content licenses.
Bali and Nusa Tenggara grow fastest at a 6.62% CAGR. Telkomsel’s 5G deployment supports 4K streaming in tourist hotspots, and villa landlords promote high-speed Wi-Fi as a booking differentiator. Influencer-led travel vlogs and location-based AR filters encourage user-generated content tied to local landmarks, boosting regional visibility. Maluku and Papua remain frontier territories. Satellite internet pilots by Telkom Indonesia demonstrate potential, but high data costs and sparse power grids prolong monetization timelines. Platforms experiment with lightweight codecs to serve these regions without compromising viewing quality, preparing the ground for future expansion.
Competitive Landscape
Competition is intensifying yet remains moderately fragmented. Netflix captured 42% of subscription revenue in 2024 on the back of aggressive localization. Vidio narrowed the gap through exclusive Premier League rights, fueling spikes in weekend concurrent streams that sometimes exceeded 1 million viewers. Vision+ focuses on freemium news and local reality shows, maintaining a foothold among ad-tolerant audiences. Disney+ capitalizes on Marvel and Star Wars fandoms, while Amazon Prime appeals to cross-border shoppers by bundling free delivery benefits.
Gaming exhibits a similar split. Garena’s Free Fire led downloads with Indonesia contributing 17.8% of December 2024 installs, but local studio Moonton anchors Mobile Legends Professional League, which secures lucrative sponsorships from telcos and FMCG brands. Cloud gaming entrants leverage 5G low latency to offer console-quality play on mid-range phones, challenging traditional hardware models.
Telcos act as kingmakers. Telkomsel partners with Netflix, Disney+, Crunchyroll, and local streamers, exchanging bandwidth guarantees for wholesale discounts that expand bundle margins. XL Axiata-Smartfren’s post-merger scale lifts negotiating power, allowing deeper content subsidies to attract prepaid users. Regulatory compliance capabilities provide a competitive moat as the Personal Data Protection Law raises operational thresholds. Smaller players seek niches in faith-based content or ultra-local news, relying on community influencers to secure engagement.
Indonesia Digital Media Industry Leaders
-
PT Vidio Dot Com
-
Netflix Pte. Ltd.
-
Spotify AB
-
PT Tencent Technology Indonesia
-
Amazon Digital UK Limited
- *Disclaimer: Major Players sorted in no particular order

Recent Industry Developments
- August 2025: Vidio partnered with Shopee to enable interactive shopping directly from streaming interfaces, integrating e-commerce with entertainment.
- April 2025: Vidio secured Premier League broadcast rights extension through 2028, reinforcing its sports portfolio.
- March 2025: The Ministry of Communication and Digital issued new technical standards for public electronic systems, expanding compliance requirements.
- February 2025: SAMAN content-moderation system launched, mandating 4-hour takedown of urgent content, with fines up to 2% of annual revenue for non-compliance.
- January 2025: Personal Data Protection Law reached full enforceability, compelling platforms to overhaul data-governance frameworks.
- January 2025: Garena’s Free Fire led global downloads at 35.2 million in December 2024, with Indonesia contributing 17.8%.


Indonesia Digital Media Market Report Scope
Digital media is a communication media that operates with various encoded machine-readable data formats. Digital media blends technology and content and requires teams of professionals with diverse skills, including technical, artistic, analytical, and production coordination skills. Digital media products such as an app on a smartphone, a game on a video game console, and an ultrasound imaging device in a hospital enable and deliver experiences across various end-use verticals.
The Indonesian digital media market is segmented by type (digital music, e-publishing, digital video games, and video-on-demand) and Geography (Java, Sumatra, Kalimantan, and other regions). The market sizes and forecasts are provided in terms of value (USD) for all the above segments.
| Digital Music |
| E-Publishing |
| Digital Video Games |
| Video-on-Demand (VOD) |
| Digital News |
| Podcasts and Audio Books |
| Subscription |
| Advertising-Supported |
| Pay-Per-View/Transactional |
| In-App Purchases and Micro-transactions |
| Hybrid/Bundled |
| Smartphones |
| Tablets |
| PCs/Laptops |
| Smart TVs |
| Gaming Consoles |
| Others (STBs, Wearables) |
| < 18 Years |
| 18 – 34 Years |
| 35 – 54 Years |
| ≥ 55 Years |
| Java |
| Sumatra |
| Kalimantan |
| Sulawesi |
| Bali and Nusa Tenggara |
| Maluku and Papua |
| By Content Format | Digital Music |
| E-Publishing | |
| Digital Video Games | |
| Video-on-Demand (VOD) | |
| Digital News | |
| Podcasts and Audio Books | |
| By Revenue Model | Subscription |
| Advertising-Supported | |
| Pay-Per-View/Transactional | |
| In-App Purchases and Micro-transactions | |
| Hybrid/Bundled | |
| By Device Type | Smartphones |
| Tablets | |
| PCs/Laptops | |
| Smart TVs | |
| Gaming Consoles | |
| Others (STBs, Wearables) | |
| By Age Group | < 18 Years |
| 18 – 34 Years | |
| 35 – 54 Years | |
| ≥ 55 Years | |
| By Region | Java |
| Sumatra | |
| Kalimantan | |
| Sulawesi | |
| Bali and Nusa Tenggara | |
| Maluku and Papua |


Key Questions Answered in the Report
How large is the Indonesia digital media market in 2026?
The Indonesia digital media market size reached USD 2.99 billion in 2026 and is forecast to hit USD 3.91 billion by 2031.
Which content format generates the most revenue?
Video-on-Demand leads with 41.85% share in 2025, reflecting strong audience preference for on-demand viewing.
What is the fastest-growing revenue model?
In-app purchases and micro-transactions are expanding at a 6.95% CAGR, driven mainly by mobile gaming.
Why is Java so dominant?
Java benefits from 83.64% internet penetration, higher incomes, and Jakarta-based content production hubs, giving it 57.25% of national revenue.
How will the Personal Data Protection Law affect platforms?
Full compliance is mandatory from January 2025, and non-compliant services risk fines up to 2% of annual revenue, prompting investment in local data governance.
Which device category is gaining momentum besides smartphones?
Smart TVs are growing at a 7.22% CAGR as urban households adopt connected-TV viewing for premium content.
Page last updated on:


