
India Foundry Market Size and Share
Market Overview
| Study Period | 2020 - 2031 |
|---|---|
| Forecast Data Period | 2026 - 2031 |
| Base Year Market Size (2025) | USD 26.28 Billion |
| Market Size (2026) | USD 28.72 Billion |
| Market Size (2031) | USD 46.72 Billion |
| Growth Rate (2026 - 2031) | 10.22 % |
| Market Concentration | Medium |
Major Players *Disclaimer: Major Players sorted in no particular order Image © Mordor Intelligence. Reuse requires attribution under CC BY 4.0. | |
India Foundry Market Analysis by Mordor Intelligence
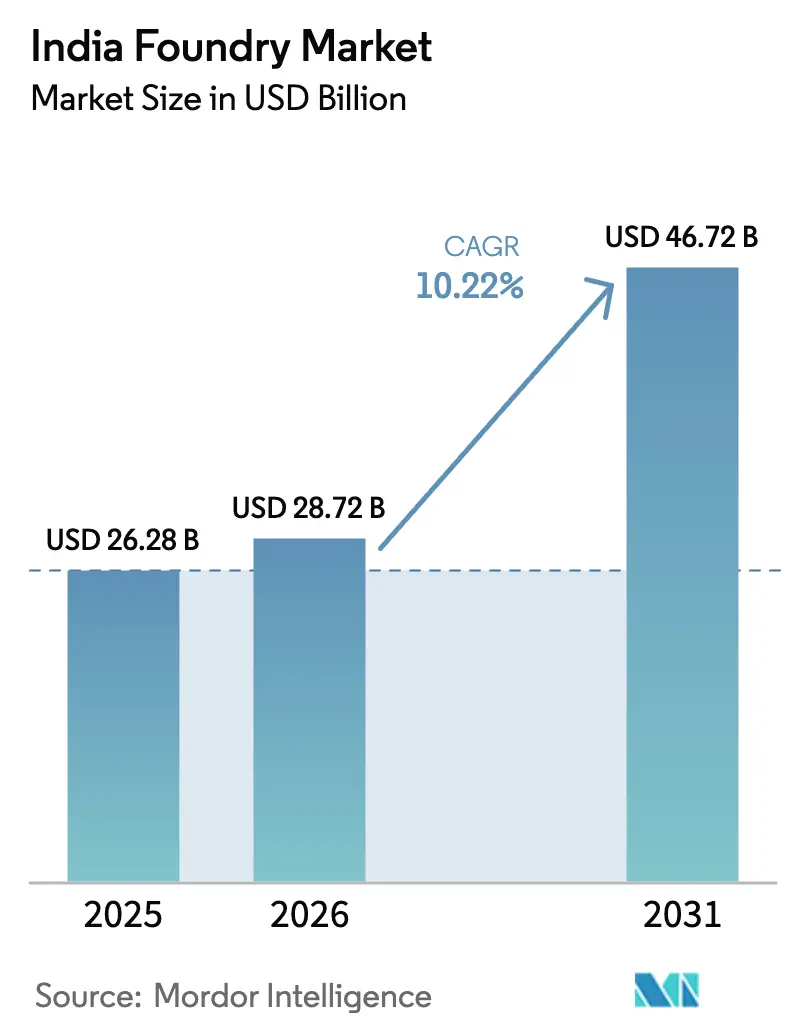
The India Foundry Market size is projected to be USD 26.28 billion in 2025, USD 28.72 billion in 2026, and reach USD 46.72 billion by 2031, growing at a CAGR of 10.22% from 2026 to 2031.
Supported by import-substitution duties, electric-vehicle (EV) localization, and public-works spending, the India foundry market has moved from spot contracting toward long-term programs that reward metallurgical consistency and lower embedded carbon. Aluminum high-pressure die-casting (HPDC) lines are running close to capacity as domestic EV production passed 1 million units in fiscal 2026, while the Vehicle Scrappage Policy is unlocking low-cost scrap that trims melt costs by 12–18%. Safeguard duties of 40% on Chinese iron castings have redirected orders to domestic shops and compressed lead times, and green-hydrogen subsidies are nudging early adopters to convert coke-fired cupolas to low-carbon furnaces. Together, these levers have allowed most Tier 1 suppliers to maintain pricing power even as scrap and energy prices remain volatile.
Key Report Takeaways
- By casting type, sand casting accounted for 58.82% of the India foundry market share in 2025, whereas investment casting is projected to expand at a 12.05% CAGR through 2031.
- By material, ferrous alloys held 84% of the India foundry market size in 2025, but non-ferrous alloys are set to grow at an 11.54% CAGR to 2031.
- By end-user, automotive applications contributed 31.88% of 2025 revenue, while aerospace components will post the fastest 12.06% CAGR through 2031.
- By geography, West India led with 35.11% of 2025 revenue, whereas South India is on track for a 10.74% CAGR through 2031.
Note: Market size and forecast figures in this report are generated using Mordor Intelligence’s proprietary estimation framework, updated with the latest available data and insights as of January 2026.
Market Trends and Insights
Drivers Impact Analysis of India Foundry Market*
| Drivers | (~) % IMPACT ON CAGR FORECAST | Geographic Relevance | Impact Timeline |
|---|---|---|---|
| Domestic EV output passing 1 million units in FY-26 boosts aluminum HPDC demand | +1.8% | West & South India | Medium term (2–4 years) |
| 40% duty on Chinese iron castings accelerates import substitution | +1.5% | National | Short term (≤ 2 years) |
| Vehicle Scrappage Policy delivers cheaper ferrous and non-ferrous scrap | +1.2% | National | Short term (≤ 2 years) |
| Global OEM Scope-3 mandates drive EAF/induction investment | +1.0% | National | Medium term (2–4 years) |
| Green-hydrogen subsidies support furnace conversion in select clusters | +0.8% | West, South & East India | Long term (≥ 4 years) |
| ONDC B2B metals marketplace cuts raw-material costs for SMEs | +0.5% | National | Medium term (2–4 years) |
| Source: Mordor Intelligence | |||
Domestic EV Output Passing 1 Million Units in FY-26 Boosts Aluminum HPDC Demand
EV power-train localization is diverting HPDC lines from engine ancillaries to battery enclosures, motor housings, and structural frames that demand tighter tolerances and higher thermal conductivity. Hindalco’s USD 59 million Chakan plant shipped 10,000 battery enclosures to Mahindra Electric by December 2024 and is scaling to 160,000 units a year by FY-2027. Uno Minda is commissioning a USD 25 million HPDC facility in Maharashtra with 3,629 t annual capacity aimed at Tata’s Nexon EV and Mahindra’s XUV400 platforms. India’s production-linked incentive for advanced-chemistry cells compels 60% domestic value-addition by 2027, further anchoring HPDC orders in Pune, Chakan, and Hosur clusters. Although flame-retardant coatings add 8–12% processing cost, they unlock premium contracts with Ola Electric and Ather Energy, lifting average selling prices on enclosure castings.
40% Duty on Chinese Iron Castings Accelerates Import Substitution
A 40% basic customs duty, effective January 2025, has slashed ordering cycles from 90–120 days to 30–45 days. Mahindra & Mahindra and Tata Motors have shifted 12,000 t of housing from China to Kirloskar Ferrous and Electrosteel. Bharat Forge’s Baramati EV-component plant uses AI mold-fill tools to keep rejections below 1%, enabling same-week deliveries. Construction-equipment OEMs, buoyed by a future production incentive, are localizing hydraulic-cylinder barrels and boom castings. Unless plants reach Chinese productivity by the duty’s scheduled 2028 expiry, import risk will resurface, but digital-twin roll-outs under the SAMARTH Udyog Bharat 4.0 program are closing the gap.
Vehicle Scrappage Policy Delivers Cheaper Ferrous and Non-Ferrous Scrap
The Vehicle Scrappage Policy had 84 scrapping facilities processing 96,980 vehicles by July 2024[1]. Scrap flows are lifting the scrap ratio in induction furnaces to as high as 70%, slicing pig-iron purchases and trimming energy intensity. Tata Steel and JSW Steel plants now run dedicated scrap-sorting lines, offering foundries cleaner feed that reduces gray-iron costs by USD 40–60 per t. The policy’s fitness-certificate mandate could retire 1.2 million vehicles a year by 2028, generating 2.8 million t of ferrous scrap enough to cover 15–20% of national melt requirements. Margins widen as melt costs fall, letting foundries underbid imports without eroding profitability.
Green-Hydrogen Subsidies Support Furnace Conversion in Select Clusters
The National Green Hydrogen Mission budgets USD 2.35 billion to 2030 for direct-reduced iron and hydrogen furnaces[2]. Kolhapur’s cupola-heavy basin is piloting hydrogen-oxy burners that can slash particulate emissions by 85% and sulfur dioxide to near zero. Tata Steel is testing a 5 MW electrolyzer feeding a 50 t-per-day DRI module, with learnings aimed at its captive foundry. Conversion economics hinge on hydrogen prices falling from today’s USD 4.5 per kg to the mission’s USD 1.2 per kg target, but early adopters could comply with the European Carbon Border Adjustment Mechanism (CBAM) well ahead of peers.
Restraints Impact Analysis of India Foundry Market*
| Restraints | (~) % IMPACT ON CAGR FORECAST | Geographic Relevance | Impact Timeline |
|---|---|---|---|
| EU CBAM raises landed cost of high-carbon castings | -1.4% | Export-oriented clusters | Short term (≤ 2 years) |
| Petcoke and high-sulfur coal import curbs inflate melt-fuel costs | -0.9% | West, East & Central India | Short term (≤ 2 years) |
| Semiconductor-fab hiring drains metallurgical engineers | -0.6% | West & South India | Medium term (2–4 years) |
| Shift to glass-reinforced plastics in micro-mobility reduces small-part demand | -0.4% | West & South India | Medium term (2–4 years) |
| Source: Mordor Intelligence | |||
EU CBAM Raises Landed Cost of High-Carbon Castings
The CBAM applies a 38.8% levy on castings above 1.5 t CO₂ per t from January 2026. Kolhapur’s exporters, emitting 1.8–2.2 t CO₂ per t, face immediate margin compression. Larger players absorb compliance costs, yet 70% of shops are MSMEs with limited capital. At least 8–12 micro-foundries have shut each quarter since mid-2025, accelerating consolidation as buyers shift to CBAM-compliant suppliers.
Import Curbs on Petcoke and High-Sulfur Coal Inflate Melt-Fuel Costs
India slashed the January–June 2025 coke import quota to 1.43 million t and cut the sulfur cap to 1.5%, driving delivered prices from about USD 360 per t to nearly USD 480 per t. Melt-fuel bills for coke-fired cupolas rose roughly 25%, squeezing margins by 4–6 points and forcing a dozen Kolhapur micro-foundries to shut. Without cheaper energy alternatives, the next quota cut slated for 2027 could trigger wider closures.
*Our forecasts treat driver/restraint impacts as directional, not additive. The impact forecasts reflect baseline growth, mix effects, and variable interactions.
India Foundry Market Segment Analysis
By Casting Type:
Investment Casting Lifts Precision OutputInvestment casting captured 600 t of aerospace-grade capacity in 2025 and is set for a 12.05% CAGR, outperforming every other route in the India foundry market. Sand casting, however, remained the largest at 58.82% of 2025 volume. HAL’s USD 21.4 billion order book for 201 Tejas Mk 2 jets is driving turbine-blade contracts for PTC Industries, Dynamatic Technologies, and Aequs.[3] Investment-cast superalloys such as Inconel 718 deliver 950–1,200 MPa tensile strength and can tolerate 1,050 °C gas-path temperatures, attributes that are impossible via sand molds. Although tools and waxing stages inflate part costs to USD 10 per kg, OEMs accept premiums for tight tolerance and fatigue life.
Sand casting still underpins the India foundry market size for automotive cylinder blocks, railway couplers, and pump housings. Kolhapur and Pune alone ship about 600,000 t of sand-cast iron parts annually. Die casting, led by Uno Minda’s upcoming Maharashtra unit, is pivoting to EV motor housings and battery frames at cycle times of 45 seconds. Permanent-mold, evaporative-pattern, and centrifugal casting form a small share, serving pistons, crankshafts, and ductile-iron pipes. Even with investment casting’s fast growth, sand casting will likely keep more than half of India's foundry market share through 2031 because large diesel engines and rail bogies will stay iron-intensive.


By Material:
Non-Ferrous Alloys Gain TractionFerrous grades held 84% of 2025 revenue, but aluminum, zinc, and copper castings will log an 11.54% CAGR to 2031 on EV lightweighting mandates. Hindalco’s HPDC line achieved a 40% battery-enclosure weight cut versus steel, improving range by 15 km. Pune’s aluminum cluster, which accounts for more than 20% of national non-ferrous output, benefits from pipeline natural gas and ONDC sourcing that shave 5–7% off ingot costs. Despite growth, non-ferrous alloys still track London Metal Exchange swings; at USD 2,600 per t, aluminum costs roughly quadruple pig iron, squeezing margins when contracts lack metal pass-through clauses.
Gray and ductile irons keep leadership on cost-sensitive, high-fatigue parts such as railway couplers and wind-turbine hubs. Nelcast’s Chennai expansion added 60,000 t a year and uses 100% renewable power, achieving 0.8 t CO₂ per t, well below the CBAM threshold. As EV penetration rises, aluminum and magnesium usage per vehicle will climb, yet iron content in heavy-machinery frames, couplers, and brake discs will remain sticky, ensuring ferrous dominance in India's foundry market share for at least the next five years.
By End-User:
Aerospace Outpaces Automotive GrowthAutomotive uses still generated 31.88% of 2025 demand, but content per car is falling as internal-combustion engines give way to simpler EV drivetrains. By contrast, aerospace castings, now under 10% of shipments, will post a 12.06% CAGR as HAL ramps Tejas jets from 16 to 24 units a year and Air India’s 470-aircraft order feeds aftermarket blade replacements. Precision-cast nickel alloys carry double-digit margins and longer contracts, insulating suppliers such as PTC Industries from auto-cycle volatility.
Construction equipment, railways, pumps, and electrical components together account for the remainder. Hydraulic-cylinder barrels for excavators, railway bogie frames for Vande Bharat trainsets, and ductile-iron pump housings for water grids maintain steady tonnage. These bulkier parts favor sand or static molds, reinforcing ferrous tonnage even as premium investment-cast alloys take value share.

Geography Analysis
West India retained 35.11% of 2025 revenue as Kolhapur’s 275 iron foundries and Pune’s 50-unit aluminum cluster together poured over 1 million t. Proximity to Tata Motors, Mahindra & Mahindra, and Bajaj Auto keeps shipping distances short, while state subsidies on natural gas curb melt costs for non-ferrous shops. Bharat Forge’s USD 47 million Chakan forging-casting campus and Mahindra CIE’s USD 59 million Igatpuri die-casting plant will add almost 60,000 t of aluminum capacity by 2027, lifting the region’s share of non-ferrous tonnage toward 46%.
South India is the fastest-growing region at a projected 10.74% CAGR through 2031 thanks to aerospace and wind-energy work in Tamil Nadu and Karnataka. Nelcast’s 60,000 t ductile-iron facility in Chennai, powered entirely by renewables, already meets CBAM limits and feeds Vestas and Siemens Gamesa hubs. Sundaram Clayton’s 18,000 t die-casting expansion and Brakes India’s 12,000 t brake-caliper line deepen automotive supply to Hyundai and Renault-Nissan export programs. Coimbatore’s investment-casting shops link directly into HAL’s turbine-blade supply chain, securing multi-year orders that smooth cyclicality.
North, East & North-East, and Central India trail in share but leverage captive steel-plant foundries and railway demand. Tata Steel’s Jamshedpur and JSW Steel’s Dolvi sites pour large crankcases and couplers for Indian Railways and Bharat Heavy Electricals. The USD 2.27 billion Delhi–Panipat RRTS corridor and metro works in Kolkata and Guwahati are pulling ductile-iron pipe and brake-disc orders eastward, while coal-rich Raipur–Bhilai maintains a cost advantage on feedstock for construction-equipment castings.
Regulatory Landscape
CBAM phase-in begins October 2025, with carbon levies applied from January 2026 to high-carbon castings. This changes export pricing and supplier qualification requirements, while also pushing foundries to shift toward lower-carbon melting and power mixes. Exporters are responding through documentation of carbon footprints and cleaner-input sourcing as part of market-access considerations.
A 40 percent basic customs duty on Chinese iron castings took effect in January 2025, which accelerated import substitution and redirected order flows toward domestic foundries. In March 2026, the Maharashtra rooftop-solar rules update introduces grid charges and tighter time-of-day banking, which affects energy-cost planning for energy-intensive melting routes. The SIDHIEE program and the Foundry Informatics Centre by the Institute of Indian Foundrymen (IIF) continue to support energy-efficiency and technology adoption across clusters, alongside broader policy signals from industry bodies.
Value Chain Analysis
The Indian foundry value chain starts with upstream inputs such as ferrous and non-ferrous scrap, pig iron, alloys, and consumables like sand, binders, and refractories. Melting then takes place through cupola, induction, and other electric routes, followed by molding and core-making, pouring, fettling, and in-process quality control.
On the downstream side, machining, heat treatment, and non-destructive testing (NDT) labs support OEM qualification for automotive, railways, and aerospace programs. Foundry clusters in Kolhapur, Pune, Coimbatore, Chennai, and Jamshedpur function as organizing nodes for shared vendors, technical know-how, and job-work networks.
Competitive Landscape
Roughly 5,000 units compete nationwide, but the top 20 groups control 35–40% of revenue, giving the India foundry market a moderate concentration. Integrated players are co-locating forging, machining, and casting on single campuses to shorten lead times. Bharat Forge operates 716,500 t of capacity across five countries, including 77,700 t of iron casting via JS Auto Cast, and uses AI vision to cap defects below 1%. Mahindra CIE’s Phase I Igatpuri facility introduced digital twins that cut cycle time to 45 seconds, winning aluminum motor-housing orders from European EV platforms.
The second cohort, including Endurance Technologies, Sundaram Clayton, and Nelcast, specializes in high-pressure die casting or ductile-iron hubs. Their edge lies in renewable power procurement and first-mover CBAM compliance. Nelcast’s Chennai plant, for example, runs on 100% wind and solar, earning preferred-supplier status through 2028 for Suzlon and Vestas. Such decarbonization narratives are now essential for export quotes, and several MSMEs face exclusion for lacking ISO 14067 footprints.
Technology adoption remains the key strategic variable. IoT sensors, machine-learning defect prediction, and blockchain carbon ledgers cost upward of USD 0.5 million per line, a sum prohibitive for MSMEs. The ONDC metals marketplace offers one lever of relief by lowering raw material prices, but most micro shops still struggle to fund automation. As duties phase out and CBAM ramps up, consolidation is expected to accelerate, with the largest groups eyeing tuck-in acquisitions in Pune, Kolhapur, and Coimbatore clusters.
India Foundry Industry Leaders
-
A-Cast Foundry
-
Aditya Birla Management Corp.
-
Brakes India
-
Larsen & Toubro
-
JSW Steel
- *Disclaimer: Major Players sorted in no particular order

India Foundry Market Companies Covered in this Report
- A-Cast Foundry
- Aditya Birla Management Corp.
- Brakes India
- Larsen & Toubro
- JSW Steel
- CALMET
- Ashok Iron Works
- Gujarat Metal Cast Industries
- Electrosteel Castings
- Menon & Menon
- Kirloskar Ferrous Industries
- Tata Steel (Foundry Division)
- Mahindra CIE Automotive
- Sundaram Clayton
- Endurance Technologies
- Nelcast
- DCM Engineering
- Bharat Forge (Casting Ops)
- Hinduja Foundries
- Tata AutoComp Systems
Market Opportunities and Future Outlook
The industry is moving away from high-volume, low-cost commodity castings toward higher-value, more complex components for aerospace, nuclear, and electric vehicle end markets. Organized foundries are increasingly bundling downstream services such as machining, sub-assembly, and finishing, and the organized sector share is projected to exceed 50 percent by FY30. Domestic EV localization and capacity expansions in HPDC also support higher value aluminum parts, with Hindalco’s Chakan plant and Uno Minda’s Maharashtra facility adding capacity for aluminum components. The production-linked incentive program for advanced-chemistry cells anchors 60 percent domestic value-addition by 2027.
Digitalization under Industry 4.0, including digital twins and ERP-MES integration, is increasingly used to align with global OEM supply-chain requirements. Infrastructure growth in railways, defense, and renewable energy adds a longer-cycle demand base for cast components, while CBAM-related cost pressures reinforce the shift toward cleaner melt and power mixes. Policy measures including the Vehicle Scrappage Policy and ONDC-based procurement workflows help tighten input quality and improve supplier coordination across clusters.
Recent Industry Developments in India Foundry Market
- June 2026: Acast Foundry exhibited steel casting capabilities at CastForge 2026 in Stuttgart, showcasing advanced casting capabilities and global outreach for Indian foundries. The launch signals modernization efforts and potential for premium orders from global OEMs, tied to in-house machining and sub-assembly needs.
- January 2025: Bharat Forge opened a USD 47 million aluminum forging plant in Chakan, Maharashtra with 36,000 t capacity, powered by renewables. Strengthens domestic aluminum forging capacity and EV/low-emission supply chain readiness, while expanding capacity for higher-value aluminum components and improving supplier localization.
- October 2024: JSW Steel commissioned a USD 574 million pellet plant in Odisha, adding 12 million t to in-house feedstock. This improves raw-material self-sufficiency for foundry-related production and reduces dependence on external supply for iron and steel casting inputs.
India Foundry Market Report Scope and Research Methodology
Market Definition and Coverage
For this report, the market is defined as the value of foundry casting output produced and sold in India, covering ferrous and non-ferrous cast components supplied to end-use industries.
Scope exclusions: This estimate excludes downstream machining-only services, pure fabrication, and equipment sales for furnaces, molding lines, and tooling.
Segments Covered in This Report
- By Casting Type
- Sand Casting
- Die Casting
- Investment Casting
- Other Types - Permanent-Mold Casting, Evaporative casting, High-Pressure Die Casting, and Centrifugal
- By Material
- Ferrous
- Non-Ferrous
- By End-User
- Automotive
- Aerospace
- Construction
- Machinery
- Railways
- Power Generation
- Pumps & Valves
- Electrical Components
- Others - General Engineering, etc.
- By Geography
- North India
- West India
- South India
- East & North-East India
- Central India
Data Sources, Market Sizing, and Validation
Desk Research
Desk research was used to set the boundary for what gets counted as foundry output in India and to build the first set of size drivers. Public sources such as the Ministry of Steel and Ministry of Commerce and Industry releases, DGFT and customs trade statistics, and BIS standards were referenced to understand material flows, casting grades, and compliance trends.
We also reviewed sources such as industry association publications (for foundry and automotive component ecosystems), annual reports and investor presentations, peer reviewed metallurgical journals, and reputed press coverage on capacity additions and plant utilization. For cross-checks on company scale and operational footprint, paid subscriptions that cover company financials and intelligence, patent databases, and shipment-level import-export records were selectively used. This list is illustrative, and many other public and paid sources were also reviewed to collect data, validate assumptions, and clarify open questions.
Primary Interviews and Surveys
Primary discussions were done with foundry operators, suppliers of inputs, quality and process leaders, and buying teams from key end users such as automotive, industrial machinery, and infrastructure-linked customers. Input from different Indian manufacturing clusters was used to confirm utilization, yield loss assumptions, pass-through behavior for scrap and alloy costs, and the pace at which new capacity becomes commercial.
The inputs were then used to close gaps left by public data, and to test whether the modeled casting value aligns with real ordering patterns and sourcing shifts across end markets.
Distribution of primary research fieldwork respondents
| Company type | Respondent position |
|---|---|
| Top tier: 33% | CXOs: 18% |
| Mid tier: 49% | Functional/Unit leaders: 40% |
| Smaller Players: 18% | Managers: 42% |
Market-Sizing & Forecasting
The core model uses a top-down approach where India casting demand is reconstructed from end-use output trends and metal consumption signals, and then converted into value using realistic selling price bands by material and casting route. To keep the totals grounded, results are checked against selective bottom-up approximations such as a sampled capacity roll up in major clusters, channel checks on order books, and volume times average selling price estimates for common part families.
Key inputs that shaped the model include crude steel and alloy availability signals, non-ferrous input cost cycles, automotive production and export momentum, infrastructure capex direction, and typical utilization ranges observed across jobbing and captive foundries. The forecast was built using scenario analysis around end-market growth and price pass-through behavior, followed by smoothing to avoid unrealistic jumps when raw material prices swing. Where company level numbers were not available, missing blocks were handled through cluster-level capacity shares and normalized utilization assumptions, which were then reviewed during primary calls before finalizing.
Data Validation & Update Cycle
Outputs were validated through multiple checks, starting with whether the implied casting value per ton stays within practical ranges when compared with known metal and energy cost movements. We also compared the model against independent signals like trade direction for cast articles, reported capacity expansion announcements, and end-user output cycles, and then investigated any large variances before sign-off.
A multi-step internal review was completed, where assumptions, math, and units were rechecked and then reconciled with interview notes for consistency. Reports are refreshed annually, and interim updates are made when major events materially change demand, pricing, or capacity. Before delivery, an analyst performs a fresh pass so clients receive the latest updated view.
Mordor Intelligence's India Foundry Market Sizing Compared With Other Published Estimates
Published market sizes for India foundries can look far apart even when they discuss similar customers, because the counting rules are often not the same. The most common differences come from what is included as foundry value, how pricing is handled during metal cost swings, and whether captive casting that is transferred internally is counted.
By tracking utilization and part-mix shifts, refreshing input-cost pass-through assumptions, and then validating scope boundaries through cluster interviews, Mordor Intelligence keeps the size tied to casting output value in India rather than adjacent metalworking revenue that can inflate totals.
Benchmark comparison
| Source | Market Size | Gaps in Research Methodology |
|---|---|---|
| Mordor Intelligence | USD 26.28 B (2025) | |
| Industry Association A | USD 23.90 B (2025) | Often emphasizes member-reported production and may undercount non-member and captive output, and it can use simpler price conversion methods that lag rapid alloy and scrap price changes. |
| Trade Journal B | USD 31.50 B (2026) | May bundle casting with related machining and fabrication revenue, and it can apply broad inflation uplifts instead of separating material route mix and realized selling price differences across end uses. |
The spread in the table mainly comes from boundary choices and price logic, not from a single demand driver. When scope is kept tight to casting output and pricing is tested against utilization and end-market cycles, the result becomes easier to trace, repeat, and explain in a procurement or investment decision.
Key Questions Answered in the Report
How large is the India foundry market in 2026?
The market reached USD 28.72 billion in 2026 and is projected to grow at a 10.22% CAGR to USD 46.72 billion by 2031.
Which casting route holds the biggest share today?
Sand casting retained 58.82% of 2025 production, mainly supplying automotive engines and railway couplers.
What is driving aluminum casting demand?
Localization of electric-vehicle battery enclosures and motor housings, plus import duties on Chinese castings, are lifting aluminum HPDC orders.
Which region is growing the fastest?
South India is expected to post a 10.74% CAGR, supported by aerospace precision casting and wind-energy hubs.
How will CBAM affect exporters?
Castings above 1.5 t CO? per t incur a 38.8% levy from 2026, pressuring coke-fired cupola shops to shift to electric or hydrogen routes.
What technology investments are most common?
Foundries are adopting AI mold-fill simulation, IoT defect detection, and blockchain carbon tracking to meet global OEM Scope-3 targets.