India Manufacturing Market Size and Share
Market Overview
| Study Period | 2020 - 2031 |
|---|---|
| Forecast Data Period | 2026 - 2031 |
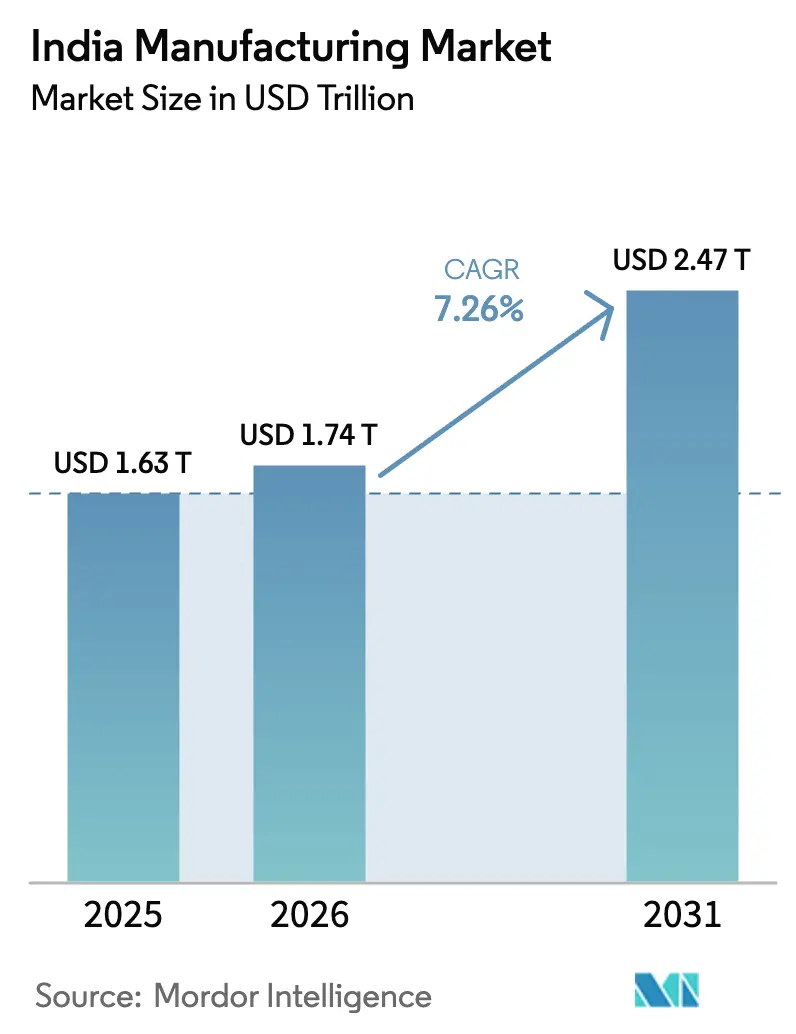
| Base Year Market Size (2025) | USD 1.63 Trillion |
| Market Size (2026) | USD 1.74 Trillion |
| Market Size (2031) | USD 2.47 Trillion |
| Growth Rate (2026 - 2031) | 7.26% CAGR |
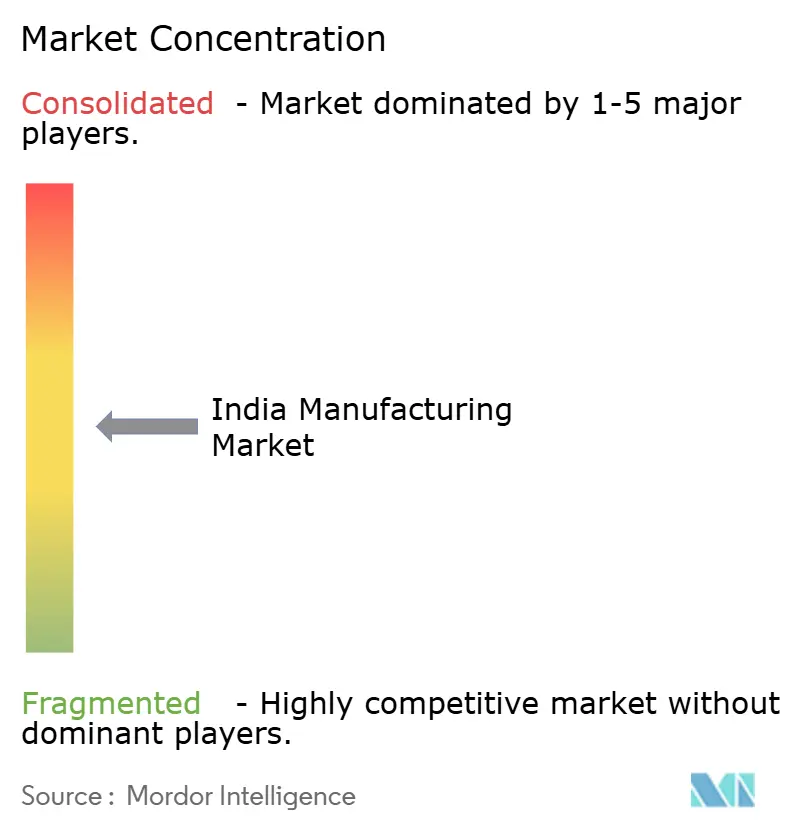
| Market Concentration | Medium |
Major Players*Disclaimer: Major Players sorted in no particular order Image © Mordor Intelligence. Reuse requires attribution under CC BY 4.0. | |
India Manufacturing Market Analysis by Mordor Intelligence
The India Manufacturing Market size is projected to be USD 1.63 trillion in 2025, USD 1.74 trillion in 2026, and reach USD 2.47 trillion by 2031, growing at a CAGR of 7.26% from 2026 to 2031.
Production-linked-incentive (PLI) 2.0 programs worth USD 26 billion, a USD 22 billion FDI wave tied to “China + 1” realignment, and rapid MSME formalization are widening the domestic supplier base while tilting output toward electronics, batteries, and green hydrogen[1]Press Information Bureau, “PLI 2.0 Scheme Allocation Exceeds USD 26 Billion,” pib.gov.in. Digital-credit platforms now shorten working-capital cycles from 90 days to fewer than 45 days for tier-2 suppliers, boosting liquidity during order spikes. West India still anchors one-third of production, yet South India is the fastest-growing region as aerospace, EV, and semiconductor clusters mature. Meanwhile, additive manufacturing is taking root in defense applications after Bharat Forge cut turbine-blade lead times by 75% using metal 3D printing.
Key Report Takeaways
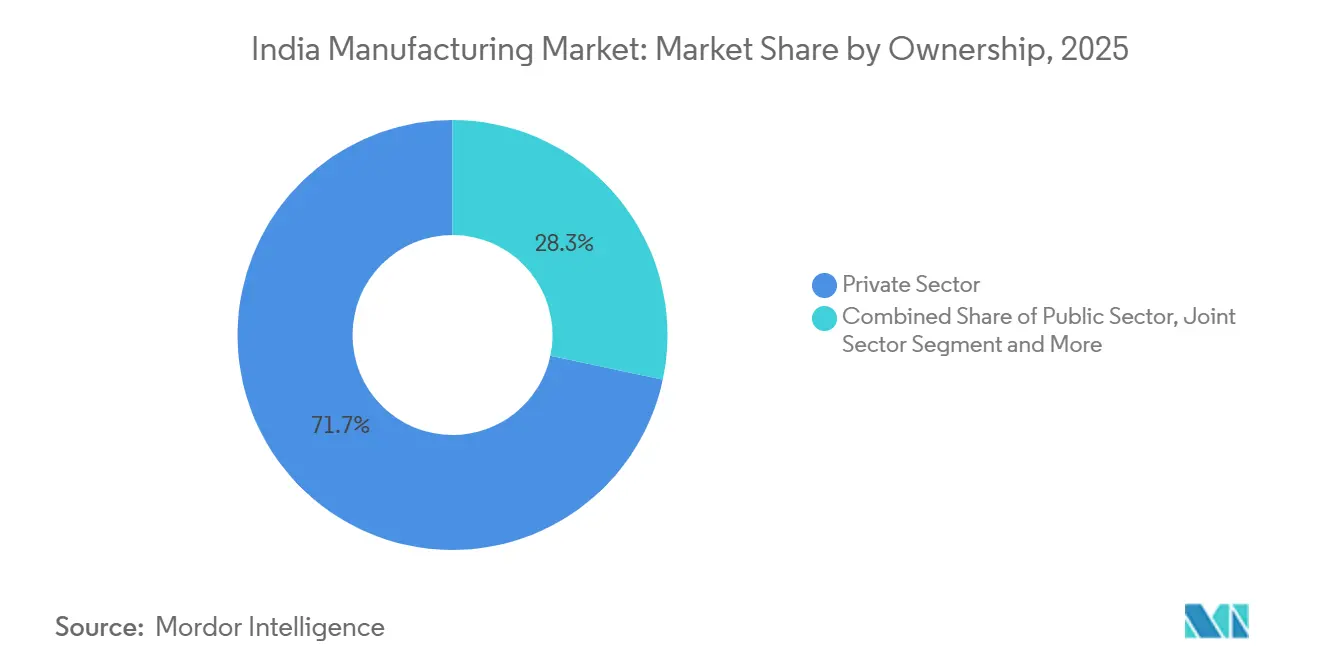
- By ownership, private enterprises controlled 71.68% of output in 2025, while private MSMEs are projected to grow at a 10.04% CAGR to 2031.
- By end-user industry, automotive captured 23.12% of demand in 2025, whereas electronics and electricals are advancing at a 13.46% CAGR to 2031.
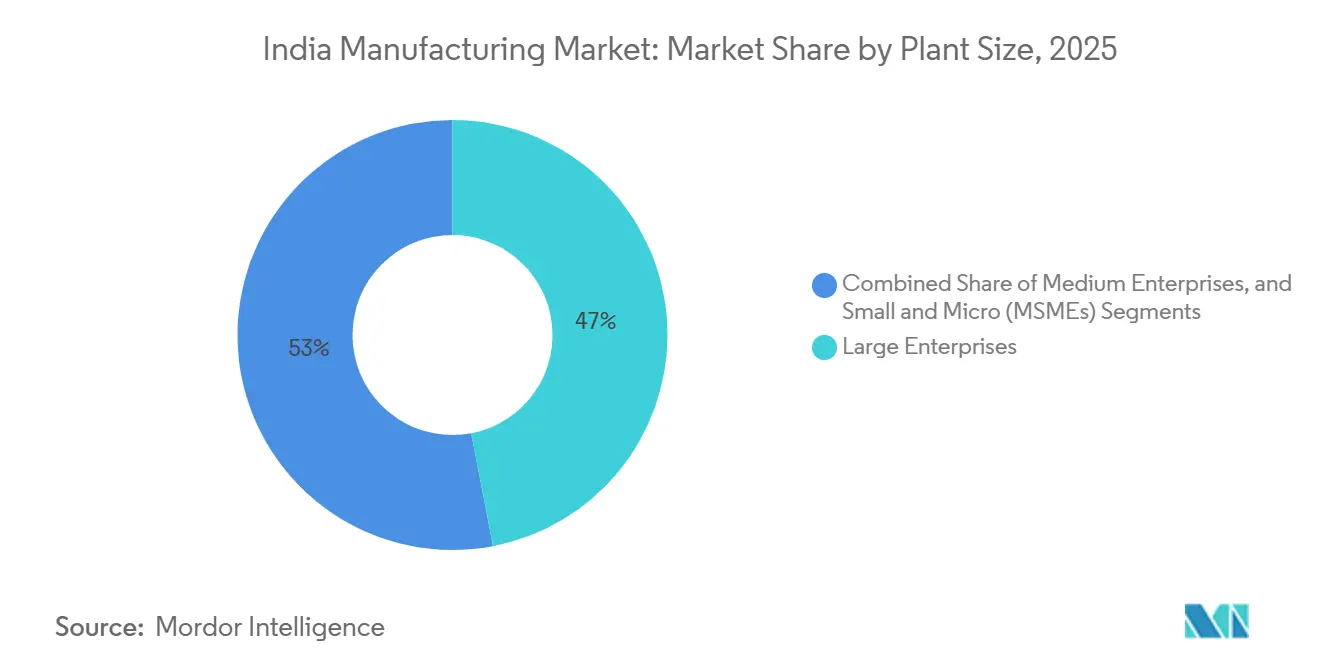
- By plant size, large enterprises generated 46.98% of 2025 output, but micro and small enterprises will expand the fastest at 12.94% CAGR to 2031.
- By Geography, West India commanded a 33.06% share in 2025, while South India is expected to grow at a 7.72% CAGR through 2031.
Note: Market size and forecast figures in this report are generated using Mordor Intelligence’s proprietary estimation framework, updated with the latest available data and insights as of January 2026.
India Manufacturing Market Trends and Insights
Drivers Impact Analysis*
| Drivers | (~) % Impact on CAGR Forecast | Geographic Relevance | Impact Timeline |
|---|---|---|---|
| Expanded PLI 2.0 incentives for green hydrogen, advanced batteries, and semiconductors | +1.8% | Gujarat, Karnataka, Tamil Nadu | Medium term (2–4 years) |
| Quad “China + 1” supply-chain realignment | +1.5% | Maharashtra, Gujarat, Tamil Nadu, Karnataka | Short term (≤2 years) |
| Consumption surge in tier-2/3 cities and warehouse build-out | +1.2% | Nationwide, early gains in Coimbatore, Indore, Lucknow | Medium term (2–4 years) |
| Gati Shakti industrial-corridor connectivity | +0.9% | DMIC, CBIC, other corridors | Long term (≥4 years) |
| Defense-procurement offset obligations | +0.7% | Hyderabad, Bengaluru, Pune | Medium term (2–4 years) |
| Mandatory ESG disclosure accelerating Industry 4.0 retrofits | +0.6% | Large enterprises nationwide | Short term (≤2 years) |
| Source: Mordor Intelligence | |||
Expanded PLI 2.0 Incentives Covering Green Hydrogen, Advanced Chemistry Batteries & Semiconductors
PLI 2.0 has lined up USD 26 billion for sunrise sectors and ties 50% of subsidies to incremental sales, so recipients must close long-term offtake deals before ground-breaking. Three wafer fabs targeted for Gujarat and Karnataka will lift monthly capacity to 85,000 wafers by 2027, while battery incentives backed plans for 50 GWh of cells by 2028[2]Ministry of Electronics & IT, “Semiconductor Mission Update 2025,” meity.gov.in . Hydrogen awards cover 1.2 million t/y of electrolyzers and have already drawn USD 4 billion of private spending pledges. Staggered payouts (20% upfront, 80% performance-linked) lower fiscal risk, yet smaller firms face liquidity gaps during ramp-up. Overall, the scheme locks in a multi-year domestic-demand floor that will ripple across component supply chains.
Quad Supply-Chain Realignment (“China + 1”) Funnelling OEM Orders to India
FDI in manufacturing climbed to USD 22 billion in 2025, 34% above the previous year, as Apple and Samsung deepened India assembly footprints. The Quad supply-chain-resilience initiative earmarks USD 5 billion of concessional credit, tilting orders for mid-tier electronics and auto parts toward Indian vendors[3]U.S. Department of State, “Quad Supply Chain Resilience Initiative,” state.gov . Foxconn and Pegatron now employ 87,000 workers, while Samsung moved 30% of global washer output to Noida. Yet imported displays and sensors mean only 38% of handset value is locally added, indicating scope for deeper backward integration.
Domestic Consumption Surge from Tier-2/3 Urbanization and E-Commerce Warehousing Growth
Tier-2 and tier-3 cities drove 42% of incremental consumer-goods demand in 2025 as per-capita income crossed USD 2,800. Logistics players responded by commissioning 28 million ft² of warehouses, trimming last-mile times below 24 hours for 78% of tier-2 pin codes. Godrej’s new Mohali refrigerator plant is aimed squarely at this hinterland demand. Rising disposable income, therefore, anchors a steady domestic-demand floor that cushions exporters from global swings.
Fast-Track Industrial-Corridor Connectivity via Gati Shakti Projects
Gati Shakti has deployed USD 18 billion to link 11 corridors and 35 logistics parks, cutting Delhi-Mumbai transit from 48 hours to 18 hours on dedicated freight lines. The Chennai-Bengaluru corridor reduced logistics costs by 14% for auto suppliers, allowing inventory days to halve. However, only 22% of parks have rail sidings, and port dwell times at 2.8 days still lag Singapore’s 0.8 days. Effective last-mile infra, therefore, decides how quickly India converts connectivity capex into competitiveness gains.
Restraints Impact Analysis*
| Restraints | (~) % Impact on CAGR Forecast | Geographic Relevance | Impact Timeline |
|---|---|---|---|
| Logistics bottlenecks: port dwell times and rail share below 30% | −0.8% | Nationwide, acute at Kolkata & Haldia | Medium term (2–4 years) |
| Land-acquisition delays extend project schedules | −0.6% | Uttar Pradesh, Odisha, West Bengal | Long term (≥4 years) |
| Volatile copper & lithium prices are compressing margins | −0.5% | Battery and electronics hubs nationwide | Short term (≤2 years) |
| Shortage of semiconductor-fab and clean-room talent | −0.4% | Gujarat, Karnataka | Medium term (2–4 years) |
| Source: Mordor Intelligence | |||
Persistent Logistics Bottlenecks: Port Dwell Times & Hinterland Rail Share less than 30%
Average port dwell fell to 2.8 days in 2025, yet remains double Colombo’s and triple Singapore’s, hiking inventory costs for exporters. Jawaharlal Nehru Port saw seven-day queues in monsoon peaks, pushing electronics shippers to costly air freight. Rail’s cargo share languishes at 27.3% because only one-fifth of parks have sidings, while rake turnaround is 5.2 days versus China’s 2.8 days. Completion of the Eastern Freight Corridor slipped 18 months due to land disputes, delaying anticipated 30% freight-cost cuts. Unless last-mile links keep pace with trunk corridors, India’s logistics penalty will persist.
Land-Acquisition Delays Despite State Reforms, Prolonging Project Lead Times
Greenfield plants in Uttar Pradesh and Odisha overran schedules by 18-24 months in 2024-25 despite single-window portals. JSW’s USD 3.2 billion Odisha mill stalled as tribal petitions block 42% of land, while Tata Electronics lost 14 months waiting for 600 acres in Assam. States with digitized land banks, such as Gujarat and Karnataka, drew 64% of new FDI, underlining that fast land transfer is now a primary site-selection filter.
*Our forecasts treat driver/restraint impacts as directional, not additive. The impact forecasts reflect baseline growth, mix effects, and variable interactions.
Segment Analysis
By Ownership: Private Dynamism Anchors Expansion
Private firms commanded a 71.68% India manufacturing market share in 2025, while private MSMEs will outpace the broader market at 10.04% CAGR through 2031. Digital invoice discounting and PLI subsidies let Dixon Technologies lift revenue to USD 2.04 billion by onboarding 14 global brands. Public-sector units, burdened by legacy pensions, saw Bharat Heavy Electricals’ new orders dip 11% in FY 2025. Joint-sector and cooperative ventures together held barely 10% but face restricted capital access. The India manufacturing market, therefore, leans on agile private players for growth while state enterprises stabilize heavy-industry baselines.
Regulatory liberalization, including automatic 100% FDI and licensing abolition for most categories, has entrenched private dominance. The India manufacturing market size generated by Dixon, Ather, and similar firms keeps broadening as localized sourcing climbs. Cooperatives struggle under controlled cane pricing, amassing USD 2.64 billion in farmer arrears that crimp tech upgrades. Looking ahead, MSMEs will exploit digital credit and GST compliance histories to win OEM mandates, cementing a two-tier structure of nimble suppliers feeding scale integrators.


By End-User Industry: Electronics Leads, Automotive Recalibrates
Automotive accounted for 23.12% of 2025 demand, but electronics and electricals will rise fastest at 13.46% CAGR through 2031 as mobile-phone output hits 330 million units. The Mobile-Manufacturing PLI paid USD 384 million in FY 2025, lifting local value addition to 35% and attracting 42 component makers. Textiles held a 14.6% share yet face Bangladeshi and Vietnamese labor-cost advantages. Pharmaceuticals, at 9.8%, shipped USD 24.6 billion of APIs after 18 plants cleared the FDA in 2025.
Dairy processors added 8 million l/d of capacity as protein intake climbs, and cement dispatches rose 7% on housing programs. Specialty-chemical exports gained 12% after China’s environmental closures, while defense manufacturing logged the highest 14.8% CAGR from artillery and aircraft assemblies. The India manufacturing industry must therefore juggle demand surges in electronics and defense with competition risks in textiles and footwear.
By Plant Size: Micro & Small Enterprises Accelerate
Large enterprises held 46.98% of 2025 revenue, yet micro and small firms will expand at 12.94% CAGR as the Emergency-Credit-Line Guarantee Scheme disbursed USD 61.2 billion. Udyam registered 1.8 million new MSMEs in FY 2025 after e-registration cut processing to two hours. Medium enterprises at 28.4% share are growing 8.6% CAGR, helped by auto-supplier quality certifications.
Micro shops benefit from RAMP program subsidies that lifted productivity 14% in pilot states. Still, 38% of small units face payment delays of over 90 days, spurring a mandate for electronic discounting on all public procurement. The India manufacturing market thus relies on policy scaffolding to scale its long tail of micro producers while ensuring liquidity discipline across supply chains.

Geography Analysis
West India controlled 33.06% of the 2025 manufacturing value as Gujarat’s Dholera region drew USD 8.5 billion of semiconductor and renewable-energy projects, and Maharashtra’s Pune-Aurangabad EV corridor absorbed USD 1.44 billion of auto capex. Mundra and other ports handled 42% of container exports and cut Delhi transit to 18 hours on a dedicated freight spine. Rising land costs of USD 960,000 per acre in Pune are nudging mid-caps toward Nashik and Aurangabad.
South India is the fastest-growing region at a 7.72% CAGR to 2031, buoyed by Karnataka’s aerospace hub and Tamil Nadu’s electronics FDI of USD 6.2 billion in FY 2025. Foxconn and Pegatron together employ 32,000 workers, while Telangana supplies 40% of bulk-drug exports. Andhra Pradesh’s dual corridors, backed by stamp-duty waivers and power subsidies, secured USD 2.8 billion across steel and food plants.
North India held a 22.4% share but grapples with four-hour-a-month power cuts and rising wages after migrant departures. Haryana’s auto belt output hit 2.8 million cars in FY 2025, yet Uttar Pradesh’s defense projects lag on land hold-ups. East and North-East India together constituted 11.6% of output; Odisha is rich in steel and aluminum but lacks downstream fabrication, and Kolkata port’s 3.6-day dwell undermines export competitiveness. Incentive schemes in the North-East attract food and bamboo processing, yet limited rail links cap scale.
Competitive Landscape
Competition is moderate: the top five conglomerates account for 28% of organized-sector revenue, leaving ample headroom for mid-tier disruptors. Reliance pursues vertical integration from oil to chemicals and now hydrogen, while Tata balances steel, electronics, and aerospace. Dixon’s asset-light contract model tripled revenue to USD 2.04 billion without brand ownership, showing how the India manufacturing market rewards specialized EMS scale.
Strategic moves in 2025-26 spotlight green pivots. Reliance commissioned a 100 MW electrolyzer line, Tata Electronics opened a USD 1.8 billion Assam backend-fab, and Mahindra teamed with Volkswagen on a USD 600 million EV platform. JSW Steel expanded to 28 million t/y through a USD 2.4 billion buy-out, reflecting a capacity race among steel majors.
Technology leadership separates winners: Tata Steel’s AI furnaces and Bharat Forge’s 3D printing shaved costs and cycle time, whereas smaller mills incur 18% higher power bills. Intellectual-property gaps persist: the top 50 firms filed 1,840 patents versus 320 by MSMEs. New BIS quality-control orders raised compliance costs for importers, indirectly tilting demand toward domestic producers already aligned with Indian Standards.
India Manufacturing Industry Leaders
Reliance Industries Ltd
Tata Motors Ltd
Mahindra & Mahindra Ltd
Maruti Suzuki India Ltd
Tata Steel Ltd
- *Disclaimer: Major Players sorted in no particular order

Recent Industry Developments
- January 2026: Reliance commissioned a 100 MW green-hydrogen plant in Jamnagar, targeting 1 million t/y production by 2028.
- November 2025: Tata Electronics opened a USD 1.8 billion semiconductor assembly site in Assam with a 10 million chips per month capacity.
- September 2025: Bharat Forge won a USD 450 million defense barrel contract using metal 3D printing.
- August 2025: Mahindra formed a USD 600 million EV JV with Volkswagen for a 5 GWh battery line.
- July 2025: JSW Steel bought Bhushan Power & Steel’s 3.5 Mt plant for USD 2.4 billion, lifting total capacity to 28 Mt.


India Manufacturing Market Report Scope
Manufacturing is a secondary industry that involves processing raw materials to produce finished goods. It is the production of goods in large quantities after processing the raw materials into more valuable products.
The manufacturing market in India is segmented by ownership (public sector, private sector, joint sector, and cooperative sector), raw materials used (agro-based industries and mineral-based industries), and end-user industry (automotive, manufacturing, textile and apparel, consumer electronics, construction, food and beverages, and other end-user industries). The report offers market sizes and forecasts in value terms (USD) for all the above segments.
| Public Sector |
| Private Sector |
| Joint Sector |
| Cooperative Sector |
| Automotive & Auto Components |
| Textile & Apparel |
| Electronics & Electricals |
| Food & Beverages |
| Pharmaceuticals & Healthcare |
| Construction Materials |
| Chemicals |
| Aerospace & Defence |
| Metals |
| Machinery and Capital Goods |
| Others (Furniture, etc.) |
| Large Enterprises |
| Medium Enterprises |
| Small & Micro (MSMEs) |
| North India |
| West India |
| South India |
| East & North-East India |
| By Ownership | Public Sector |
| Private Sector | |
| Joint Sector | |
| Cooperative Sector | |
| By End-user Industry | Automotive & Auto Components |
| Textile & Apparel | |
| Electronics & Electricals | |
| Food & Beverages | |
| Pharmaceuticals & Healthcare | |
| Construction Materials | |
| Chemicals | |
| Aerospace & Defence | |
| Metals | |
| Machinery and Capital Goods | |
| Others (Furniture, etc.) | |
| By Plant Size | Large Enterprises |
| Medium Enterprises | |
| Small & Micro (MSMEs) | |
| By Geography | North India |
| West India | |
| South India | |
| East & North-East India |


Key Questions Answered in the Report
How large is the India manufacturing market in 2026?
The industry is currently worth USD 1.74 trillion and is projected to reach USD 2.47 trillion by 2031 on a 7.26% CAGR.
Which segment is expanding the fastest within the sector?
Electronics and electricals are growing at a 13.46% CAGR, powered by mobile phone and component localization.
What role do MSMEs play in India’s manufacturing growth?
MSMEs already contribute over 70% of private output and are forecast to expand at a 10.04% CAGR thanks to digital credit and PLI incentives.
Why is South India viewed as the growth hotspot?
Aerospace clusters in Bengaluru and large electronics FDI in Tamil Nadu push regional output to a 7.72% CAGR through 2031.
What are the main constraints on future capacity addition?
Port dwell times, land-acquisition delays, volatile lithium and copper prices, and a scarcity of semiconductor-fab talent each shave the forecast CAGR.
Page last updated on:


