Market Overview
| Study Period | 2020 - 2031 |
|---|---|
| Forecast Data Period | 2026 - 2031 |
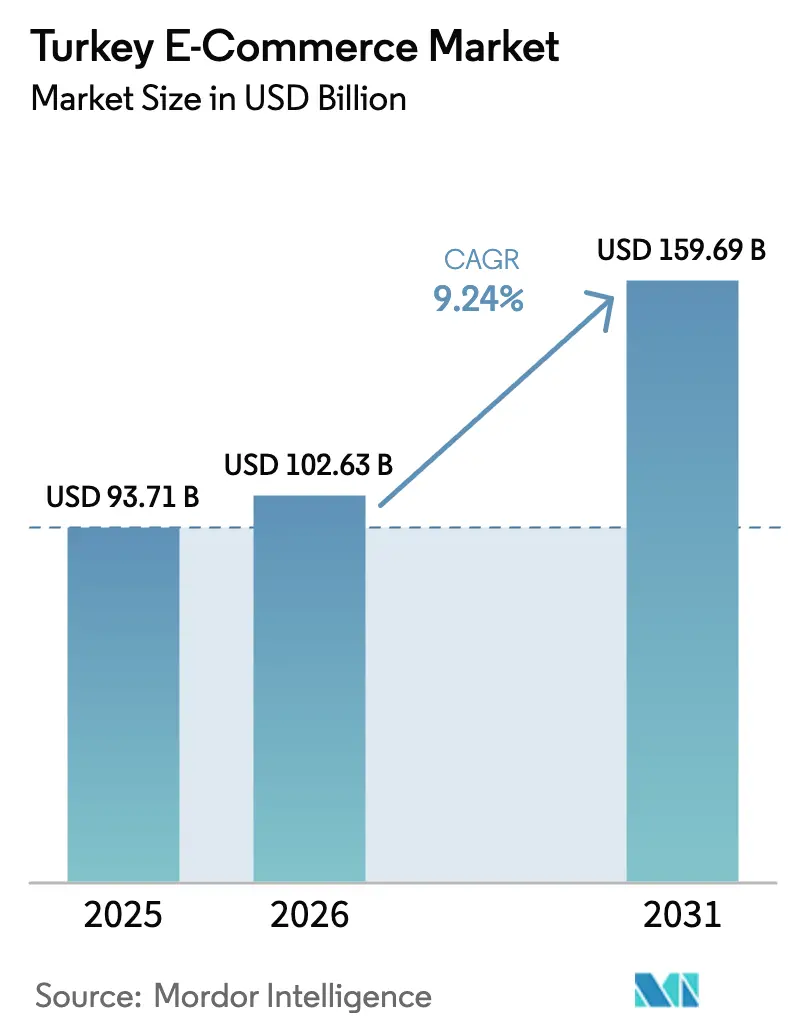
| Base Year Market Size (2025) | USD 93.71 Billion |
| Market Size (2026) | USD 102.63 Billion |
| Market Size (2031) | USD 159.69 Billion |
| Growth Rate (2026 - 2031) | 9.24% CAGR |
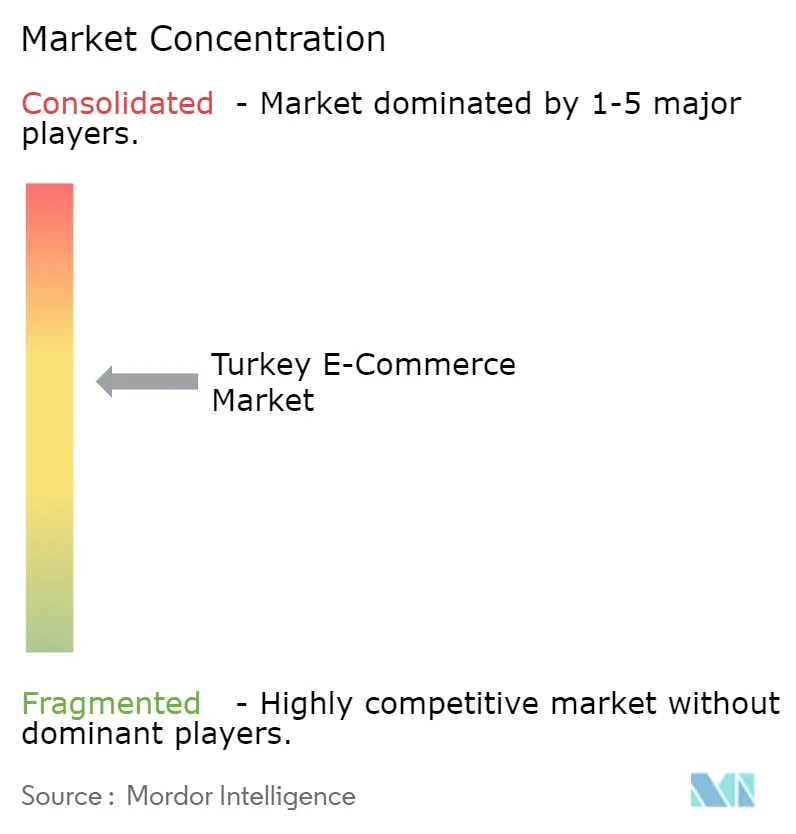
| Market Concentration | Medium |
Major Players *Disclaimer: Major Players sorted in no particular order Image © Mordor Intelligence. Reuse requires attribution under CC BY 4.0. | |
Turkey E-Commerce Market Analysis by Mordor Intelligence
The Turkey e-commerce market size is expected to increase from USD 93.71 billion in 2025 to USD 102.63 billion in 2026 and reach USD 159.69 billion by 2031, growing at a CAGR of 9.24% over 2026-2031. This expansion is anchored in the maturation of domestic payment infrastructure, generous export-promotion incentives, and the rapid scaling of on-demand delivery networks across Istanbul, Ankara, and Izmir. Intensifying smartphone dependence, installment-based card culture, and embedded-finance rollouts continue to widen the user base and ticket size, while asset-light last-mile alliances compress fulfillment costs and shorten delivery windows. Quick-commerce platforms have revived grocery and convenience spending online, and business-to-business (B2B) procurement portals are digitizing industrial sourcing workflows, adding fresh momentum to overall transaction values. Headline risks such as currency volatility, cybersecurity talent shortages, and stricter import-compliance rules remain material but are being partially offset by government-backed tax rebates that stimulate cross-border sales.
Key Report Takeaways
- By business model, business-to-consumer (B2C) transactions led with 80.37% Turkey e-commerce market share in 2025, while B2B platforms are growing fastest at an 11.46% CAGR to 2031.
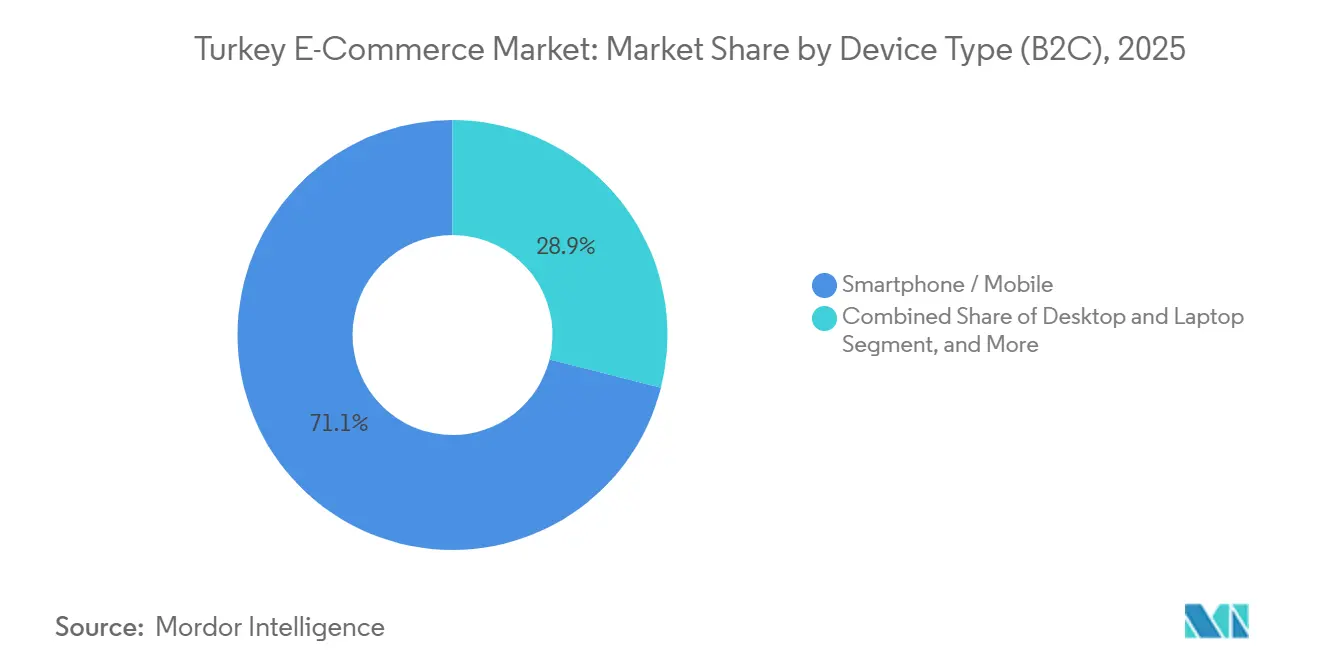
- By device type, smartphones captured 71.06% of the Turkey e-commerce market size in 2025, whereas tablets and smart televisions are forecast to expand at a 12.27% CAGR through 2031.
- By payment method, credit and debit cards retained 53.12% share of the Turkey e-commerce market size in 2025, yet digital wallets are the quickest to scale at a 12.34% CAGR to 2031.
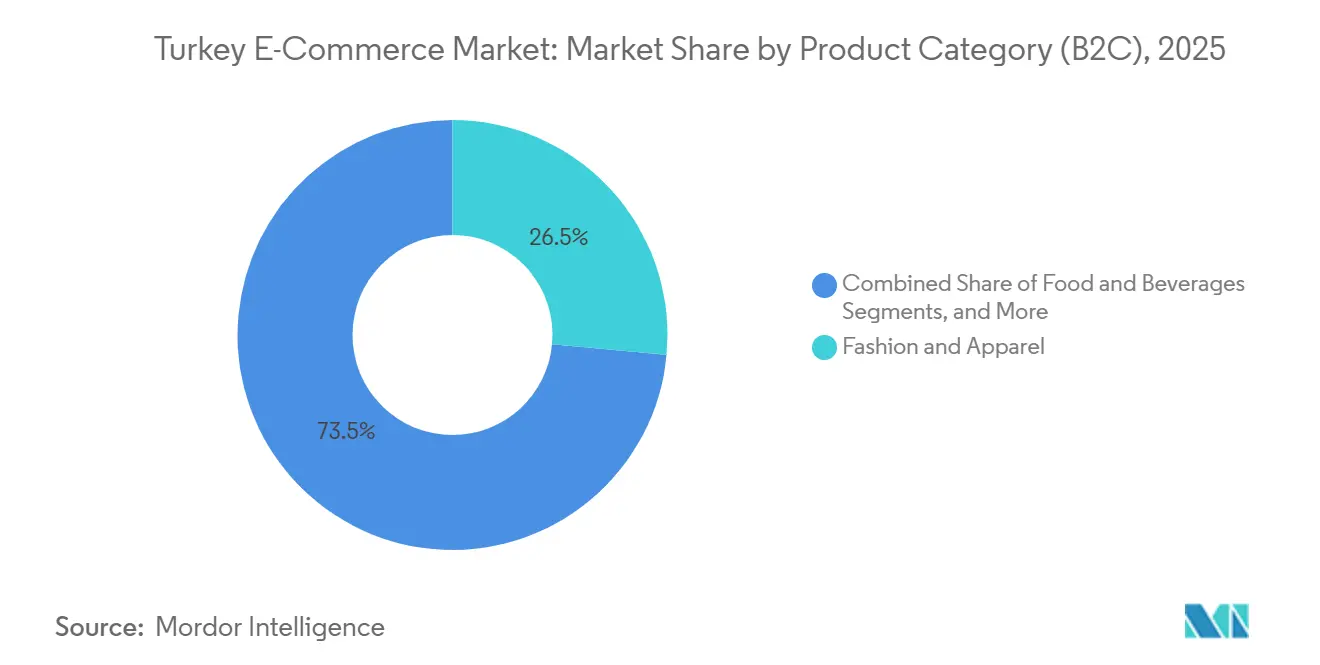
- By product category, fashion and apparel accounted for 26.46% of the Turkey e-commerce market size in 2025, while food and beverages are advancing at a 10.34% CAGR through 2031.
Note: Market size and forecast figures in this report are generated using Mordor Intelligence’s proprietary estimation framework, updated with the latest available data and insights as of January 2026.
Turkey E-Commerce Market Trends and Insights
Drivers Impact Analysis*
| Driver | (~) % Impact on CAGR Forecast | Geographic Relevance | Impact Timeline |
|---|---|---|---|
| Proliferation of Domestic Digital Wallet Troy and Bank Installment Campaigns Driving Checkout Conversion | +1.8% | National, early gains in Istanbul, Ankara, Izmir | Medium term (2-4 years) |
| Government Incentives for Cross-Border E-export via e-İhracat Tax Rebate Program | +1.5% | National, spillover to European Union and Middle East export corridors | Medium term (2-4 years) |
| Expansion of On-Demand Quick-Commerce Platforms in Urban Centers | +1.6% | Istanbul, Ankara, Izmir, Bursa, Antalya | Short term (≤ 2 years) |
| Rising Adoption of BNPL Installment Solutions by Millennials amid High Inflation | +1.4% | National, concentrated in urban millennials | Short term (≤ 2 years) |
| Improvement of Last-Mile Infrastructure After Privatization of PTT and Investments by Cargo Firms | +1.0% | National, rural gains in Marmara and Aegean regions | Long term (≥ 4 years) |
| Emerging AI-Powered Personalization Engines Boosting Average Basket Size | +0.8% | National, platform-led adoption by Trendyol, Hepsiburada, Teknosa | Medium term (2-4 years) |
| Source: Mordor Intelligence | |||
Proliferation of Domestic Digital Wallet Troy and Bank Installment Campaigns Driving Checkout Conversion
Troy, Turkey’s domestic card-payment scheme, counted 67 million cards and 20% market share by August 2025, allowing merchants to bypass higher interchange fees levied by global networks and giving consumers a seamless one-click wallet enriched with loyalty features. Banks simultaneously promote zero-interest installment campaigns tied to Troy-branded cards, which stimulate big-ticket purchases in consumer electronics and home appliances. The blended proposition has trimmed cart-abandonment rates that hovered near 74% in 2024 and accelerated repeat purchases as shoppers remain locked into bank-merchant ecosystems. Turkcell’s Paycell logged TRY 38.7 billion (USD 1.3 billion) in transaction value and 7.2 million active users during Q1 2025, underscoring wallet traction.[1]Turkcell, “Investor Presentation Q1 2025,” turkcell.com.tr As platforms such as Trendyol and Hepsiburada integrate Troy rails, digital-wallet share is poised to outpace cards during the forecast window.
Government Incentives for Cross-Border E-export via e-İhracat Tax Rebate Program
The Ministry of Trade reimburses 50-75% of qualified international marketplace fees, logistics costs, and digital advertising spend, lowering entry barriers for small and medium manufacturers targeting European and Middle Eastern buyers. Textile and home-goods sellers, already competitive on labor and proximity, leverage the rebate to hedge against domestic demand swings and Lira depreciation. Mandatory quarterly reporting through the e-export portal ensures transparency and data-driven policy refinement. This fiscal support accelerates seller onboarding on Amazon, eBay, and Alibaba, reinforcing Turkey’s strategic role as a Eurasian trade corridor.[2]Anadolu Agency, “Türkiye Launches First E-Commerce Week,” aa.com.tr Resulting cross-border volume cushions the Turkey e-commerce market against local macro shocks.
Expansion of On-Demand Quick-Commerce Platforms in Urban Centers
Getir pioneered 10-to-15-minute grocery delivery through dense micro-fulfillment centers, and after a USD 250 million recapitalization in June 2024 refocused on domestic growth. Competitors Yemeksepeti, Migros, and Trendyol’s grocery arm followed suit, propelled by smartphone penetration above 88% in 2025. Promotions, subscription tiers, and electric-bike fleets lift order frequency while algorithmic routing keeps delivery costs in check. Quick commerce is driving food and beverage’s 10.34% CAGR and pushing traditional grocers to launch rival services. Regulatory oversight remains limited to food safety and courier standards, allowing rapid footprint expansion.
Rising Adoption of BNPL Installment Solutions by Millennials amid High Inflation
High inflation erodes purchasing power, prompting millennials to favor buy-now-pay-later (BNPL) plans that stretch costs over two to six months without revolving credit fees. Paycell’s Pay Later handled TRY 3.7 billion (USD 125 million) in non-group volume in Q1 2025. Marketplaces embed BNPL options at checkout, lifting conversion and average order values while partnering banks underwrite short-term credit. Regulatory supervision by the Banking Regulation and Supervision Agency enforces transparent fee disclosure, safeguarding consumer trust. BNPL is expected to underpin the 12.34% digital-wallet CAGR and accelerate credit inclusion.
Restraints Impact Analysis*
| Restraint | (~) % Impact on CAGR Forecast | Geographic Relevance | Impact Timeline |
|---|---|---|---|
| Persistent Lira Volatility Elevating Cross-Border Settlement Costs | -1.2% | National, acute for import-heavy merchants and cross-border sellers | Short term (≤ 2 years) |
| Cybersecurity Skill Shortage Leading to Increased Fraud Risk on Mid-Tier Marketplaces | -0.9% | National, concentrated in smaller platforms lacking enterprise security | Medium term (2-4 years) |
| Complex Returns Legislation (Law No. 6502) Increasing Compliance Costs for SMEs | -0.6% | National, burden on small and medium enterprises | Long term (≥ 4 years) |
| Limited Broadband Quality in Eastern Anatolia Hindering Rural E-commerce Penetration | -0.4% | Eastern Anatolia, rural Marmara and Black Sea regions | Long term (≥ 4 years) |
| Source: Mordor Intelligence | |||
Persistent Lira Volatility Elevating Cross-Border Settlement Costs
Sharp Lira swings raise import invoice values and inflate payment-processor fees, compressing merchant margins and discouraging long-term inventory planning. Many small sellers lack access to affordable hedging tools, pushing them toward dynamic pricing that passes exchange-rate risk to consumers. Presidential Decree No. 10813, effective January 2026, abolished simplified customs entries for B2C imports, lengthening clearance times and compounding cost pressures on inbound goods. As a result, consumers gravitate toward local platforms pricing in Lira, while export-oriented sellers lean more heavily on the e-İhracat rebate to offset currency risk.
Cybersecurity Skill Shortage Leading to Increased Fraud Risk on Mid-Tier Marketplaces
Turkey’s pool of cybersecurity professionals remains insufficient to meet demand, leaving smaller platforms exposed to phishing, payment fraud, and data breaches. Although regulations mandate Personal Data Protection Law No. 6698 and PCI-DSS compliance, enforcement and technical support lag for budget-constrained operators. Larger players invest in machine-learning fraud engines and dedicated security operations centers, widening the trust gap. Elevated salaries for skilled engineers inflate opex, and reputational damage from breaches can throttle customer acquisition. Joint training initiatives between universities, industry groups, and the Ministry of Trade aim to close the talent gap but will take several years to yield results.
*Our forecasts treat driver/restraint impacts as directional, not additive. The impact forecasts reflect baseline growth, mix effects, and variable interactions.
Segment Analysis
By Business Model: B2B Procurement Platforms Gather Momentum
B2C transactions dominated with 80.37% share in 2025, yet B2B portals are expanding at an 11.46% CAGR, outpacing every other segment in the Turkey e-commerce market. Proemtia surpassed USD 250 million in gross merchandise value and links more than 20,000 buyers with 600 suppliers via deferred-payment cards valid up to 150 days.[3]Proemtia, “Proemtia – Türkiye’s Leading B2B Marketplace,” proemtia.com ZerGO, launched by KoçZer in 2024, already hosts 600 merchants and over 300,000 stock-keeping units, offering integrated logistics and real-time bid comparisons.[4]Spryker, “KoçZer’s ZerGO Marketplace Case Study,” spryker.com Buyers cut tender cycles from weeks to days, and sellers gain nationwide reach without building field sales teams.
Corporate digitization and cost-transparency imperatives will keep B2B momentum high. KoçZer’s long-term target of migrating 40% of revenue to digital platforms signals structural commitment. Meanwhile, B2C giants continue investing in AI-powered personalization and subscription tiers, ensuring that absolute B2C volume grows even if share slips. The convergence of embedded finance, e-invoicing, and electronic tendering tools positions the Turkey e-commerce market for deeper enterprise penetration.
By Device Type (B2C): Mobile Retains Primacy as Lean-Back Screens Rise
Smartphones held 71.06% of device-level orders in 2025, affirming Turkey’s status as a top-three global mobile-shopping nation. Hepsiburada’s November 2025 campaign alone drove 600 million visits, 90% of which originated on mobile apps. Tablets and smart televisions, while still niche, are projected to record a 12.27% CAGR, boosted by app-optimized interfaces and living-room voice assistants that encourage relaxed browsing.
Retailers prioritize app-exclusive deals and push notifications to lock in daily engagement. Enhanced biometric log-ins, location data, and camera-based AR features refine personalization algorithms. As connected-home ecosystems mature, smart-TV commerce will steadily chip away at desktop share, giving rise to multi-screen strategies that let users research on mobile during commutes, compare on desktop at work, and finalize purchases via tablet or TV at home.


By Payment Method (B2C): Digital Wallets and BNPL Redefine Checkout
Cards remained dominant at 53.12% in 2025, reflecting Turkey’s ingrained installment culture where 65% of shoppers split payments. Yet wallet-based payments are scaling at a 12.34% CAGR, powered by Troy, Paycell, and marketplace-branded wallets. Paycell’s 7.2 million active users and USD 1.3 billion quarterly volume underscore how loyalty points, bill-pay, and peer-to-peer transfers cultivate habitual app usage.
BNPL, nested within wallet functionality, appeals to millennials seeking transparent, short-term credit. Regulatory clarity fosters trust and drives merchant adoption. Cash on delivery still surfaces in rural areas but faces gradual decline as broadband and trust levels improve. Embedded finance partnerships, such as Trendyol’s fintech MOU with ADQ and Ant International, illustrate the next frontier where marketplaces monetize interchange and cross-sell deposits, insurance, and investments.
By Product Category (B2C): Quick-Commerce Elevates Food and Beverages
Fashion and apparel own 26.46% of 2025 turnover, but food and beverages are advancing fastest at a 10.34% CAGR, buoyed by 10-minute delivery models. Getir’s dense micro-fulfillment networks and Migros’ competing service convert habitual grocery trips into recurring online orders. Electronics remain pivotal as product-launch cycles and trade-in programs spur repeat spending. Beauty and personal care leverage AR try-ons and influencer content, while furniture sales depend on 3D visualization and white-glove assembly that lift entry barriers for smaller rivals.
Specialty marketplaces fill long-tail niches. Teknosa recorded USD 450 million in e-commerce gross merchandise value during 2024 and supports 1,605 third-party merchants, highlighting the viability of category-focused hybrids.[5]Teknosa, “Integrated Report 2024,” teknosa.com The food-and-beverage surge pressures traditional grocers to digitize assortments and adopt subscription baskets, broadening overall spend in the Turkey e-commerce market.
Geography Analysis
Istanbul, Ankara, and Izmir account for the lion’s share of Turkey e-commerce market activity, benefiting from higher incomes, dense logistics corridors, and near-universal 4.5G coverage. Istanbul alone hosts the bulk of dark stores and fulfillment hubs used by Trendyol, Getir, and Yemeksepeti, enabling sub-hour delivery on high-frequency orders. The Marmara region, encompassing Bursa and Kocaeli, adds industrial purchasing power that funnels through B2B portals like Proemtia.
Aegean cities such as Izmir blend tourism-driven retail with agricultural exports that leverage the e-İhracat subsidy to reach European buyers. Central Anatolia, led by Ankara, shows steady but slower penetration due to lower disposable income and a larger public-sector workforce. Eastern Anatolia and parts of the Black Sea region lag, hampered by patchy broadband and sparse courier coverage, keeping cash-on-delivery relevant.
Government fiber-optic investments aim to narrow the digital divide, and private cargo firms are trialing drone drops for hard-to-reach villages. Platforms tailor fulfillment promises accordingly: same-day in metros, next-day in secondary cities, and 48-hour windows in rural zones. Cross-border sellers concentrate on Germany, France, and the Netherlands, exploiting customs-union advantages, while Middle Eastern corridors to Saudi Arabia and the United Arab Emirates capture demand for affordable fashion. Decree No. 10813 complicates inbound parcels from AliExpress and Amazon Global, potentially re-routing demand toward domestic merchants who stock internationally sourced goods locally, thus insulating shoppers from customs delays.
Competitive Landscape
Moderate concentration defines the Turkey e-commerce market. Trendyol led with USD 10.82 billion in gross merchandise value for 2024, while Hepsiburada, public on NASDAQ, ranks second. Category specialists, such as Teknosa in electronics and LC Waikiki in fashion, defend niches through private labels and vertical integration. Trendyol’s May 2025 sale of an 85% stake in Trendyol Go to Uber for USD 700 million freed capital for technology upgrades and merchant subsidies while granting Uber instant scale in high-frequency delivery.
Hepsiburada leans on loyalty programs and cloud infrastructure to fend off Amazon Turkey and AliExpress, who struggle with localization and stricter customs rules. Social-commerce on TikTok and Instagram introduces fresh competition by funneling shoppers directly to influencers’ storefronts, bypassing traditional marketplaces. Meanwhile, B2B upstarts Proemtia and ZerGO vie for procurement dominance, leveraging deferred-payment cards and integrated logistics to court enterprise buyers.
Technology remains the decisive lever. Teknosa’s Bilge 2.0 AI consultant parses 99% of call-center dialogues for sentiment, lifting service quality. Fraud-monitoring engines, dynamic-pricing algorithms, and AI-based pick-route optimization improve margins and retention. Compliance capabilities under Consumer Protection Law No. 6502 and Data Protection Law No. 6698 separate incumbents from under-funded newcomers that struggle with return logistics and encryption mandates.
Turkey E-Commerce Industry Leaders
Amazon Turkey
Trendyol Group
Sahibinden Bilgi Teknolojileri
D-Market Elektronik (Hepsiburada)
Doğuş Planet (n11)
- *Disclaimer: Major Players sorted in no particular order

Recent Industry Developments
- January 2026: Presidential Decree No. 10813 abolished simplified customs entries for B2C imports, extending clearance times for parcels from AliExpress and other foreign sellers.
- November 2025: Hepsiburada targeted 600 million site visits and 50 million product sales during its November campaign, citing 90% consumer participation intentions.
- November 2025: The Ministry of Trade staged the inaugural E-Commerce Week in Istanbul, highlighting a USD 90 billion ecosystem housed by 601,000 sellers.
- June 2025: Trendyol, ADQ, Ant International, and Baykar signed an MoU to create a broad-spectrum fintech platform serving merchants and consumers.
- May 2025: Uber agreed to acquire 85% of Trendyol Go for USD 700 million, pending regulatory clearance in H2 2025.


Research Methodology Framework and Report Scope
Market Definitions and Key Coverage
Our study defines the Turkish e-commerce market as the value created when households or enterprises in Turkiye purchase tangible goods or paid digital content through websites or mobile apps and receive the order by delivery or store-pickup.
Scope exclusions include pure service bookings (ride-hailing, online gambling, bill pay) and wholesale-only transactions, which are left out.
Segmentation Overview
- By Business Model
- B2C
- B2B
- By Device Type (B2C)
- Smartphone / Mobile
- Desktop and Laptop
- Other Device Types
- By Payment Method (B2C)
- Credit and Debit Cards
- Digital Wallets
- Buy Now Pay Later (BNPL)
- Other Payment Methods
- By Product Category (B2C)
- Beauty and Personal Care
- Consumer Electronics
- Fashion and Apparel
- Food and Beverages
- Furniture and Home
- Toys, DIY and Media
- Other Product Categories
Detailed Research Methodology and Data Validation
Primary Research
We spoke with marketplace managers, parcel-logistics heads, SME exporters, and payment-gateway executives across Istanbul, Ankara, and Izmir. Their insights on basket size, cross-border take-rates, and BNPL adoption sharpened assumptions and reconciled model outputs.
Desk Research
We started with publicly available pillars such as the Ministry of Trade's "E-Commerce Outlook," TUIK retail indices, Central Bank card dashboards, and ETID releases. We then verified trends through customs shipment files, listed-retailer 10-Ks, and marketplace IPO prospectuses. D&B Hoovers supplied company splits, while Dow Jones Factiva flagged policy or currency shocks that could distort volumes. The sources named are illustrative; many additional documents supported data collection and validation.
Market-Sizing & Forecasting
We employ a top-down build anchored on Central Bank e-payment outflows, which are cleaned of service-only lines and matched to retail basket averages to size demand. Target totals are cross-checked bottom-up through sampled seller GMV roll-ups, warehouse throughput, and smartphone shopper ratios before locking the value. Key variables include disposable income, parcel density, wallet usage, currency volatility, and smartphone share. These variables feed a multivariate regression with scenario analysis to project a growth rate that our experts endorse as the base case.
Data Validation & Update Cycle
We run three-layer variance checks, re-contact sources when outputs deviate by more than five percent from ministerial or card benchmarks, and refresh every twelve months, issuing interim updates when exchange-rate or tax shocks materially shift the market outlook.
Why Mordor's Turkey E-commerce Market Baseline Is Widely Trusted
Estimates often differ because publishers choose alternate scopes, currencies, or refresh moments; knowing these levers is vital before any strategic bet.
Most gaps arise from whether travel, ticketing, C2C resale, or corporate procurement are counted, how gross merchandise value is netted for returns, and which exchange rate converts lira to dollars. We apply a uniform mid-year FX rate, report GMV net of taxes and cancellations, and update annually, while others may cite retail-only sales or spot-day conversions.
Benchmark comparison
| Market Size | Anonymized source | Primary gap driver |
|---|---|---|
| USD 93.54 B (2025) | Mordor Intelligence | - |
| USD 27.35 B (2024) | Regional Consultancy A | Retail-only scope; omits travel, services |
| USD 89.58 B (2024) | Trade Journal B | Uses gross value incl. VAT & shipping; spot FX |
| USD 77.89 B (2023) | Industry Association B | B2C + small-ticket B2B; older base year |
The comparison shows that Mordor's disciplined scope choices and consistent FX treatment create a transparent, repeatable baseline that decision-makers can rely on.


Key Questions Answered in the Report
How large is the Turkey e-commerce market in 2026?
The Turkey e-commerce market size is USD 102.63 billion in 2026 and is projected to hit USD 159.69 billion by 2031.
Which business model is expanding fastest online in Turkey?
B2B procurement portals are the quickest, growing at an 11.46% CAGR as firms digitize sourcing and tendering.
What payment method is gaining the most traction?
Digital wallets, powered by Troy rails and BNPL features, are advancing at a 12.34% CAGR through 2031.
Which product category is set to outpace others?
Food and beverages lead in growth, forecast to rise at a 10.34% CAGR on the back of 10-minute quick-commerce delivery.
How does currency volatility affect online retailers?
Lira swings inflate import costs and payment-processor fees, squeezing margins and driving shoppers to domestically priced platforms.
Who are the leading e-commerce players in Turkey?
Trendyol and Hepsiburada lead by gross merchandise value, followed by specialists such as Teknosa in electronics and LC Waikiki in fashion.
Page last updated on:


