
Market Overview
| Study Period | 2021 - 2031 |
|---|---|
| Forecast Data Period | 2026 - 2031 |
| Base Year Market Size (2025) | USD 18.15 Billion |
| Market Size (2026) | USD 19.65 Billion |
| Market Size (2031) | USD 29.27 Billion |
| Growth Rate (2026 - 2031) | 8.28 % |
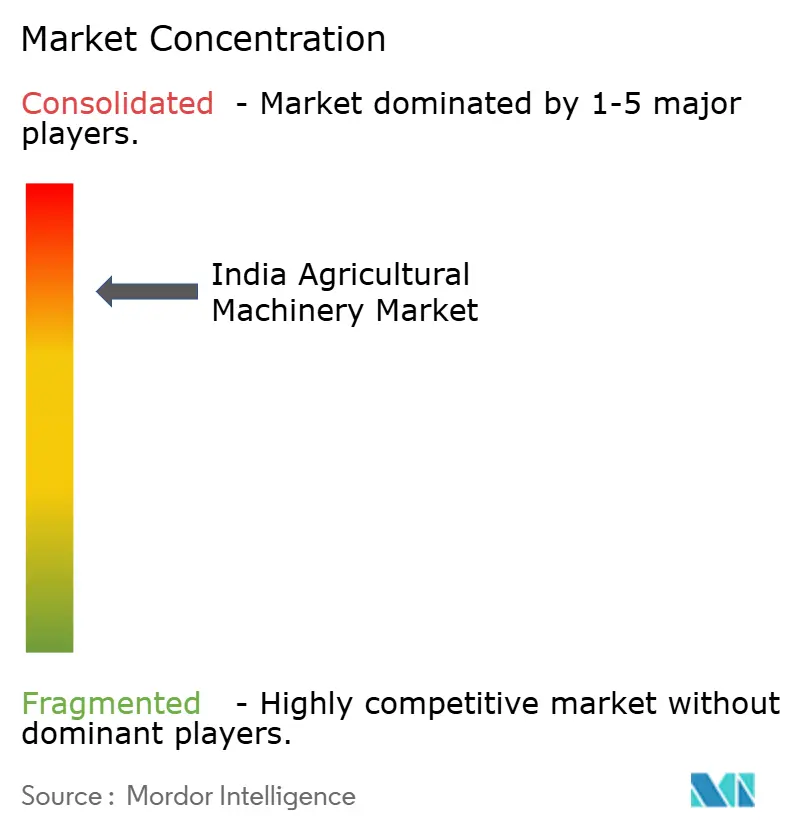
| Market Concentration | High |
Major Players *Disclaimer: Major Players sorted in no particular order Image © Mordor Intelligence. Reuse requires attribution under CC BY 4.0. | |
India Agricultural Machinery Market Analysis by Mordor Intelligence
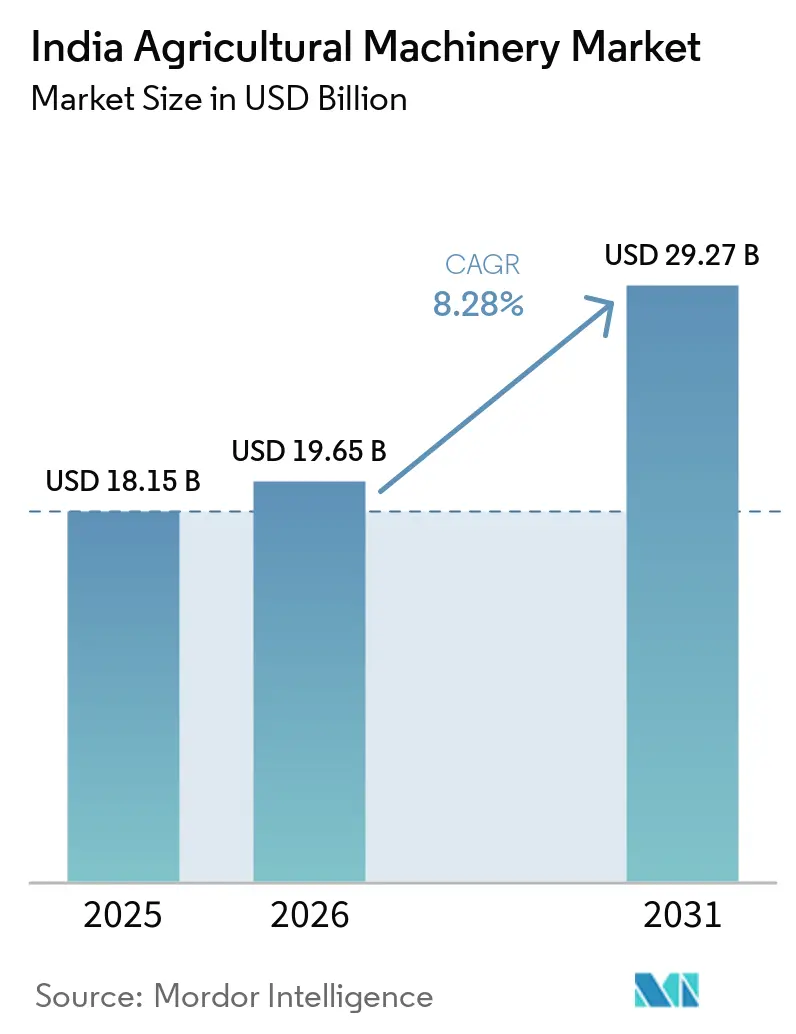
India agricultural machinery market size in 2026 is estimated at USD 19.65 billion, growing from 2025 value of USD 18.15 billion with 2031 projections showing USD 29.27 billion, growing at 8.28% CAGR over 2026-2031. Robust public-sector incentives, persistent rural labor shortages, and rapid digitalization are converging to accelerate equipment adoption nationwide. Subsidies under the Sub-Mission on Agricultural Mechanization (SMAM) lower the upfront cost of tractors, irrigation systems, and precision implements, while custom-hiring centers extend access to smallholder farmers. Rising urban migration reduces available farm labor, pushing growers toward mechanized solutions that can sustain timely planting and harvesting operations. In parallel, the Digital Agriculture Mission is creating a farmer registry and geotagged crop database that will underpin precision equipment deployment and data-driven financing. Emission regulations plus emerging incentives for low-emission tractors spur investment in cleaner powertrains, positioning electric and hybrid models as a nascent but strategic growth pocket. Competitive rivalry intensifies as the major players are prompting new product launches and capacity expansions geared toward mid-power tractors and smart implements.
Key Report Takeaways
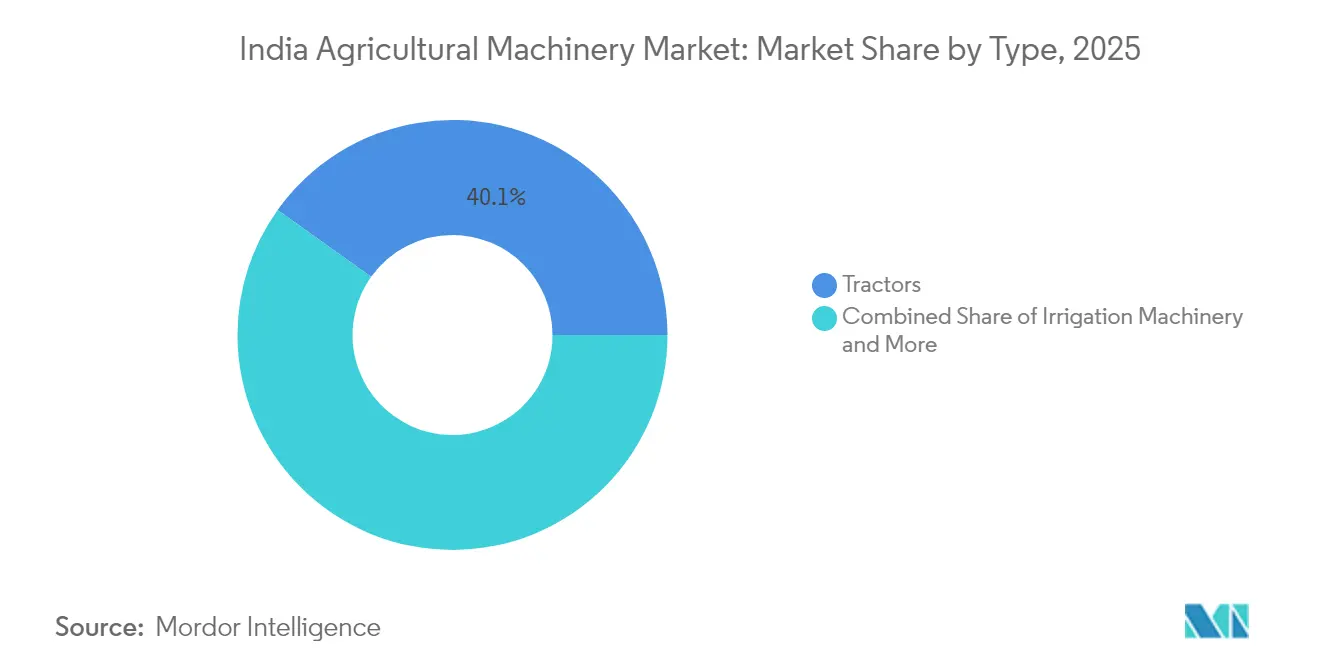
- By type, tractors captured 40.12% of the India agricultural machinery market share in 2025, while irrigation machinery is forecast to expand at a 10.18% CAGR through 2031.
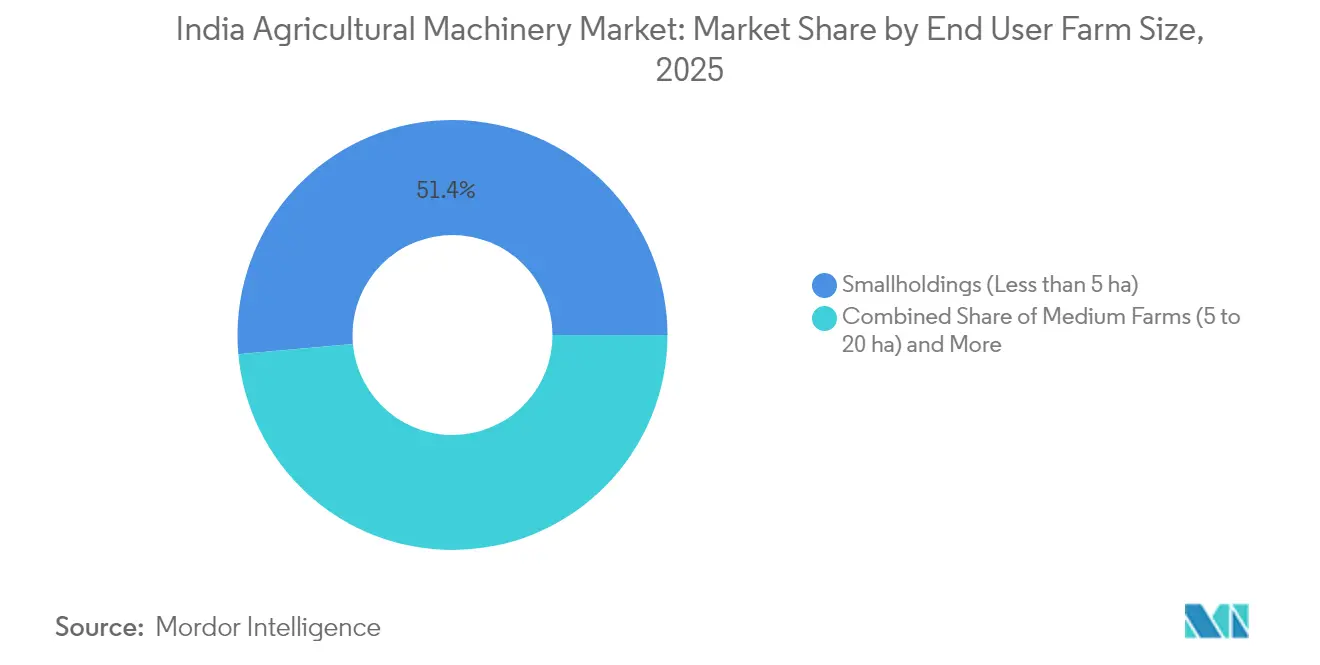
- By end-user farm size, smallholdings under 5 hectares represented 51.42% of the India agricultural machinery market size in 2025, and the large farms above 20 hectares are advancing at an 11.31% CAGR through 2031.
Note: Market size and forecast figures in this report are generated using Mordor Intelligence’s proprietary estimation framework, updated with the latest available data and insights as of 2026.
India Agricultural Machinery Market Trends and Insights
Drivers Impact Analysis*
| Driver | (~) % Impact on CAGR Forecast | Geographic Relevance | Impact Timeline |
|---|---|---|---|
| Government schemes boosting mechanization adoption | +1.2% | Uttar Pradesh, Punjab, and Haryana | Medium term (2-4 years) |
| Rural labor shortage caused by sustained migration to urban centers | +0.9% | Bihar, West Bengal, and Uttar Pradesh | Long term (≥ 4 years) |
| FPOs and contract farming aggregation | +0.7% | Maharashtra, Karnataka, and West Bengal | Medium term (2-4 years) |
| Digital credit platforms enabling financing | +0.8% | Gujarat, Maharashtra, and Tamil Nadu | Short term (≤ 2 years) |
| Electric equipment incentives accelerating adoption | +0.6% | Punjab, Haryana, and Maharashtra | Long term (≥ 4 years) |
| Climate insurance favoring mechanized cultivation | +0.5% | Rajasthan and Maharashtra | Medium term (2-4 years) |
| Source: Mordor Intelligence | |||
Government schemes boosting mechanization adoption
Policy interventions under SMAM provide 40%-50% subsidies on individual machinery purchases and up to 80% on custom-hiring centers. In Uttar Pradesh alone, SMAM disbursed INR 65.66 billion (USD 790 million) between 2014 and 2024, distributing 176,000 machines and establishing 10,769 custom-hiring centers, which collectively expand access to high-capacity equipment across smallholder communities.[1]Source: Press Information Bureau, “Digital Agriculture Mission: Tech for Transforming Farmers’ Lives,” PIB.gov.in Complementary initiatives such as the Kisan Drone subsidy and crop-specific support under the National Food Security Mission channel further demand high-precision implements. These programs not only minimize upfront costs but also strengthen after-sales networks, thereby fostering sustained mechanization across diverse agro-climatic zones.
Rural labor shortage caused by sustained migration to urban centers
Household survey data indicate that only 9% of main income earners remain in farming, down from historic norms above 50%. Seasonal out-migration peaks during planting and harvesting, intensifying labor deficits that mechanization can bridge through timely tillage, sowing, and harvesting.[2]Source: International Crops Research Institute for the Semi-Arid Tropics, “Farm mechanization trends and policy in India,” ICAR.org.in Combine harvesters cut labor requirements by up to 30% and reduce post-harvest losses by 2-4 percentage points, making them indispensable in rice-wheat rotations. Equipment sharing through custom-hiring centers further leverages scarce machinery to maintain cropping intensities in labor-scarce districts.
FPOs and contract farming aggregation
More than 26,000 Farmer-Producer Organizations (FPOs) have been registered, with government grants of up to INR 1.8 million (USD 21,700) per entity to finance collective infrastructure. Aggregation bolsters bargaining power, enabling bulk procurement of tractors, planters, and threshers on favorable terms. Contract farming within Farmer-Producer Organizations (FPOs) clusters also creates predictable cash flows, aligning loan repayment with harvest cycles and incentivizing higher-capacity machinery acquisitions that individual smallholders could not manage alone.
Digital credit platforms enabling financing
Over 7.7 million Kisan Credit Cards have been digitized, providing working-capital limits up to INR 500,000 (USD 6,000) and seamless integration with equipment dealerships. Advanced risk scoring that uses satellite imagery and yield analytics has trimmed loan-approval times to less than 72 hours and reduced default rates by 120 basis points, prompting lenders to roll out pay-per-use tractor loans and embedded insurance bundles. Accessible financing accelerates the India agricultural machinery market by unlocking latent demand among credit-constrained farmers.
Restraints Impact Analysis*
| Restraint | (~) % Impact on CAGR Forecast | Geographic Relevance | Impact Timeline |
|---|---|---|---|
| High equipment cost and limited credit access | -1.1% | Bihar, Odisha, and eastern states | Medium term (2-4 years) |
| Fragmented landholdings limit scale efficiency | -0.8% | Punjab, Haryana, and Uttar Pradesh | Long term (≥ 4 years) |
| Emission norms vary across states | -0.4% | Industrialized regions | Short term (≤ 2 years) |
| Lack of skilled telematics technicians | -0.3% | Rural districts nationwide | Medium term (2-4 years) |
| Source: Mordor Intelligence | |||
High equipment cost and limited credit access
Despite generous subsidies, a mid-horsepower tractor still requires an outlay exceeding INR 600,000 (USD 7,200), a sum beyond the reach of many marginal growers. Formal lenders often demand collateral, and interest spreads remain 200-300 basis points above prime lending, deterring big-ticket investments. Custom-hiring centers cushion the cost hurdle but are unevenly distributed, eastern India hosts fewer than 12 centers per district versus 45-plus in parts of the north, perpetuating regional disparities.
Fragmented landholdings limit scale efficiency
The average operational holding has shrunk to 0.2 hectares, making self-owned machinery economically unviable. Narrow field geometry complicates maneuverability for combine harvesters and boom sprayers, raising per-acre operating costs. While FPO aggregation and land-leasing reforms are evolving, the structural constraint of fragmentation continues to throttle large-equipment penetration in the India agricultural machinery market.
*Our forecasts treat driver/restraint impacts as directional, not additive. The impact forecasts reflect baseline growth, mix effects, and variable interactions.
Segment Analysis
By Type: Tractors anchor adoption while irrigation accelerates
Tractors retained a 40.12% revenue share in 2025, underscoring their foundational role in tillage and haulage across diverse cropping systems. Irrigation Machinery is the fastest growing segment with micro-irrigation pumps and drip systems advancing at a 10.18% CAGR, propelled by drought-mitigation programs and rising electricity tariffs that favor precision watering. Equipment segments, including plows, harrows, and rotovators, benefit from the mechanization push in smallholder farming, where these implements provide entry-level mechanization solutions that require lower capital investment than tractors. Harvesting machinery experiences steady growth as labor shortages intensify during peak seasons, with combine harvesters and forage harvesters becoming essential for timely crop collection in commercial farming operations.
Adapters that merge global navigation satellite systems with traditional implements are converting conventional tractors into smart machines that execute straight-line plowing and seed placement within ±2.5 cm precision, reducing input waste by 6%-8%. Electric-assist rotovators and battery-powered orchard sprayers are gaining traction among fruit growers, where low noise and zero emissions are prized. The India agricultural machinery market continues to diversify as balers, mowers, and mulchers gain relevance in residue-management schemes aimed at curbing open-field burning. Market leaders respond with modular attachment ecosystems, allowing a single tractor chassis to support over 20 task-oriented implements, thereby spreading ownership cost over multiple revenue streams.



By End-User Farm Size: Smallholders dominate, yet large farms surge
Smallholdings under 5 hectares captured 51.42% of the India agricultural machinery market in 2025, reflecting the structural dominance of marginal holdings. These growers gravitate toward low-horsepower tractors (20-35 HP) and entry-level implements priced below INR 175,000 (USD 2,100). Medium farms spanning 5-20 hectares account for 35.02% of revenue and display a growing appetite for precision seeders and multi-crop threshers that shorten turnaround times between successive crops.
Large farms above 20 hectares post the highest growth at 11.31% CAGR through 2031 as consolidation accelerates in peri-urban belts and export-oriented commodity zones. This cohort invests in 45-70 HP tractors, combine harvesters, and variable-rate fertilizer applicators that enhance scale economies. Government policies specifically target small and marginal farmers through enhanced subsidies and Custom Hiring Centres, creating pathways for mechanization access regardless of farm size while supporting the transition toward more efficient agricultural structures. Integrated telematics dashboards help estate managers oversee fleet utilization and predictive maintenance, unlocking uptime improvements exceeding 5 percentage points.
Geography Analysis
Punjab and Haryana jointly account for a significant share of aggregate tractor sales despite holding only 7% of the national cultivable area, mirroring high farm power availability above 3 kW per hectare. Subsidized residue-management kits and favorable minimum support prices sustain demand for straw balers and reversible plows that reduce open-field burning episodes. These two states illustrate a mature mechanization plateau where replacement and technology upgrade cycles, rather than first-time purchases, now drive growth.
Maharashtra and Gujarat showcase diversified cropping patterns that necessitate equipment ranging from cotton pickers to drip-line installation rigs. Vidarbha’s dramatic 850-fold surge in rotovator adoption within a decade underscores latent demand once price and credit barriers are eased. Gujarat’s horticulture clusters adopt fertigation pumps and greenhouse sprayers, helping the state achieve India’s highest micro-irrigation coverage at 65% of irrigated area. The state's progressive policies and farmer education programs create an environment conducive to technology adoption, with digital agriculture initiatives gaining traction through public-private partnerships and demonstration projects.
Eastern and central regions represent the next frontier, with Uttar Pradesh alone requiring farm power to double from 2.0 kW per hectare to 4.0 kW to meet projected food demand. Farmer-Producer Organization (FPO)-led aggregation and state-backed custom-hiring hubs are key to scaling machinery density, particularly in rice-dominated districts where puddling and transplanting are labor-intensive. Meanwhile, Karnataka and Tamil Nadu lead southern India in integrating digital advisory with equipment services, exemplified by e-crop booking systems that synchronize machinery availability with phenology forecasts. Together, these initiatives position the India agricultural machinery market for geographically balanced growth over the coming decade.
Regulatory Landscape
India's central and state subsidy-driven mechanization push is anchored in SMAM, administered by the Department of Agriculture and Farmers Welfare through the agrimachinery.nic.in platform. As of 9 July 2026, SMAM central assistance totaled INR 9,404.47 crore since launch, with deployment of about 21.61-22 lakh machines. This reflects ongoing procurement through individual-beneficiary support and Custom Hiring Centres (CHCs), alongside private retail channels.
For subsidy eligibility, equipment priced above INR 35,000 must be tested at Farm Machinery Training and Testing Institutes (FMTTIs) or designated centers. Environmental compliance tightens for higher horsepower tractors: tractors above 37 kW align with Bharat Stage (CEV/TREM) V emission norms effective 1 April 2024, with MoRTH acting as the nodal authority for CMVR-type approvals and AIS-137 testing protocols.
Competitive Landscape
The India agricultural machinery market remains concentrated, with Mahindra & Mahindra Ltd, Tractors and Farm Equipment Limited (TAFE) , Deere & Company, CNH Industrial N.V., and International Tractors Limited (Sonalika) being the major players in the market. Mahindra & Mahindra Ltd extended its lead to 43.3% in FY 2025 by leveraging a 1,200-dealer network and rolling out the OJA smart-tractor platform that embeds automation and remote diagnostics. Deere & Company’s USD 100 million greenfield plant in Maharashtra targets mid-power tractor exports and positions the company to challenge the incumbent leadership in premium utility segments.
Technology differentiation is paramount. Mahindra & Mahindra Ltd’s MYOJA intelligence pack offers in-cabin displays and geofence alerts, while Escorts Kubota Limited integrates Kubota’s engine technology for improved fuel efficiency. CNH Industrial N.V. pilots 4G-enabled combine harvesters that transmit real-time yield maps to cloud dashboards, aiding input optimization. Domestic innovators such as VST Tillers Tractors Ltd. progressively shift from two-wheel to compact four-wheel tractors, targeting niche orchard and horticulture applications where maneuverability is crucial.
Strategic alliances accelerate Research and Development and market penetration. Mahindra & Mahindra Ltd collaborates with Mitsubishi Mahindra Agricultural Machinery on compact diesel engines, while Deere & Company partners with Indian startups for AI-based weed detection. Policy-driven electrification opens a greenfield segment where new entrants develop battery-swap systems tailored to remote villages lacking continuous grid power. As emission rules stiffen, larger firms exploit scale economies in compliance engineering, potentially widening the moat against smaller assemblers in the India agricultural machinery market.
India Agricultural Machinery Industry Leaders
Deere & Company
CNH Industrial N.V.
International Tractors Limited (Sonalika)
Mahindra & Mahindra Ltd
Tractors and Farm Equipment Limited (TAFE)
- *Disclaimer: Major Players sorted in no particular order

Market Opportunities and Future Outlook
A policy-funded access gap for small and marginal farmers is still evident, leaving room for CHC-led business models, equipment-as-a-service offerings, and financing linked to shared utilization. SMAM cost sharing between the Centre and states is configured as 60:40 for normal states, 90:10 for North Eastern and Himalayan states, and 100:0 for Union Territories. A July 2026 SMAM status update cited about 21.61 lakh deployed machines and continued demonstrations under Kisan Drone programs, indicating a shift from tractors toward services and precision use cases.
Crop- and activity-specific mechanization is also shaping differentiated portfolios and localized attachments. With FPOs aggregating demand and supporting village-level infrastructure, the value chain can expand into post-harvest and processing equipment, plus related services. Ecosystem-building efforts include ICAR-IIMR inaugurating a CHC at Tekmal Mandal Farmers Producer Cooperative Society with millet-focused processing equipment in February 2026, ICAR-CIAE operating post-harvest machinery testing capability in Bhopal (July 2026), and ICAR-CIARI inviting SHITIJ 2.0 applications (July 2026) to incubate startups in farm mechanization and post-harvest technologies, which supports newer implement categories, indigenized designs, and subsidy-eligibility alignment.
Recent Industry Developments
- June 2026: Mahindra and Mahindra reported 58,177 domestic tractor sales for its Farm Equipment Business for June 2026. The update indicates continued channel throughput and reinforces the role of large dealer networks in pushing mechanization into rural districts during peak demand periods.
- February 2025: Deere and Company introduced the 5130M tractor in India, positioned as a 130 HP offering with smart connectivity and precision farming features. The launch expanded the high-horsepower product envelope available in-market and supported adoption among larger operators and fleet owners seeking higher-capacity utility tractors.
- June 2024: New Holland (CNH Industrial) launched the WORKMASTER 105 tractor in India with a TREM-IV compliant FPT engine and a 106 HP rating. This launch increased competitive pressure in the 100+ HP band and pointed to growing emphasis on higher-spec tractors with feature upgrades focused on operator comfort and productivity.


Research Methodology Framework and Report Scope
Market Definition and Coverage
This market covers the value of farm machinery and equipment sold and used in India to support field preparation, planting, crop care, harvesting, and related on-farm operations, across organized and unorganized channels wherever data is traceable.
Scope exclusions: Forestry machinery, construction equipment used outside farming, and general-purpose industrial tools are not counted.
Segmentation Overview
- By Type
- Tractors
- Less than 50 HP
- 50 to 75 HP
- 76 to 100 HP
- 101 to 150 HP
- Greater than 150 HP
- Equipment
- Plows
- Harrows
- Rotovators and Cultivators
- Seed and Fertilizer Drills
- Other Equipment (Post-Hole Diggers, Power Weeders, etc.)
- Irrigation Machinery
- Sprinkler Irrigation
- Drip Irrigation
- Other Irrigation Machinery (Center-Pivot Systems, Micro-Sprinklers, etc.)
- Harvesting Machinery
- Combine Harvesters
- Forage Harvesters
- Other Harvesting Machinery (Sugarcane Harvesters, Potato Harvesters, etc.)
- Haying and Forage Machinery
- Mowers and Conditioners
- Balers
- Other Haying and Forage Machinery (Tedders, Rakes, etc.)
- Tractors
- By End-User Farm Size
- Smallholdings (Less than 5 ha)
- Medium Farms (5 to 20 ha)
- Large Farms (Greater than 20 ha)
Data Sources, Market Sizing, and Validation
Desk Research
Desk work started with building the demand context for mechanization in India, where we pulled long-run signals like cropped area, operational holdings, and labor availability. Public sources such as the Ministry of Agriculture and Farmers Welfare, the Agriculture Census, and National Sample Survey style datasets helped frame how equipment adoption changes by farm size and crop patterns.
We also used sources such as the Directorate General of Commercial Intelligence and Statistics for import and export trends, and open statistical releases that track tractors and farm equipment production and sales by category. Annual reports, investor presentations, and reputed press coverage were used to cross-check product mix shifts and price movement. For hard-to-track private company financials and patent activity, we selectively used paid database subscriptions to validate revenue bands and technology direction. The desk sources listed here are illustrative only, and we also drew on other public and proprietary references during data collection, clarification, and cross-checking.
Primary Interviews and Surveys
Primary work was used to stress-test adoption assumptions and pricing, since dealership schemes, subsidy timing, and financing availability can change quickly. We spoke with a mix of OEM-side, channel-side, and large user-side experts across key farming states, then reconciled the feedback back into the model so outlier claims did not over-influence totals.
Distribution of primary research fieldwork respondents
| Company type | Respondent position |
|---|---|
| Top tier: 29% | CXOs: 17% |
| Mid tier: 54% | Functional/Unit leaders: 38% |
| Smaller Players: 17% | Managers: 45% |
Market-Sizing & Forecasting
Sizing was first constructed using a top-down logic where farm mechanization spending is rebuilt from India-level indicators and category penetration, then translated into equipment demand by applying realistic replacement and utilization behavior. To keep the estimate grounded, we used selective bottom-up approximations as checks, such as sampled average selling price (ASP) x volume for key equipment groups and channel checks on district-level sales intensity.
In the model, the most useful inputs were tractor and implement sales trends, equipment price bands and financing rates, subsidy rollout pace under central and state schemes, diesel price movement as a proxy for operating cost sensitivity, and the shift in labor availability during peak seasons. Forecasting used scenario analysis supported by expert consensus on how quickly hiring centers, custom service models, and electrification pilots will scale, then converted into annual growth by equipment group. Where small-category totals were hard to observe, we used ratio-based allocation from verified category shares, and then re-validated the split through dealer and service-provider feedback.
Data Validation & Update Cycle
Outputs were validated through multiple checks, including cross-comparing the implied equipment volume with production and trade signals, and reviewing whether ASP movement matched observed inflation and product mix changes. Any sharp year-to-year jumps were flagged, re-checked against policy timing and crop-year conditions, and then reviewed again before sign-off.
Reports are refreshed annually, and interim updates are made when material events occur, such as a major subsidy redesign or a sharp financing shift. Before delivery, a final pass is completed so the latest public releases and confirmed expert feedback are reflected in the numbers clients receive.
Mordor Intelligence's India Agricultural Machinery Market Size Compared Against Other Published Estimates
Published market sizes for India agricultural machinery can differ even when the topic label looks identical, because the counted equipment set, the year used for pricing, and the treatment of hiring and services are not consistent across sources. We keep the comparisons simple by lining up the stated year and currency first, then checking what is actually included in the market bucket.
Custom hiring service revenue is kept outside Mordor Intelligence's scope, which can pull down totals versus estimates that bundle machinery sales together with equipment rental and service charges. Gaps also come from how ASPs are moved forward, since some sources apply a single inflation factor, while our model adjusts by equipment mix and financing-led discounting, then checks the result against sales and trade signals.
Benchmark comparison
| Source | Market Size | Gaps in Research Methodology |
|---|---|---|
| Mordor Intelligence | USD 18.15 B (2025) | |
| Industry Data Publisher A | USD 14.20 B (2024) | The estimate is presented for an earlier year, and it appears to lean more on broad equipment group averages, which can miss price and mix changes that happened in the following cycle. |
| Global Publisher B | USD 19.06 B (2025) | The total is close, but category inclusions and the way regional demand is rolled up are not clearly explained, which makes it harder to replicate splits and validate with independent volume signals. |
The spread in the table mainly traces back to what is counted in the market bucket and how pricing is updated year to year. By keeping inclusions explicit and tying growth to observable demand indicators like unit sales, subsidy timing, and financing sensitivity, the final number stays easier to audit and repeat when new data points arrive.


Key Questions Answered in the Report
What is the value of the India Agricultural Machinery Market in 2026?
The market stands at USD 19.65 billion in 2026 and is forecast to reach USD 29.27 billion by 2031.
How fast is tractor electrification progressing in India?
Pilot programs show electric tractors can cut operating costs by 18%, and dedicated subsidies under PM E-DRIVE are accelerating commercialization.
Which segment is expanding the fastest?
Irrigation machinery leads with a 10.18% CAGR through 2031 as water-efficient technologies gain traction.
Why are custom-hiring centers important?
They pool capital-intensive machinery so smallholders can rent equipment during peak periods, boosting productivity without heavy upfront investment.
Page last updated on:


 Your data is secure and never sold or shared.


