Hyperphosphatemia Drugs Market Size and Share
Market Overview
| Study Period | 2020 - 2031 |
|---|---|
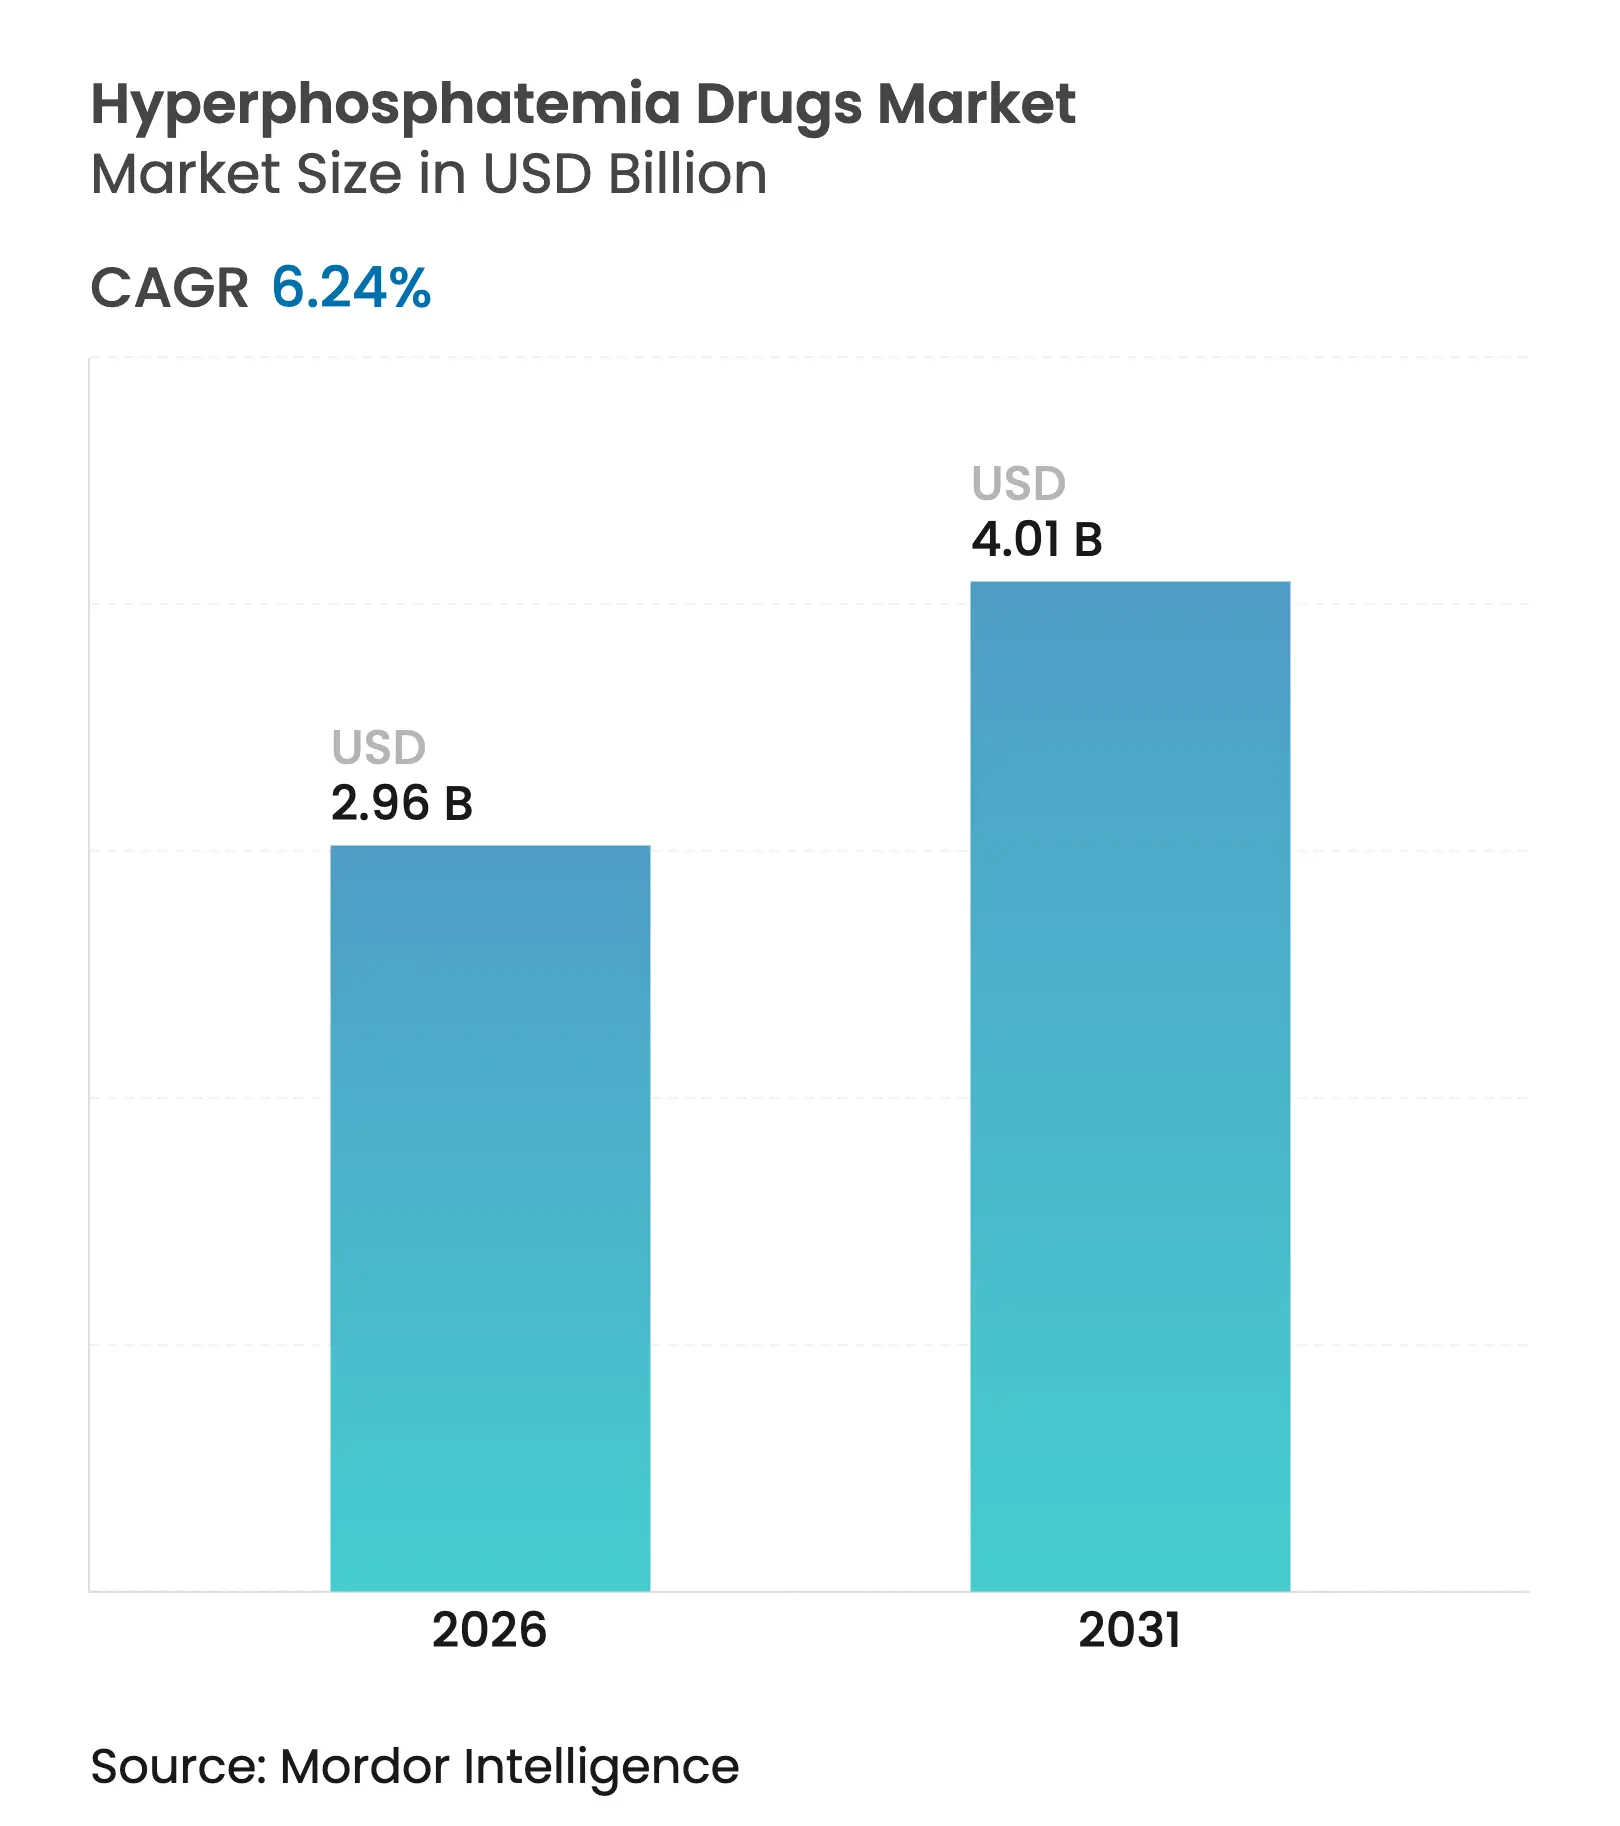
| Market Size (2026) | USD 2.96 Billion |
| Market Size (2031) | USD 4.01 Billion |
| Growth Rate (2026 - 2031) | 6.24 % CAGR |
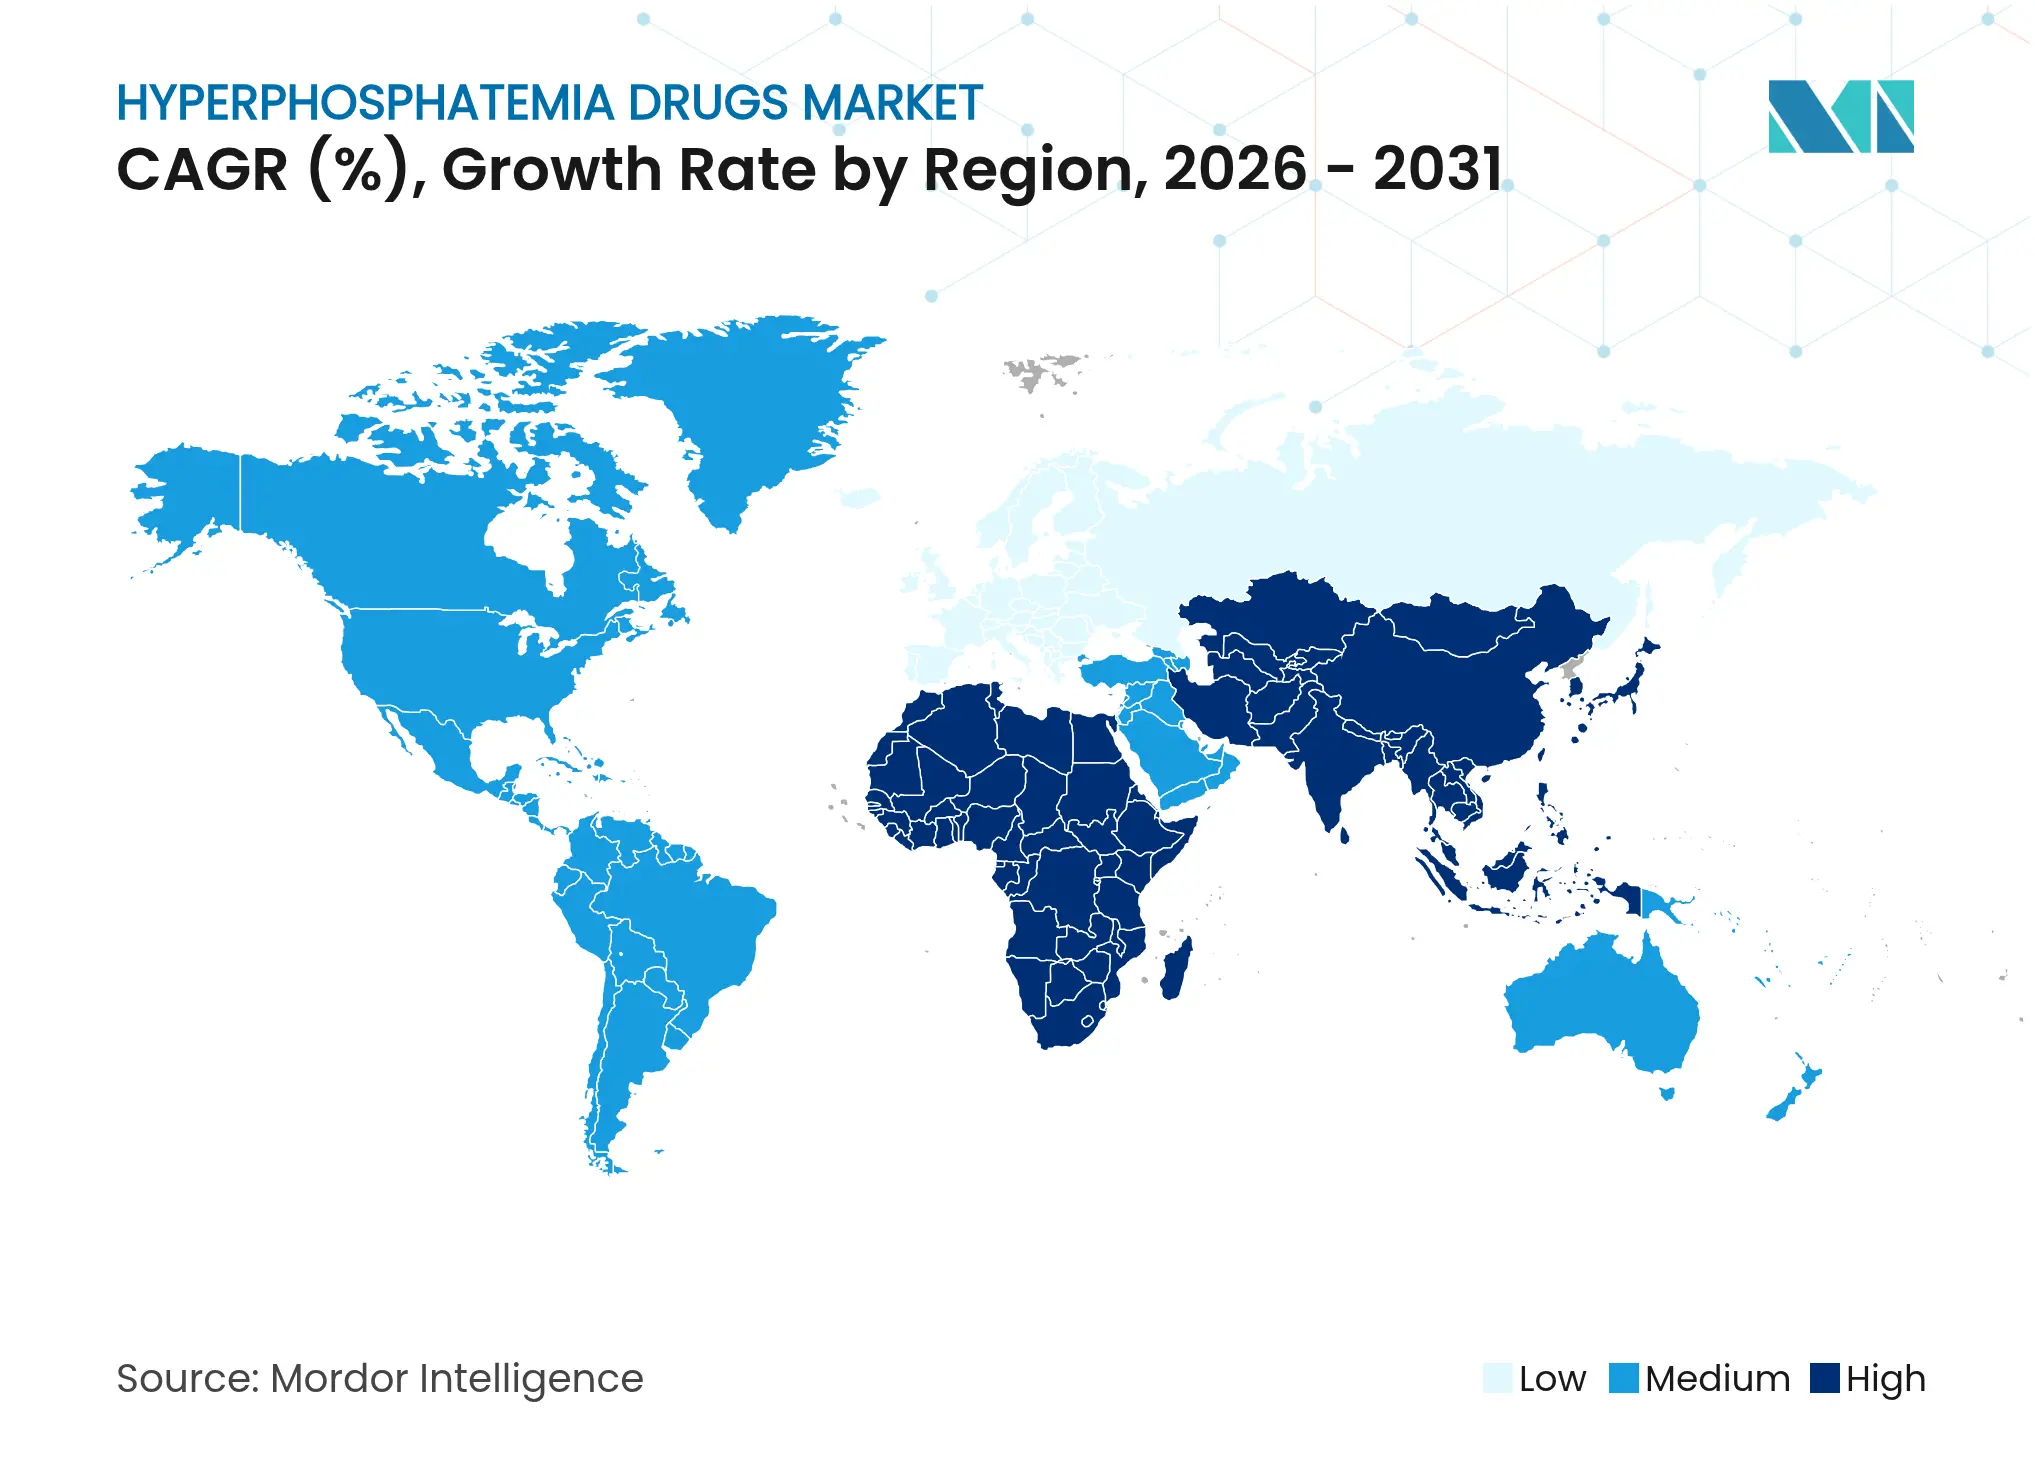
| Fastest Growing Market | Asia-Pacific |
| Largest Market | North America |
| Market Concentration | Medium |
Major Players *Disclaimer: Major Players sorted in no particular order. Image © Mordor Intelligence. Reuse requires attribution under CC BY 4.0. |
Hyperphosphatemia Drugs Market Analysis by Mordor Intelligence
The hyperphosphatemia drugs market size in 2026 is estimated at USD 2.96 billion, growing from 2025 value of USD 2.79 billion with 2031 projections showing USD 4.01 billion, growing at 6.24% CAGR over 2026-2031. Treatment protocols are at a crossroads as sodium-hydrogen exchanger 3 (NHE3) inhibitors move beyond niche use to challenge traditional calcium-based binders that have dominated care for decades. Growth stems mainly from a rising end-stage renal disease population, favorable policy shifts, and the commercial traction of novel absorption blockers that lessen pill burden for the roughly 550,000 U.S. dialysis patients who struggle to stay below the 5.5 mg/dL phosphorus threshold.[1]Centers for Medicare & Medicaid Services, “Calendar Year 2025 End-Stage Renal Disease (ESRD) Prospective Payment System Final Rule,” cms.gov
Key Report Takeaways
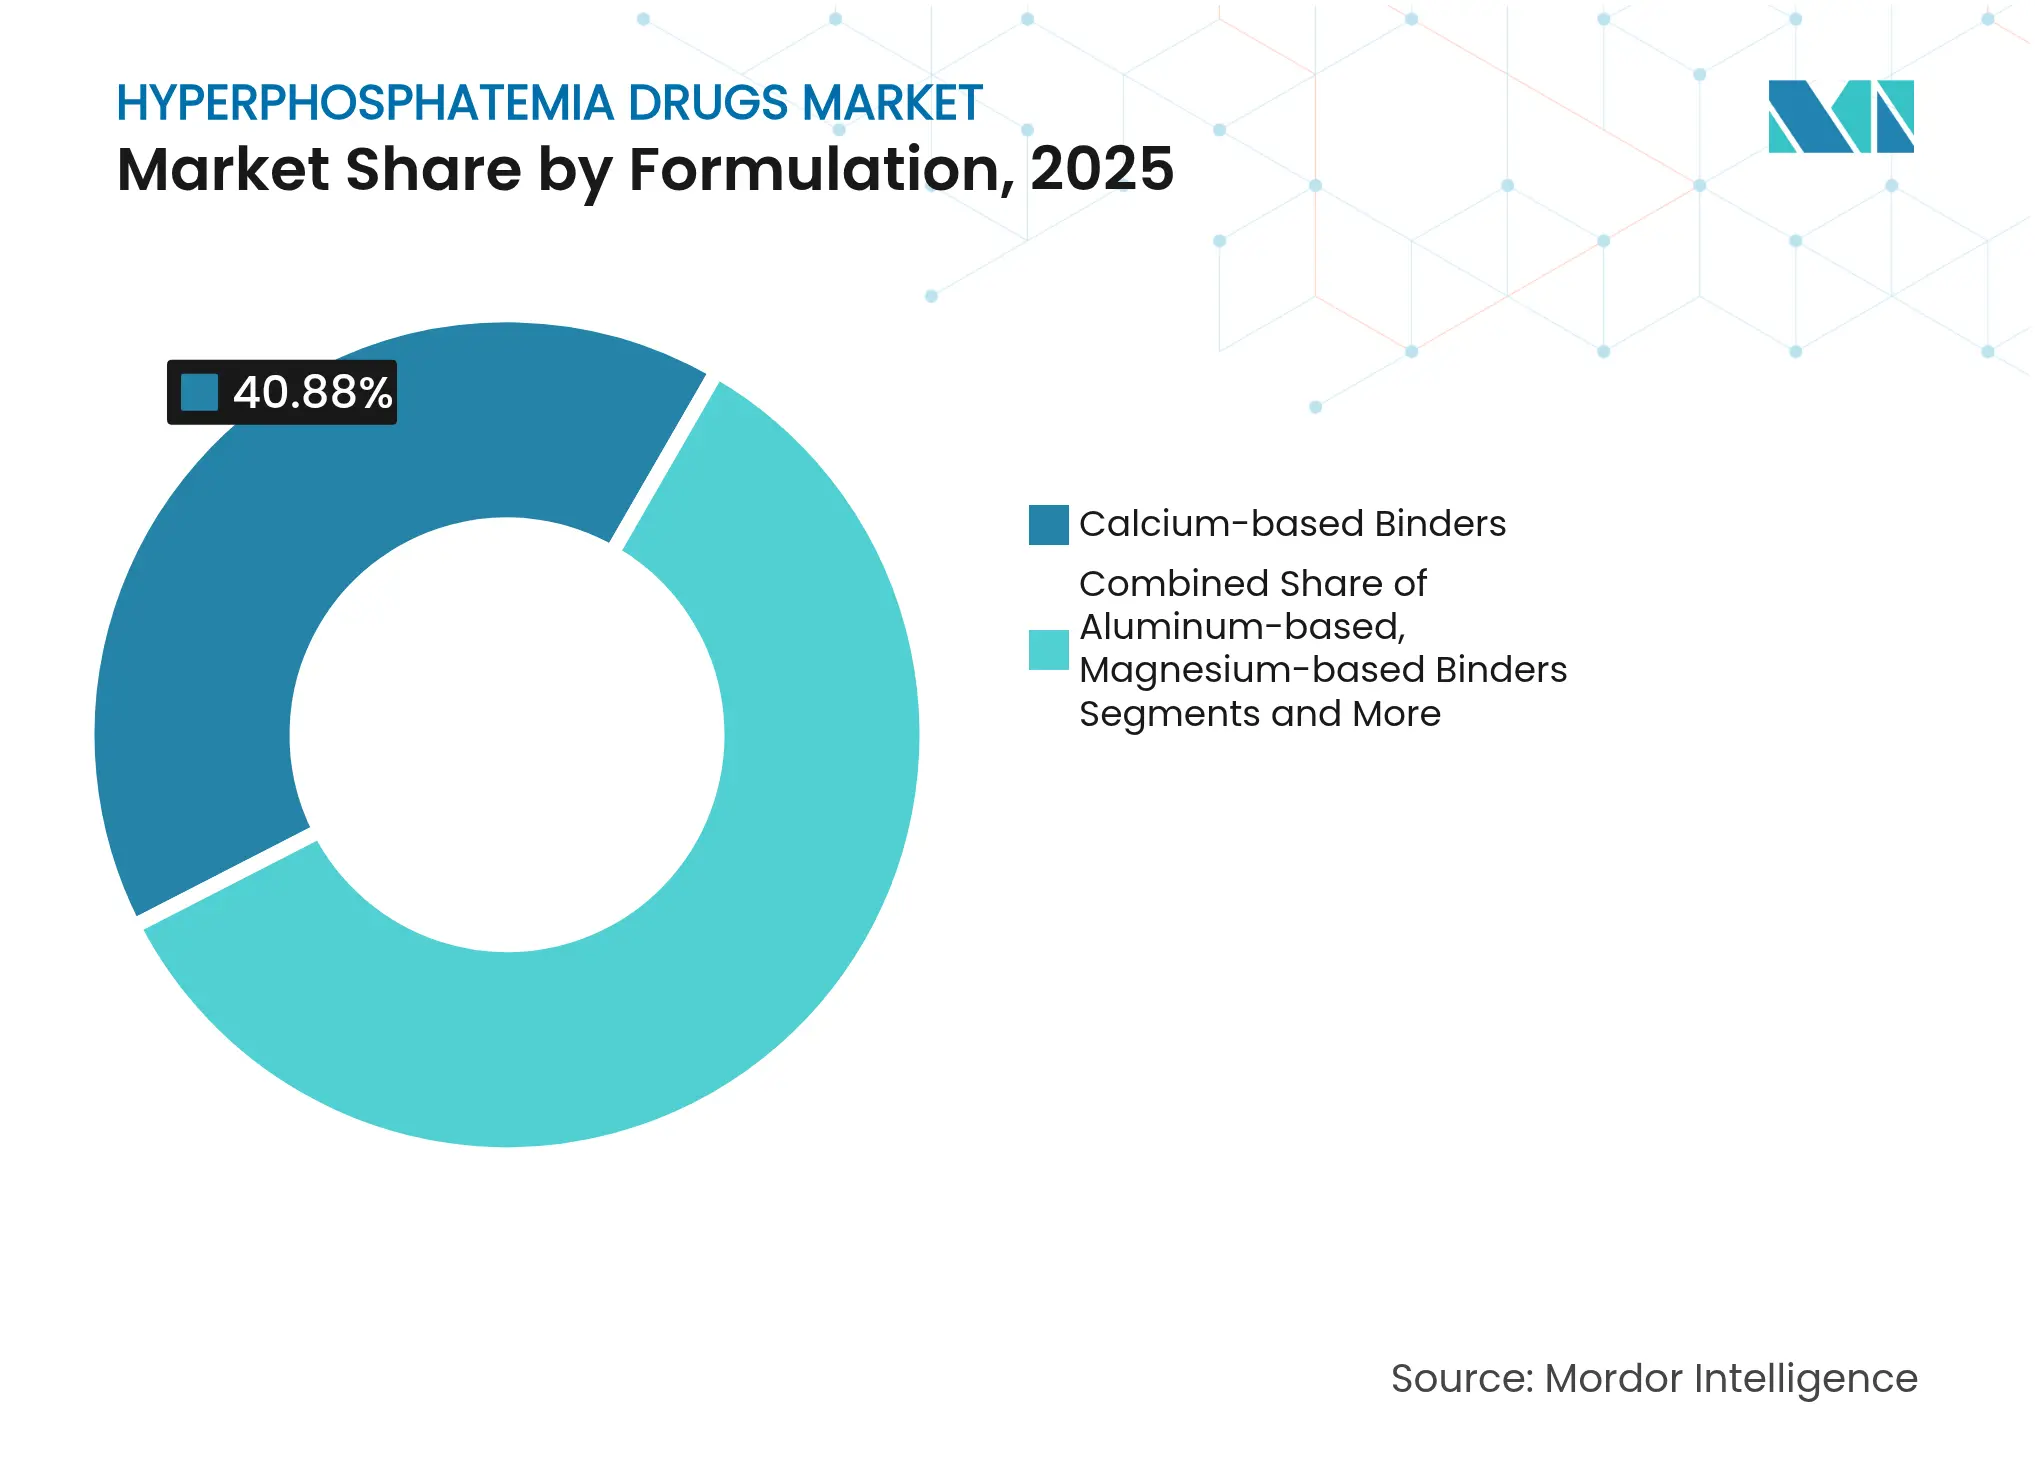
- By formulation, calcium-based binders led with 40.88% of hyperphosphatemia drugs market share in 2025, while NHE3 inhibitors are forecast to grow at an 8.66% CAGR to 2031.
- By dosage form, tablets accounted for 50.74% of the hyperphosphatemia drugs market size in 2025, whereas chewable tablets are on track for a 9.40% CAGR through 2031.
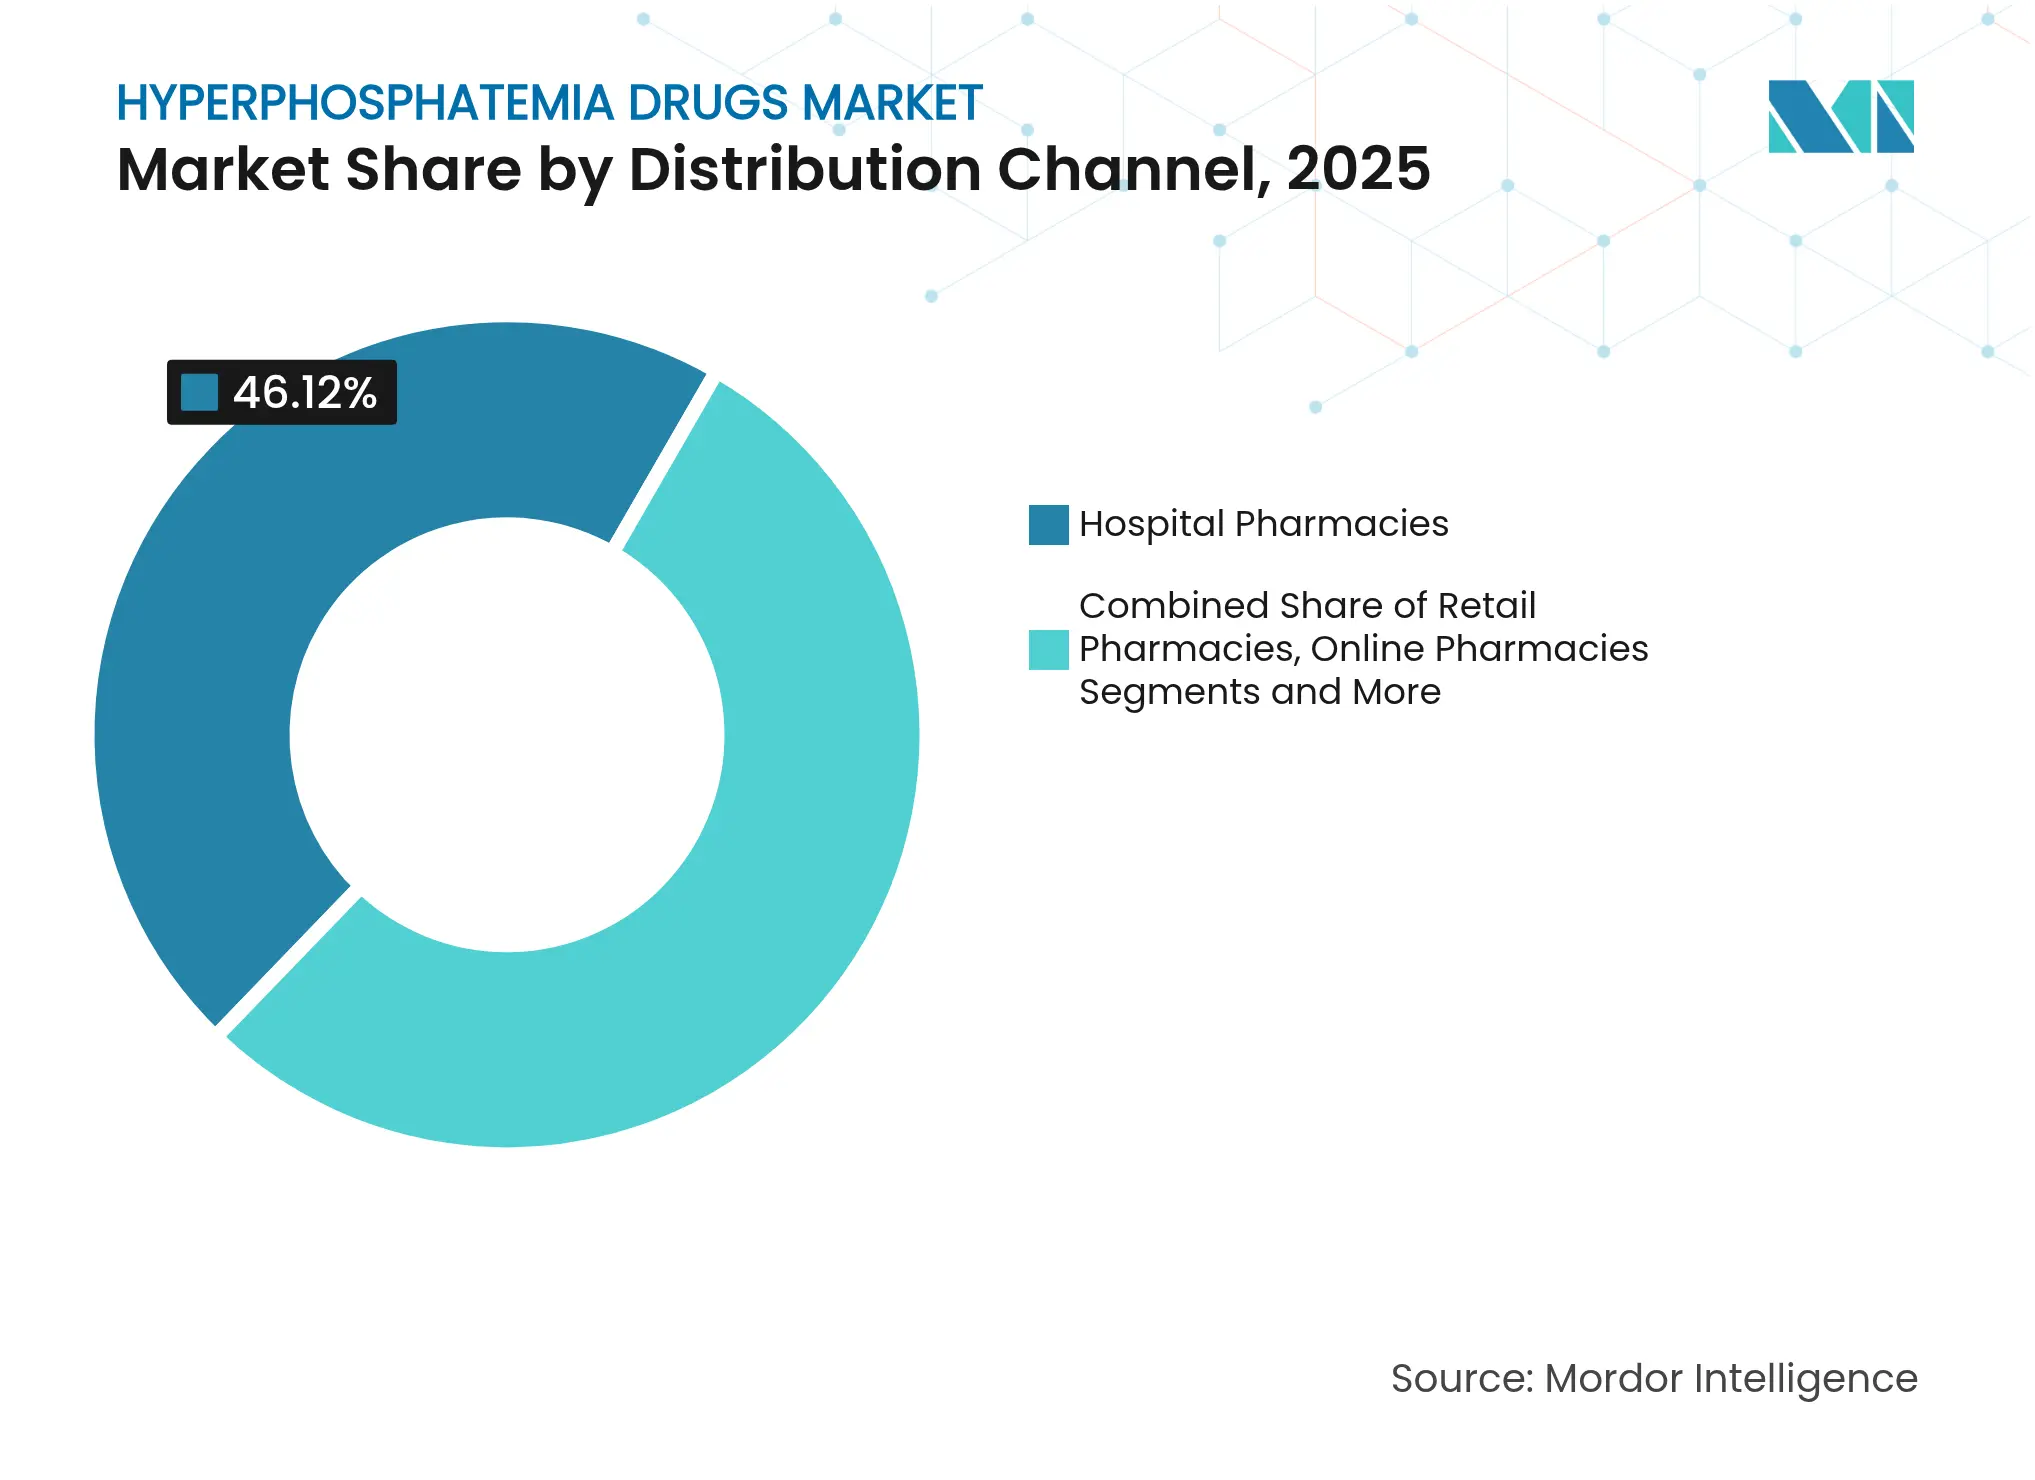
- By distribution channel, hospital pharmacies captured 46.12% revenue share in 2025; online pharmacies record the highest projected CAGR at 9.97% through 2031.
- By patient population, CKD on dialysis represented 67.89% of the hyperphosphatemia drugs market size in 2025, while CKD not on dialysis is expanding at a 9.46% CAGR to 2031.
Note: Market size and forecast figures in this report are generated using Mordor Intelligence's proprietary estimation framework, updated with the latest available data and insights as of 2026.
Global Hyperphosphatemia Drugs Market Trends and Insights
Drivers Impact Analysis
| Driver | (~) % Impact on CAGR Forecast | Geographic Relevance | Impact Timeline | |||
|---|---|---|---|---|---|---|
Surge In End-Stage Kidney-Disease
Prevalence
Surge In End-Stage Kidney-Disease
Prevalence
| +1.8% | Global, with highest impact in North America and Asia Pacific | Long term (≥ 4 years) | (~) % Impact on CAGR Forecast:+1.8% |
Geographic Relevance
:
Global, with highest impact in North
America and Asia Pacific
|
Impact Timeline
:
Long term (≥ 4 years)
|
Regulatory Approvals Of Next-Gen
Iron-Based Binders
Regulatory Approvals Of Next-Gen
Iron-Based Binders
| +1.2% | North America & EU, expanding to APAC | Medium term (2-4 years) | |||
Favorable Reimbursement Under ESRD
Bundle
Favorable Reimbursement Under ESRD
Bundle
| +1.0% | North America, with spillover to developed markets | Short term (≤ 2 years) | |||
Launch Of NHE3 Inhibitor Lowering
Pill Burden
Launch Of NHE3 Inhibitor Lowering
Pill Burden
| +0.9% | Global, with early adoption in North America | Medium term (2-4 years) | |||
Ferric-Citrate Dual Anemia Benefit
Ferric-Citrate Dual Anemia Benefit
| +0.7% | Global, particularly in markets with high anemia prevalence | Medium term (2-4 years) | |||
AI-Enabled Adherence Packaging
AI-Enabled Adherence Packaging
| +0.6% | Developed markets initially, expanding globally | Long term (≥ 4 years) | |||
| Source: Mordor Intelligence | ||||||
Surge in End-Stage Kidney-Disease Prevalence
End-stage renal disease cases continue to mount, pushing demand for advanced phosphate control therapies. Global chronic kidney disease mortality is projected to reach 1,812,850 deaths by 2030, underscoring the urgency for better mineral metabolism management. Survival falls sharply when serum phosphorus remains uncontrolled; five-year survival drops to 18% among hemodialysis patients with persistent mineral disorders. China faces added strain where chronic kidney disease affects 13.4% of the population and drives treatment costs of USD 23,358 per renal-replacement patient annually.
Regulatory Approvals of Next-Gen Iron-Based Binders
Iron-based binders such as ferric citrate and sucroferric oxyhydroxide are gaining ground because they simultaneously lower phosphorus and correct iron deficiency. Meta-analysis of 1,281 patients shows ferric citrate’s superiority over older agents.[2]Xueying Ding et al., “Ferric citrate for the treatment of hyperphosphatemia and iron deficiency anaemia in patients with NDD-CKD,” Frontiers in Pharmacology, frontiersin.orgRegulators favor these dual-action formulations, which explains the July 2024 pediatric label expansion for sucroferric oxyhydroxide.
Favorable Reimbursement Under ESRD Bundle
Medicare’s January 2025 rule folds phosphate binders into the ESRD Prospective Payment System, adding a USD 36.41 transitional drug adjustment and removing Part D hurdles. Facilities can now prescribe the most clinically effective option rather than the cheapest generic binder.
Launch of NHE3 Inhibitor Lowering Pill Burden
The October 2023 U.S. approval of tenapanor created the first-in-class NHE3 inhibitor, cutting average daily tablets from six to three without sacrificing efficacy. Tenapanor generated USD 161 million in 2024 sales, validating commercial appetite for new mechanisms.
Restraints Impact Analysis
| Restraint | (~) % Impact on CAGR Forecast | Geographic Relevance | Impact Timeline | |||
|---|---|---|---|---|---|---|
GI Side-Effects Driving Non-Adherence
GI Side-Effects Driving Non-Adherence
| -1.1% | Global, with higher impact in markets with limited treatment options | Medium term (2-4 years) | (~) % Impact on CAGR Forecast:
-1.1%
|
Geographic Relevance
:
Global, with higher impact in
markets with limited treatment options
|
Impact Timeline
:
Medium term (2-4 years)
|
High Therapy Cost Vs Calcium Salts
High Therapy Cost Vs Calcium Salts
| -0.8% | Emerging markets and cost-sensitive healthcare systems | Short term (≤ 2 years) | |||
Shift To High-Flux Dialysis
Membranes
Shift To High-Flux Dialysis
Membranes
| -0.6% | Developed markets with advanced dialysis infrastructure | Long term (≥ 4 years) | |||
Medicare Payment Caps On Novel
Agents
Medicare Payment Caps On Novel
Agents
| -0.5% | North America, with potential spillover to other regulated markets | Medium term (2-4 years) | |||
| Source: Mordor Intelligence | ||||||
GI Side-Effects Driving Non-Adherence
Diarrhea with tenapanor reaches 53%, causing 30.9% discontinuation despite efficacy gains.[3]Masahiro Okamura et al., “Efficacy of tenapanor hydrochloride for hyperphosphatemia in hemodialysis patients,” Renal Replacement Therapy, biomedcentral.comCalcium binders cause constipation and iron binders irritate the gut, placing tolerance at odds with control. Interventions such as early loperamide use help but do not eliminate the problem.
High Therapy Cost vs Calcium Salts
Advanced binders cost far more than generic calcium salts. Dialysis centers in cash-strapped systems often default to cheaper calcium despite long-term cardiovascular risks, especially in emerging economies where reimbursement remains fragmented.
Segment Analysis
By Formulation: NHE3 Inhibitors Disrupt Traditional Binding Paradigms
Calcium-based binders still hold 40.88% hyperphosphatemia drugs market share in 2025, but their dominance erodes as safety concerns about vascular calcification grow. NHE3 inhibitors post the fastest 8.66% CAGR, anchored by tenapanor’s USD 161 million launch year, signalling a profound shift in preference. Iron-based binders ride combined phosphate-and-anemia benefits, while lanthanum- and polymer-based options fill patient-specific gaps. Magnesium and aluminum agents retreat due to toxicity fears, and pipeline products such as oxylanthanum carbonate aim to cut pill volume further.
Emerging alliances, notably Ardelyx’s USD 198 million NaP2b licensing deal with Sanofi, underscore strategic clustering around absorption-block techniques. Formulations that address multiple CKD comorbidities now enjoy preferred status within hospital protocols and payer evaluations, propelling the hyperphosphatemia drugs market toward mechanism diversity.
Note: Segment shares of all individual segments available upon report purchase
By Dosage Form: Chewable Innovation Drives Adherence Solutions
Tablets dominate with a 50.74% slice of the hyperphosphatemia drugs market in 2025, yet chewable options expand at 9.40% CAGR as manufacturers prioritize patient comfort. Studies reveal 79% of participants prefer the smaller oxylanthanum carbonate tablet relative to earlier binders, affirming that pill size and texture influence daily compliance.
Powder and suspension forms retain utility for dysphagic or pediatric cases, whereas capsule and syrup alternatives serve niche cohorts. Orphan-designated pediatric syrup formulations of tenapanor widen therapeutic reach, aligning with broader trends toward age-specific dosing. Adherence-oriented formats therefore play a central role in sustaining hyperphosphatemia drugs market growth.
By Distribution Channel: Digital Transformation Accelerates Online Growth
Hospital pharmacies secured 46.12% of 2025 revenues, reflecting their gatekeeper role during dialysis initiation, but online pharmacies are on a 9.97% CAGR trajectory. Medicare’s reimbursement overhaul funnels novel agents through integrated e-prescribing systems, accelerating virtual fill rates. Retail outlets stay relevant through convenience, and dialysis-center dispensing retains importance where same-day dose titration is needed.
AI-enabled platforms add personalized dosing reminders, driving prescription persistence. As digital ecosystems mature, omnichannel logistics become integral to capturing regional demand pockets, reinforcing competitive positioning across the hyperphosphatemia drugs market.
Note: Segment shares of all individual segments available upon report purchase
By Patient Population: Non-Dialysis Expansion Signals Market Broadening
CKD on dialysis patients accounted for 67.89% of the hyperphosphatemia drugs market size in 2025. However, CKD not on dialysis posts a robust 9.46% CAGR as clinicians deploy binders earlier in disease progression to mitigate cardiovascular damage. Hyperphosphatemia prevalence climbs from 2.6% in stage 3a CKD to 27.1% in stage 5, validating earlier intervention.
Tumor-induced osteomalacia remains tiny yet clinically significant, sustaining research into targeted phosphate modulators. Broader patient segmentation emphasises prevention, ensuring long-run volume growth for the hyperphosphatemia drugs market.
Geography Analysis
North America holds 37.02% of 2025 sales thanks to advanced reimbursement and 550,000 dialysis patients requiring daily phosphorus control. Medicare’s USD 36.41 add-on neutralises previous cost barriers, enabling uptake of premium agents such as tenapanor, whose first-year sales hit USD 161 million. Asia Pacific delivers the fastest 8.44% CAGR, propelled by China’s 13.4% CKD prevalence and annual per-patient costs of USD 23,358, alongside Japan’s world-leading dialysis outcomes and recent approval of PHOZEVEL (tenapanor). India’s kidney-care roadmap stresses early detection and technological integration, widening therapeutic access. Europe benefits from harmonised guidelines and mature reimbursement pathways. Germany, the United Kingdom, France, Italy, and Spain anchor demand while Eastern Europe opens gradually. South America, especially Brazil, registers steady uptake amid funding constraints, and Middle East–Africa markets grow around GCC modernisation and South African dialysis programs. Localised access strategies therefore underpin global expansion of the hyperphosphatemia drugs market.

Competitive Landscape
Market Concentration
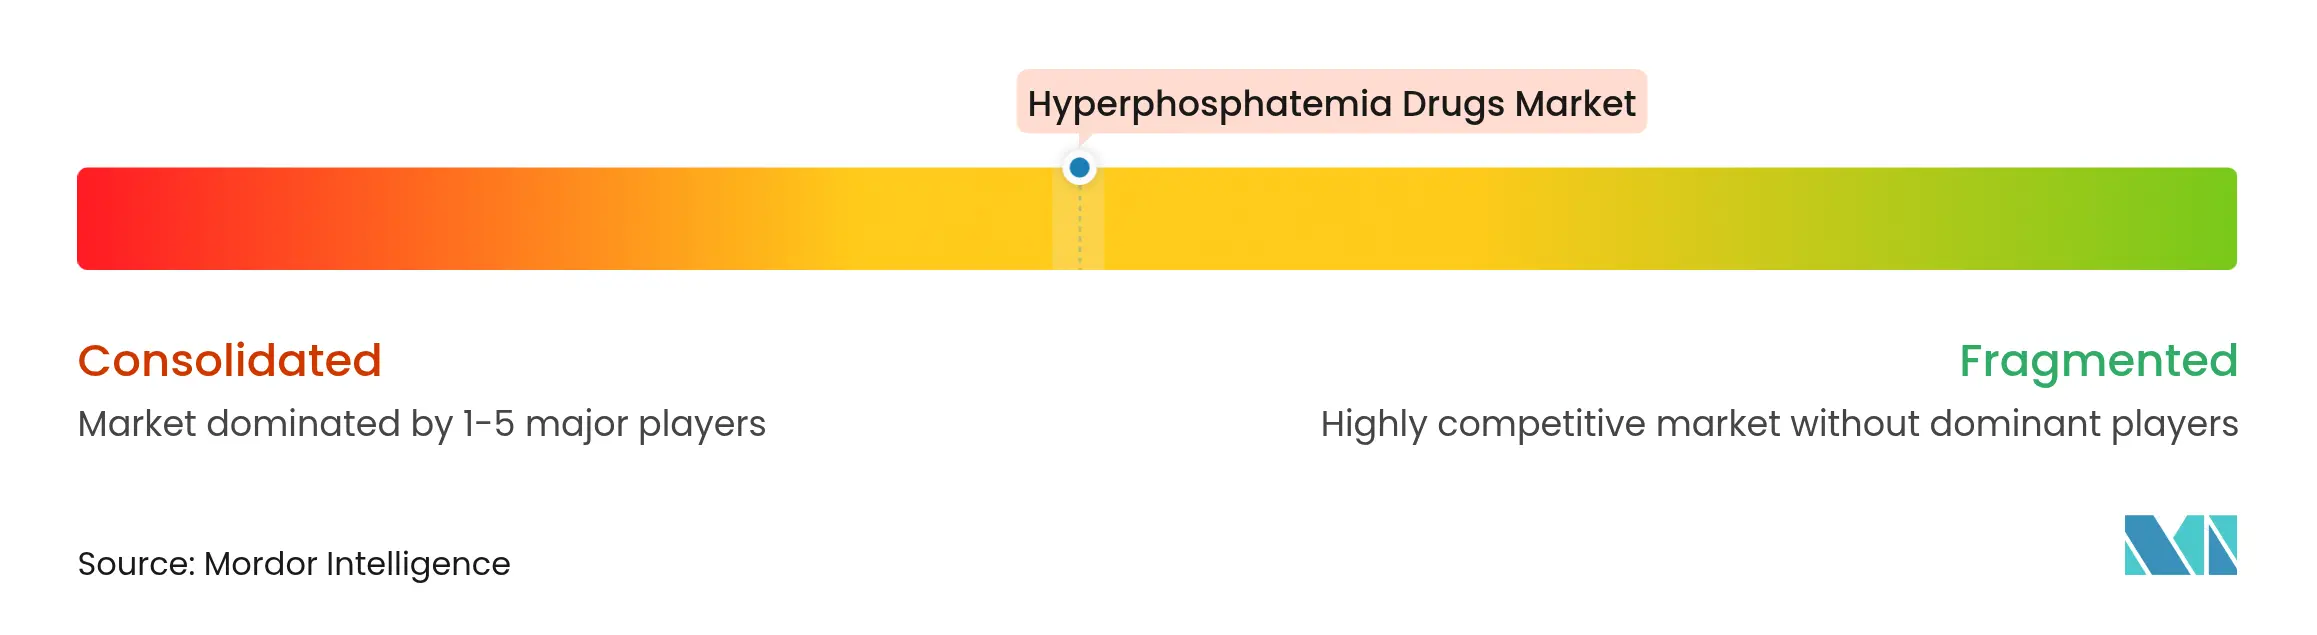
Competition is moderately fragmented. Legacy brands from Vifor, Sanofi, and Fresenius defend share through broad binder portfolios, yet disruptors such as Ardelyx redefine therapy with absorption blockers. Strategic moves include Ardelyx’s USD 198 million Sanofi deal and CSL’s focus on vascular-calcification assets after acquiring Vifor, indicating consolidation around next-generation technologies.
AI adherence tools and digital platforms emerge as differentiators rather than simple product attributes. Oxylanthanum carbonate continues development following an FDA complete-response letter, hinting at further pipeline churn. Pediatric designations, combination therapies, and value-based contracts provide fresh white-space opportunities, keeping the hyperphosphatemia drugs market dynamic and innovation-led.
Hyperphosphatemia Drugs Industry Leaders

*Disclaimer: Major Players sorted in no particular order
Recent Industry Developments
- June 2025: Alebund Pharmaceuticals locked its phase 3 database for AP301, an oral iron-based binder that met primary endpoints in dialysis patients.
- February 2025: China’s National Medical Products Administration approved tenapanor for dialysis patients unresponsive to traditional binders.
- July 2024: FDA expanded Velphoro’s label to include pediatric patients aged 9 years and older with CKD on dialysis.
Table of Contents for Hyperphosphatemia Drugs Industry Report
1. Introduction
- 1.1Study Assumptions and Market Definition
- 1.2Scope of the Study
2. Research Methodology
3. Executive Summary
4. Market Landscape
- 4.1Market Overview
- 4.2Market Drivers
- 4.2.1Surge In End-Stage Kidney-Disease Prevalence
- 4.2.2Regulatory Approvals Of Next-Gen Iron-Based Binders
- 4.2.3Favorable Reimbursement Under ESRD Bundle
- 4.2.4Launch Of NHE3 Inhibitor Lowering Pill Burden
- 4.2.5Ferric-Citrate Dual Anemia Benefit
- 4.2.6AI-Enabled Adherence Packaging
- 4.3Market Restraints
- 4.3.1GI Side-Effects Driving Non-Adherence
- 4.3.2High Therapy Cost Vs Calcium Salts
- 4.3.3Shift To High-Flux Dialysis Membranes
- 4.3.4Medicare Payment Caps On Novel Agents
- 4.4Value / Supply-Chain Analysis
- 4.5Regulatory Landscape
- 4.6Technology Outlook
- 4.7Porter’s Five Forces Analysis
- 4.7.1Bargaining Power of Suppliers
- 4.7.2Bargaining Power of Buyers
- 4.7.3Threat of New Entrants
- 4.7.4Threat of Substitutes
- 4.7.5Intensity of Competitive Rivalry
5. Market Size and Growth Forecasts (Value-USD)
- 5.1By Formulation
- 5.1.1Calcium-based Binders
- 5.1.2Aluminum-based Binders
- 5.1.3Magnesium-based Binders
- 5.1.4Polymer-based
- 5.1.5Lanthanum-based Binders
- 5.1.6Iron-based Binders
- 5.1.7NHE3 Inhibitors
- 5.1.8Others
- 5.2By Dosage Form
- 5.2.1Tablets
- 5.2.2Chewable Tablets
- 5.2.3Powders / Suspensions
- 5.2.4Capsules
- 5.2.5Syrups
- 5.3By Distribution Channel
- 5.3.1Hospital Pharmacies
- 5.3.2Retail Pharmacies
- 5.3.3Online Pharmacies
- 5.3.4Dialysis Center Dispensing
- 5.4By Patient Population
- 5.4.1CKD on Dialysis
- 5.4.2CKD not on Dialysis
- 5.4.3Tumor-Induced Osteomalacia
- 5.5By Geography
- 5.5.1North America
- 5.5.1.1United States
- 5.5.1.2Canada
- 5.5.1.3Mexico
- 5.5.2Europe
- 5.5.2.1Germany
- 5.5.2.2United Kingdom
- 5.5.2.3France
- 5.5.2.4Italy
- 5.5.2.5Spain
- 5.5.2.6Rest of Europe
- 5.5.3Asia-Pacific
- 5.5.3.1China
- 5.5.3.2Japan
- 5.5.3.3India
- 5.5.3.4Australia
- 5.5.3.5South Korea
- 5.5.3.6Rest of Asia-Pacific
- 5.5.4Middle East and Africa
- 5.5.4.1GCC
- 5.5.4.2South Africa
- 5.5.4.3Rest of Middle East and Africa
- 5.5.5South America
- 5.5.5.1Brazil
- 5.5.5.2Argentina
- 5.5.5.3Rest of South America
6. Competitive Landscape
- 6.1Market Concentration
- 6.2Market Share Analysis
- 6.3Company profiles (includes Global level Overview, Market level overview, Core Segments, Financials as available, Strategic Information, Market Rank/Share for key companies, Products and Services, and Recent Developments)
- 6.3.1Sanofi SA
- 6.3.2Fresenius Kabi
- 6.3.3Vifor Pharma Group
- 6.3.4Takeda Pharmaceutical Co. Ltd.
- 6.3.5Ardelyx Inc.
- 6.3.6Akebia Therapeutics Inc.
- 6.3.7Astellas Pharma Inc.
- 6.3.8Cipla Ltd.
- 6.3.9Taro Pharmaceutical Industries Ltd.
- 6.3.10Ultragenyx Pharmaceutical Inc.
- 6.3.11Amgen Inc.
- 6.3.12Dr. Reddy’s Laboratories
- 6.3.13Teva Pharmaceutical Industries Ltd.
- 6.3.14Sun Pharmaceutical Industries Ltd.
- 6.3.15Lupin Ltd.
- 6.3.16Hikma Pharmaceuticals PLC
- 6.3.17Zeria Pharmaceutical Co. Ltd.
- 6.3.18Keryx Biopharmaceuticals
- 6.3.19Univar Solutions
- 6.3.20AbbVie Inc.
7. Market Opportunities & Future Outlook
- 7.1White-space & Unmet-Need Assessment
Global Hyperphosphatemia Drugs Market Report Scope
As per the scope of the report, hyperphosphatemia refers to an elevated level of phosphate in the blood. Higher-than-normal levels can result from increased phosphate intake and decreased excretion of phosphate.
The hyperphosphatemia drug market is segmented by formulation, type, distribution channel, and geography. By formulation, the market is segmented as calcium-based phosphate binders, aluminum-based phosphate binders, magnesium-based phosphate binders, iron-based phosphate binders, and other phosphate binders. By type, the market is segmented into tablets, syrups, and capsules. By distribution channel, the market is segmented into hospital pharmacies and retail pharmacies. By geography, the market is segmented as North America, Europe, Asia-Pacific, Middle East and Africa, and South America. The report offers the value (USD) for the above segments.