Global Anti-hypertensive Drugs Market Size and Share
Market Overview
| Study Period | 2020 - 2031 |
|---|---|
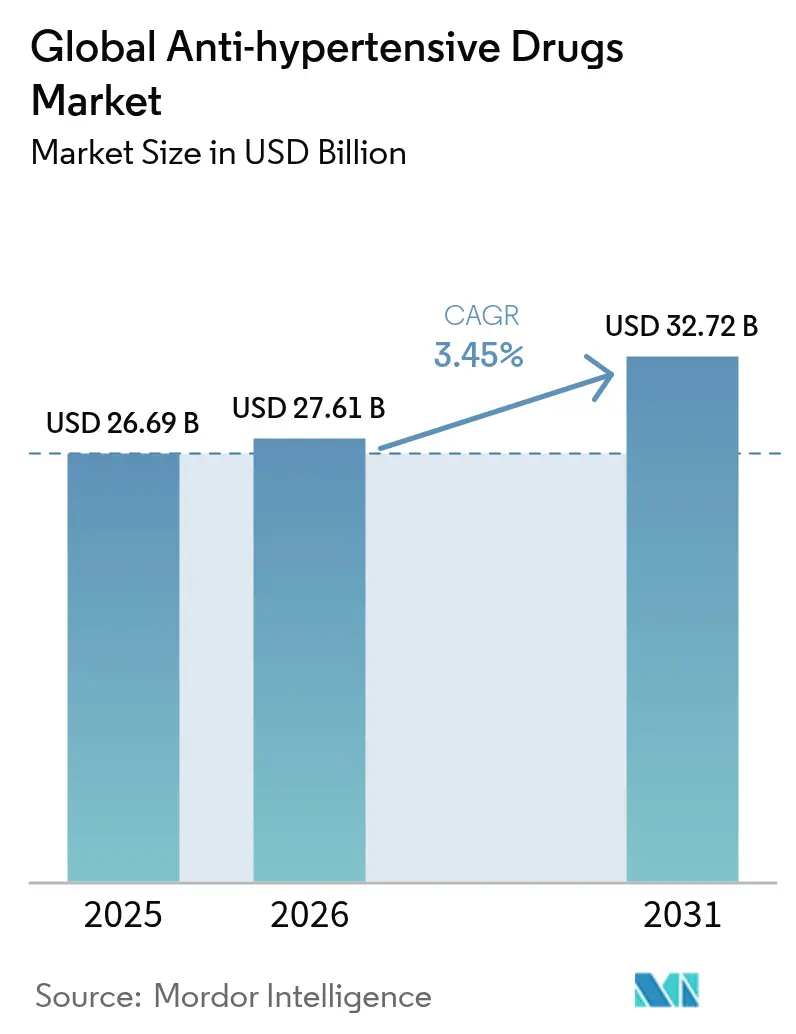
| Market Size (2026) | USD 27.61 Billion |
| Market Size (2031) | USD 32.72 Billion |
| Growth Rate (2026 - 2031) | 3.45% CAGR |
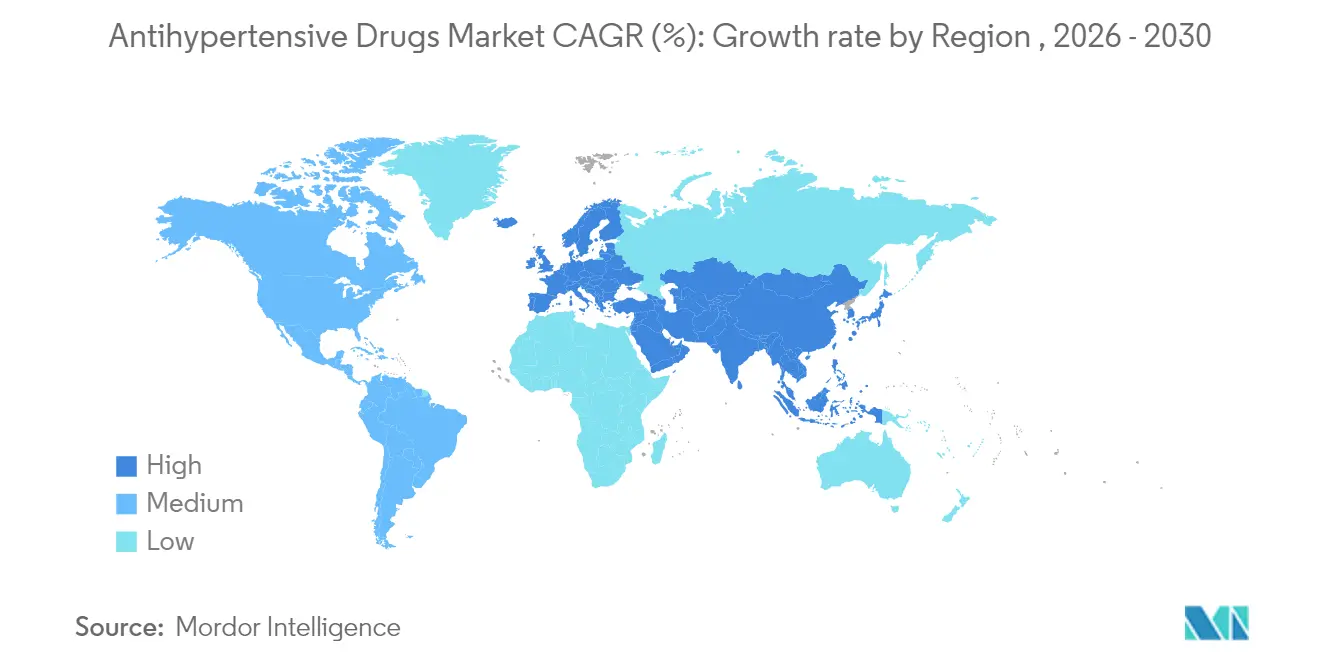
| Fastest Growing Market | Asia-Pacific |
| Largest Market | North America |
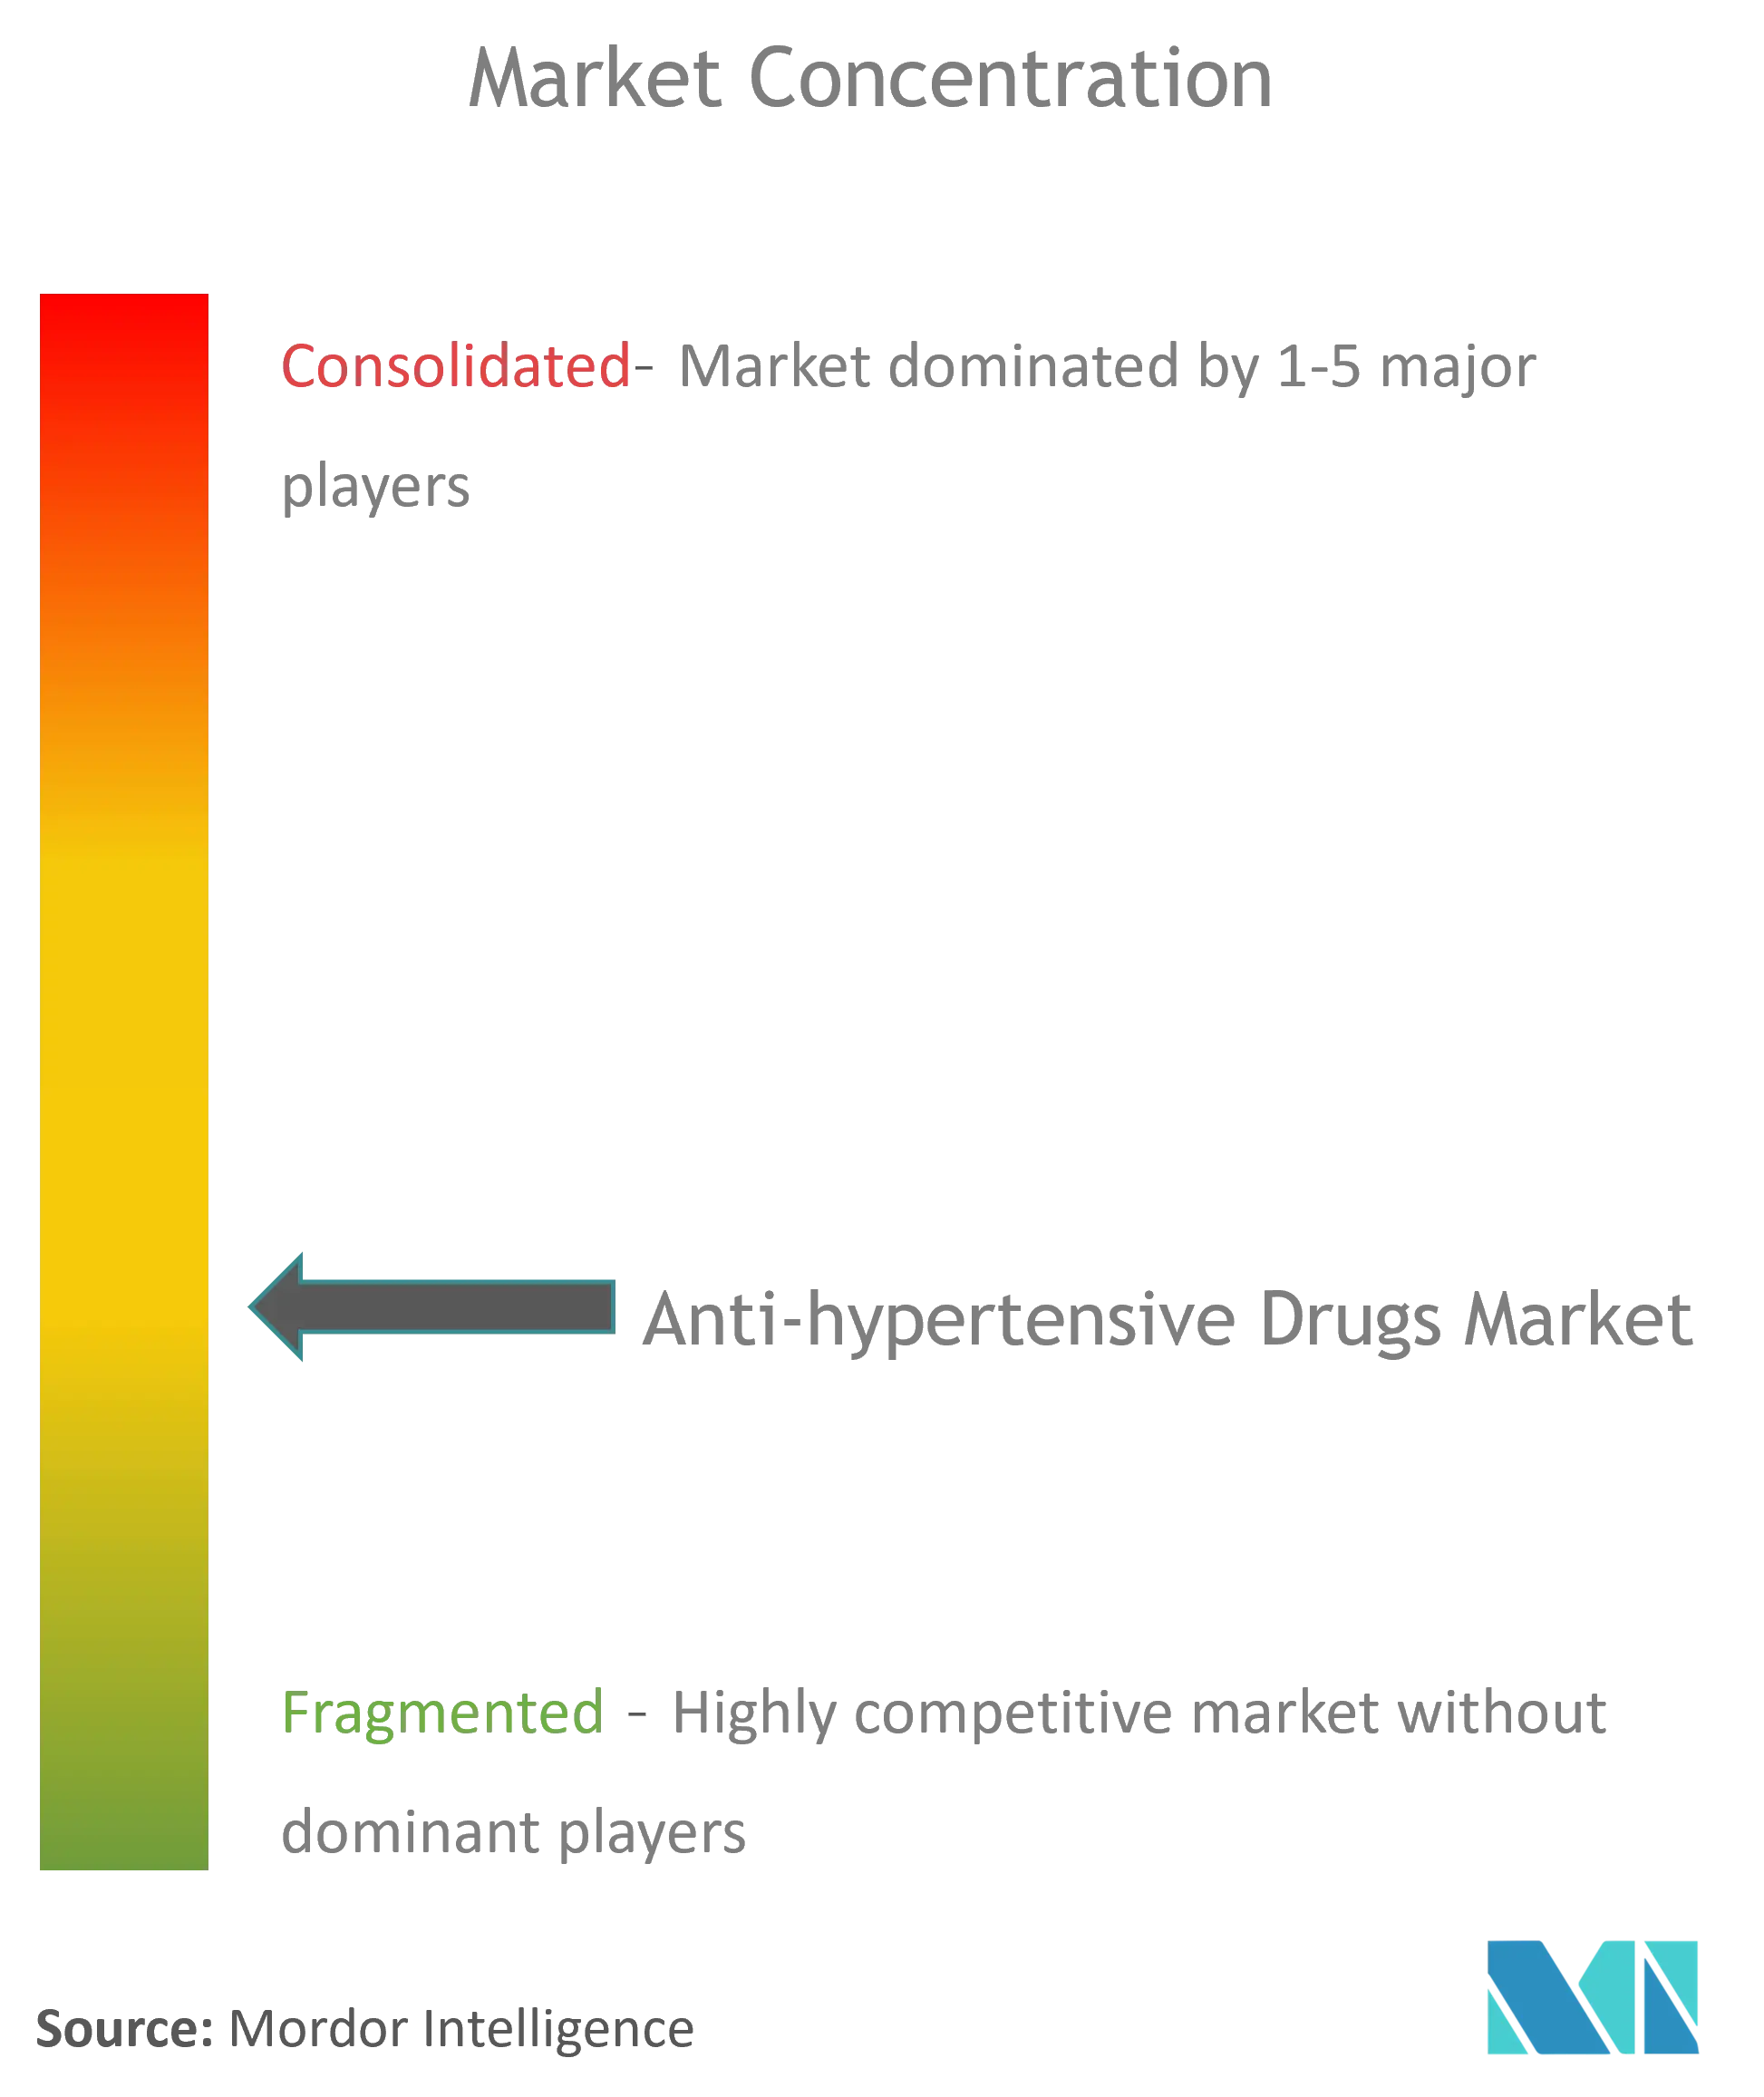
| Market Concentration | Low |
Major Players *Disclaimer: Major Players sorted in no particular order Image © Mordor Intelligence. Reuse requires attribution under CC BY 4.0. | |
Global Anti-hypertensive Drugs Market Analysis by Mordor Intelligence
The antihypertensive drugs market size in 2026 is estimated at USD 27.61 billion, growing from 2025 value of USD 26.69 billion with 2031 projections showing USD 32.72 billion, growing at 3.45% CAGR over 2026-2031. Uptake is anchored in escalating hypertension prevalence, an older global population, and steady innovation in fixed-dose combinations that improve adherence. Emerging long-acting injectable therapies and AI-enabled dose-titration platforms add fresh clinical value while generic competition tempers overall price growth. Asia-Pacific outpaces other regions on the back of rapid urbanization, salt-heavy diets, and widening health-insurance schemes. Meanwhile, North America sustains the largest revenue pool through early adoption of novel mechanisms, broad reimbursement, and entrenched cardiology care pathways. Throughout 2025–2030, companies with balanced portfolios of breakthrough assets and cost-competitive generics are positioned to capture incremental demand, even as patent cliffs squeeze margins for older brands.
Key Report Takeaways
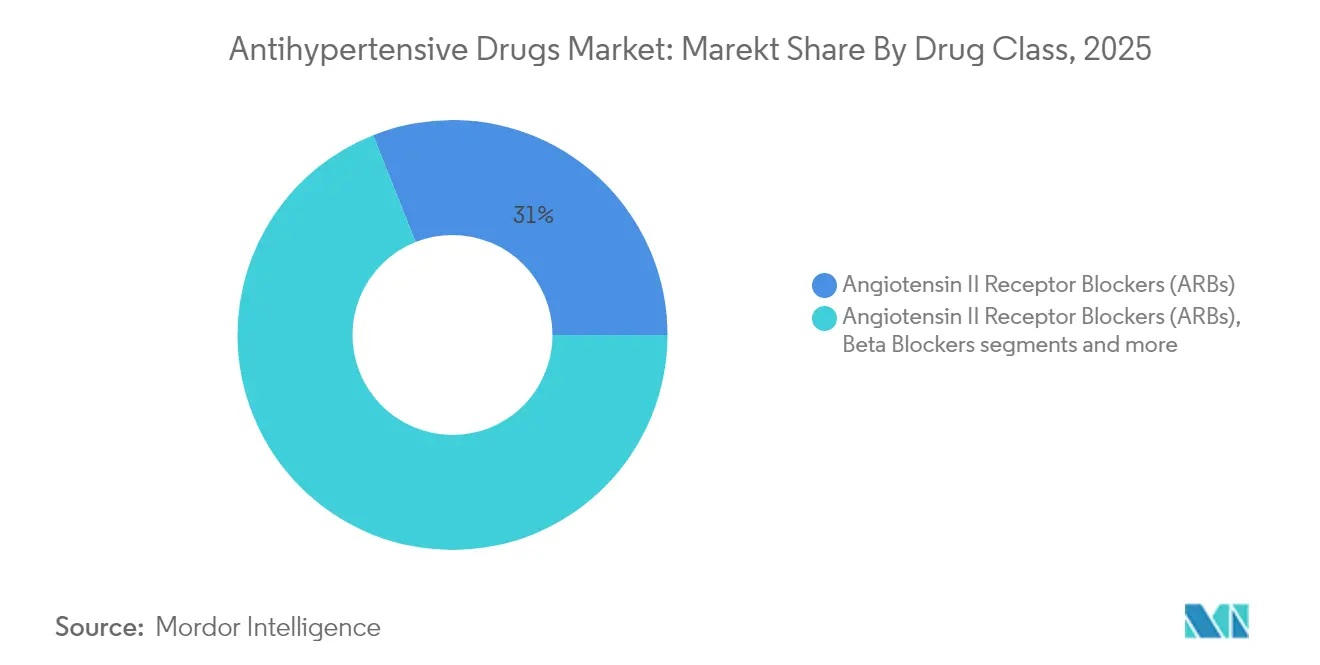
- By drug class, Angiotensin II Receptor Blockers led with 31.02% of antihypertensive drugs market share in 2025; Renin Inhibitors are projected to expand at a 4.12% CAGR to 2031.
- By route of administration, oral formulations accounted for 64.02% share of the antihypertensive drugs market size in 2025, whereas transdermal delivery is advancing at a 4.56% CAGR through 2031.
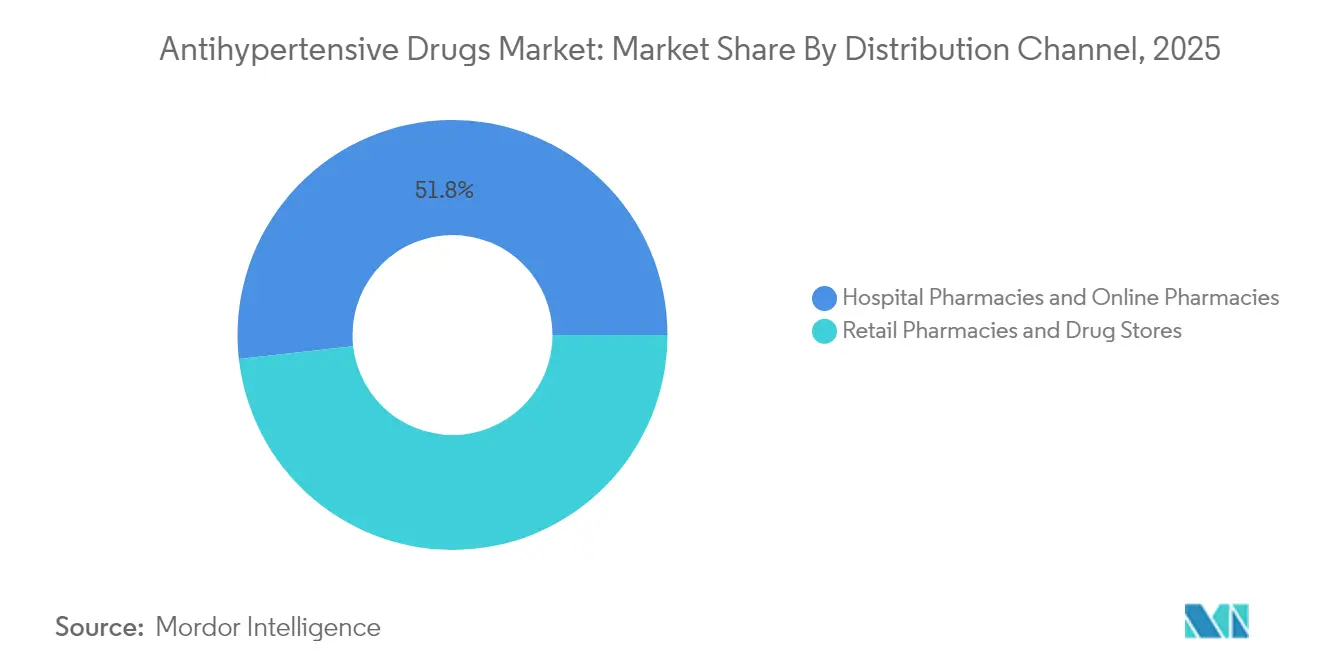
- By distribution channel, retail pharmacies held 48.22% revenue share in 2025; online pharmacies are forecast to post the highest CAGR at 5.03% between 2026–2031.
- By geography, North America captured 35.20% of the antihypertensive drugs market size in 2025, while Asia-Pacific is set to grow fastest at 5.52% CAGR through 2031.
Note: Market size and forecast figures in this report are generated using Mordor Intelligence’s proprietary estimation framework, updated with the latest available data and insights as of 2026.
Global Anti-hypertensive Drugs Market Trends and Insights
Drivers Impact Analysis*
| Driver | (~) % Impact on CAGR Forecast | Geographic Relevance | Impact Timeline |
|---|---|---|---|
| Accelerating prevalence of obesity and metabolic syndrome | +0.8% | Global, with highest impact in North America and Asia-Pacific | Medium term (2-4 years) |
| Growth of fixed-dose combination (FDC) therapies | +0.6% | Global, particularly Europe and North America | Short term (≤ 2 years) |
| Expanding reimbursement for single-pill regimens | +0.4% | North America and Europe | Medium term (2-4 years) |
| Uptake of once-weekly antihypertensive injectables (GLP-1 combos) | +0.3% | North America and Europe, expanding to Asia-Pacific | Long term (≥ 4 years) |
| Wider use of remote BP monitoring driving early prescription | +0.5% | Global, led by developed markets | Short term (≤ 2 years) |
| AI-powered dose-titration platforms improving outcomes | +0.2% | North America and Europe | Long term (≥ 4 years) |
| Source: Mordor Intelligence | |||
Accelerating Obesity and Metabolic Syndrome
Metabolic syndrome affects roughly one-third of adults worldwide, and hypertension co-exists in 85% of these patients. Clinicians are moving toward agents that simultaneously address weight, glycemic control, and blood pressure, particularly GLP-1 receptor agonists that cut systolic readings by 7–10 mmHg independent of weight loss. Health-system models estimate that unchecked hypertension could push annual cardiovascular treatment costs from USD 160 billion in 2020 to USD 513 billion by 2050, reinforcing the economic case for aggressive early therapy [1]Source: American Heart Association, “Forecasting the Economic Burden of Cardiovascular Disease,” ahajournals.org.
Growth of Fixed-Dose Combination Therapies
Roughly 70% of patients need two or more antihypertensive agents, yet adherence drops as pill count rises. FDA approval of the first triple-combination tablet in 2025 signals a regulatory green light for upfront multi-drug products that achieved 70% control rates versus 37% on placebo. Health-economic studies put annual hospitalization savings at USD 873 per adherent patient, spurring payers to prioritize such regimens.
Expanding Reimbursement for Single-Pill Regimens
Medicare and large private plans have moved combination therapies into preferred tiers after real-world data showed 42% goal attainment on combination products against 21% for monotherapy. In a significant move, Idorsia secured FDA approval for Tryvio, the first endothelin receptor antagonist for hypertension [2]Source: Idorsia Pharmaceuticals, “FDA Approval of Aprocitentan,” idorsia.com . This shift improves access for patients and pressures single-agent incumbents to show clear differentiation or transition toward fixed-dose formats.
Uptake of Once-Weekly GLP-1 Combination Injectables
Long-acting injectables tackle adherence challenges tied to daily tablets, with tirzepatide and semaglutide producing 15–20 mmHg systolic declines in monthly-dosed studies. Patients with concomitant diabetes favor the convenience, and providers value a single therapy covering multiple risk factors, a dynamic expected to build over the long term.
Restraints Impact Analysis*
| Restarint | (~) % Impact on CAGR Forecast | Geographic Relevance | Impact Timeline |
|---|---|---|---|
| Patent cliffs for blockbuster ARBs & CCBs | -0.7% | Global, particularly North America and Europe | Short term (≤ 2 years) |
| Low adherence due to asymptomatic nature of hypertension | -0.4% | Global, with higher impact in developing markets | Medium term (2-4 years) |
| Single-use plastics ban impacting parenteral packaging | -0.2% | Europe and select developed markets | Medium term (2-4 years) |
| Emerging nutraceutical substitutes in key Asian markets | -0.3% | Asia-Pacific, particularly China and India | Long term (≥ 4 years) |
| Source: Mordor Intelligence | |||
Patent Cliffs for Blockbuster ARBs & CCBs
Entresto loses U.S. exclusivity in mid-2025, and multiple ARB and CCB molecules face similar expiries, inviting rapid generic entry that historically erodes branded volume by up to 90% within a year. Manufacturers are countering with novel formulations and combination products, though payers favor generics for cost control.
Low Adherence Due to Asymptomatic Nature of Hypertension
Systematic reviews show 45.2% of patients lapse on therapy, directly capping prescription demand. Medicare models suggest that lifting adherence to 80% would save USD 13.7 billion annually, highlighting economic stakes and spurring investments in smart packaging, reminder apps, and long-acting modalities.
*Our forecasts treat driver/restraint impacts as directional, not additive. The impact forecasts reflect baseline growth, mix effects, and variable interactions.
Segment Analysis
By Drug Class: Leadership of ARBs Amid Emerging Mechanisms
Angiotensin II Receptor Blockers held 31.02% antihypertensive drugs market share in 2025 thanks to proven cardio-renal benefits and favorable tolerability. Renin Inhibitors, although smaller, will climb at 4.12% CAGR as physicians adopt new pathways for resistant patients. Endothelin receptor antagonists and aldosterone synthase inhibitors, newly approved in 2025, bring additional options for hard-to-treat cases. Beta Blockers and some older Calcium Channel Blockers lose ground due to metabolic side effects, while diuretics gain renewed interest through low-dose formulations. Pipeline diversity underscores a shift toward precision mechanisms addressing comorbidity clusters and resistant hypertension niches.
The antihypertensive drugs market continues to reward classes that combine efficacy with favorable side-effect profiles. Lifecycle strategies now favor triple-combination tablets that integrate ARBs with CCBs or diuretics, anchoring brand loyalty even amid generic pressure. Novel mechanisms are expected to command premium pricing where they demonstrate clear outcome advantages, cushioning revenue against pending patent expiries. Manufacturers with broad portfolios straddling generics and innovations will navigate the transition most effectively.


By Route of Administration: Oral Dominance Faces Innovation Pressure
Oral dosage retained 64.02% of antihypertensive drugs market size in 2025, reflecting patient familiarity and cost efficiency, yet non-oral routes are gaining traction. Transdermal systems post the quickest growth at 4.56% CAGR, driven by microneedle patches that improve permeation and weekly wear convenience. Injectable depots tied to GLP-1 combinations open a new adherence-friendly segment, particularly for patients with multiple metabolic conditions. Oral brands are responding through extended-release beads and abuse-deterrent coatings to remain competitive.
The market’s route mix will steadily diversify as technology advances. Parenteral formats could reach double-digit share in high-income countries by 2031, especially where digital health programs package injectables with monitoring services. Companies investing early in formulation science and patient-centric delivery stand to capture upside beyond the maturing tablet segment.
By Distribution Channel: Retail Hubs Converge with Digital Platforms
Retail pharmacies controlled 48.22% revenue in 2025 and retain a counseling advantage for chronic disease care. Yet online pharmacies record the highest CAGR at 5.03%, fueled by telemedicine, door-step delivery, and subscription models. Hospital pharmacies remain integral for complex polypharmacy and inpatient titration, but outpatient trends favor hybrid models.
Digital transformation is prompting brick-and-mortar chains to integrate e-commerce storefronts and data-driven adherence programs. Pharmaceutical firms collaborate with both pure-play digital platforms and omnichannel retailers to ensure broad, frictionless access. Success now depends on pairing competitive pricing with value-added services such as refill reminders and virtual consults.
Geography Analysis
North America captured 35.20% of 2025 revenue, leveraging sophisticated cardiology networks, strong insurance coverage, and fast uptake of novel classes. The United States leads, buoyed by premium prices and early use of digital health. Canada emphasizes cost-effectiveness, leaning on generics, while Mexico grows volume as coverage expands across public programs.
Europe contributes steady mid-single-digit growth under mature health systems that weigh cost and innovation in equal measure. Germany and the United Kingdom spearhead clinical adoption of advanced mechanisms, whereas Southern Europe leans on high generic penetration. Value-based contracting accelerates fixed-dose uptake in major EU markets.
Asia-Pacific stands out as the fastest-expanding region with a 5.52% CAGR. China’s bulk-procurement policies have cut prices yet boosted volumes, while India benefits from large-scale manufacturing and rising domestic demand. Japan’s aging demographic sustains spending on cardio-metabolic care. Local salt-sensitivity profiles and genetic variations prompt region-specific research programs, creating scope for differentiated therapies.
South America shows gradual improvement amid economic recovery and hypertension awareness campaigns, though currency volatility tempers premium-drug uptake. Middle East and Africa remain nascent but promising as governments invest in non-communicable disease control and private insurance penetration rises.

Regulatory Landscape
Regulation of anti-hypertensive drugs is shaped by major agencies such as the US FDA and the European Medicines Agency (EMA), with a growing emphasis on differentiated labeling for resistant hypertension and on simplification of regimens through fixed-dose combinations (FDCs). Recent approvals illustrate this direction, including FDA approval of aprocitentan (Tryvio) for hypertension in March 2024 and FDA approval of the triple FDC WIDAPLIK (telmisartan/amlodipine/indapamide) for adult hypertension in June 2025. Together, these approvals support an active pathway for multi-mechanism, single-pill products.
On quality and lifecycle oversight, regulators maintain heightened scrutiny on established high-volume classes such as ARBs. In the EU, EMA actions and guidance around nitrosamine risk in sartans continue to affect post-authorization controls, testing expectations, and supply-chain quality management for tetrazole-containing ARBs. EMA activity supporting pediatric use marketing authorizations, including the CHMP positive opinion for Bopediat in March 2026, also points to the requirement for age-appropriate formulations and evidence packages in pediatric hypertension and related renal comorbidity settings.
Competitive Landscape
Global market control rests with a cadre of multinational firms combining legacy blockbusters, broad generic arsenals, and innovation pipelines. Novartis, Pfizer, AstraZeneca, and Johnson & Johnson defend share through life-cycle-managed ARB and CCB portfolios, while simultaneously advancing next-wave agents such as aldosterone synthase inhibitors. Chinese manufacturers leverage cost advantages to expand generics in emerging economies.
Patent expiries in 2025–2027 intensify competition as at least ten generic makers target high-volume ARBs. Price erosion pressures branded revenue, yet innovators counter with fixed-dose launches and long-acting injectables that carry stronger barriers to entry. Strategic moves include co-development of AI dose-optimization software, acquisition of late-stage biotech assets, and regional manufacturing expansions to secure supply resilience.
Biotech disruptors focus on RNA interference, gene-editing approaches, and once-biannual depot formulations. Mineralys Therapeutics reported a 19 mmHg drop in Phase 3 trials for lorundrostat, underscoring the bar for novel therapy differentiation. Partnerships between pharma and digital-health firms enable integrated solutions that blend medication, remote monitoring, and coaching, setting new standards for hypertension management services.
Global Anti-hypertensive Drugs Industry Leaders
Pfizer Inc.
C.H. Boehringer Sohn AG & Ko. KG
Noden Pharma DAC
Daiichi Sankyo Company Limited
Merck KGaA
- *Disclaimer: Major Players sorted in no particular order

Market Opportunities and Future Outlook
The strongest opportunities are concentrated in segments that directly address adherence and patients with difficult-to-control blood pressure, where payers and clinicians have incentives to limit downstream cardiovascular outcomes. In May 2025, the WHO Expert Committee on Selection and Use of Essential Medicines recommended inclusion of triple fixed-dose antihypertensive formulations on the Model List of Essential Medicines. This creates procurement and access whitespace for manufacturers that can supply guideline-aligned, quality-assured combinations at scale across public-sector channels. In the United States, FDA approval of WIDAPLIK in June 2025 offers a concrete commercial and regulatory reference point for initial-therapy single-pill triple combinations, supporting portfolio strategies that move beyond single-agent price competition.
A second opportunity cluster centers on novel mechanisms for resistant hypertension, where traditional ACE inhibitor or ARB-based regimens underdeliver. FDA approval of Baxfendy (baxdrostat) in May 2026, alongside the earlier approval and commercialization path for aprocitentan (Tryvio in the United States and JERAYGO in the EU), expands the premium-therapy toolkit and supports sequencing, add-on use, and combination-development programs. Pipeline and regional innovation also widen optionality, including direct renin inhibitor research activity such as published clinical results for Shanghai Pharmaceuticals Holding Co. candidates (for example, SPH3127), which can support differentiated positioning in markets where renin-pathway targeting is clinically and commercially prioritized.
Recent Industry Developments
- May 2026: AstraZeneca reported US FDA approval of Baxfendy (baxdrostat), an aldosterone synthase inhibitor for hypertension used in combination with other drugs. The approval expands the set of novel-mechanism options for patients not adequately controlled on standard regimens and raises the bar for differentiation beyond mature ARB/CCB/diuretic portfolios.
- June 2025: George Medicines announced US FDA approval of WIDAPLIK (telmisartan/amlodipine/indapamide), a triple fixed-dose combination for hypertension in adults, including use as initial therapy. The decision strengthens the regulatory precedent for upfront single-pill triple therapy and supports broader commercialization of adherence-focused combination strategies.
- March 2024: Idorsia Pharmaceuticals received US FDA approval for TRYVIO (aprocitentan), an endothelin receptor antagonist for hypertension. This introduced a new drug class option for harder-to-treat patients and intensified competitive development around add-on therapies for resistant hypertension.


Research Methodology Framework and Report Scope
Market Definition and Coverage
This market covers prescription medicines used mainly to reduce systemic arterial blood pressure, including branded and generic therapies across major anti-hypertensive classes and fixed-dose combinations, sold through hospital and retail channels worldwide.
Scope exclusions: We exclude device-based hypertension interventions, nutraceuticals, and cardiovascular drugs that are only used off-label for blood pressure control.
Segmentation Overview
- By Test Type (Value)
- Culture-based Tests
- Smear Microscopy
- Nucleic Acid Amplification Tests (NAAT)/PCR
- Interferon-Gamma Release Assays (IGRA)
- Tuberculin Skin Test (Mantoux)
- Radiographic & Imaging Tests
- Other Tests
- By Technology (Value)
- Culture-based
- Molecular Diagnostics (PCR/NAAT)
- Immunoassays (IGRA/LAM)
- Radiology/X-ray
- AI-enhanced Digital Microscopy
- Others
- By End-User (Value)
- Hospitals & Clinics
- Diagnostic Laboratories
- Academic & Research Institutes
- Others
- By Geography (Value)
- North America
- United States
- Canada
- Mexico
- Europe
- Germany
- United Kingdom
- France
- Italy
- Spain
- Rest of Europe
- Asia-Pacific
- China
- India
- Japan
- South Korea
- Australia
- Rest of Asia-Pacific
- South America
- Brazil
- Argentina
- Rest of South America
- Middle East and Africa
- GCC
- South Africa
- Rest of Middle East and Africa
- North America
Data Sources, Market Sizing, and Validation
Desk Research
Desk research was used to set the demand backdrop and to keep assumptions realistic before interviews. We reviewed public sources such as the World Health Organization for hypertension prevalence, the World Bank for population and aging indicators, the US CDC for epidemiology signals, and OECD health statistics for treatment access and spend context.
To connect demand to revenue, we also used sources such as FDA and EMA public databases for approvals and labeling information, along with published clinical guidelines and peer-reviewed journals for class-level prescribing patterns and combination therapy trends. Company annual reports, earnings decks, and credible press were used to understand generic exposure, patent-loss timing, and portfolio mix. We then used paid subscriptions for company financials and for patent and filing intelligence for selective cross-checks. These examples are not exhaustive, and many other public sources were also referenced for data collection, validation, and clarification during the study.
Primary Interviews and Surveys
Primary interviews and structured surveys were completed with a mix of manufacturers, distributors, clinicians, and pharmacy-side experts who see real prescribing and tender behavior. We used these inputs to confirm class mix (for example, RAAS therapies versus calcium channel blockers and diuretics), typical therapy persistence, and price erosion patterns after generics. That feedback helped tighten the model and reduce gaps left by public data.
Distribution of primary research fieldwork respondents
| Company type | Respondent position | Region |
|---|---|---|
| Top tier: 28% | CXOs: 19% | APAC: 46% |
| Mid tier: 50% | Functional/Unit leaders: 40% | EMEA: 32% |
| Smaller Players: 22% | Managers: 41% | Americas: 22% |
Market-Sizing & Forecasting
Sizing started with a top-down build where prevalence and diagnosed population were translated into a treated pool using therapy coverage and adherence signals, and then mapped to class-level consumption and value using typical dosing, regimen mix, and average annual therapy cost. Once that demand pool was structured, we checked it using selective bottom-up approximations, such as sampled country roll-ups using reported pharma sales exposure, channel checks on prescription mix, and volume-times-price sanity checks for core classes.
A few practical variables were used as model inputs (illustrative, not exhaustive), including adult population growth and aging share, hypertension prevalence and diagnosis rates, share of patients treated and on combination therapy, generic penetration and price erosion curves, and timing of patent expiries and new launches that shift class mix. Where bottom-up data was thin for smaller markets, assumptions were bridged using comparable-country benchmarks on treatment coverage and price bands, and then adjusted after expert feedback.
For forecasting, we ran scenario analysis anchored to consensus expectations from interviews on access expansion, generic intensity, and the pace of fixed-dose combination uptake. This was supported by time-series smoothing on historic demand indicators, so short-term spikes did not over-influence the forward curve.
Data Validation & Update Cycle
Outputs were validated through multiple checks, including internal consistency tests across population, treated patients, and implied per-patient spend. We then compared results against independent health spending signals and class-level adoption patterns. Where we observed large variances at a country or class level, analysts revisited assumptions, re-checked desk inputs, and then re-contacted selected interviewees to confirm what changed.
Before sign-off, the full model is reviewed in steps so calculation logic, currency handling, and year alignment remain consistent across regions. The report is refreshed annually, and interim updates are done when material events occur, such as major label changes, large generic entries, or access policy shifts. Right before delivery, we run a final pass to ensure the latest public releases are reflected.
Mordor Intelligence's Anti Hypertensive Drugs Market Size Compared With Other Published Estimates
Published market numbers can look far apart even when they describe the same therapy area, mainly because the boundaries and the year definition are not aligned. Differences usually come from what is counted as an anti-hypertensive drug, how combination therapies are valued, and whether the estimate reflects list prices or typical net pricing after generics.
Prescription class mix, generic penetration signals, and patent-loss timelines are the checks that keep Mordor Intelligence tied to the revenue that is realistically generated by anti-hypertensive classes and fixed-dose combinations, instead of drifting into broader cardiovascular spending. Estimates also diverge when one model assumes more aggressive access expansion, uses different currency conversion timing, or mixes historical and forecast years on the same headline figure.
Benchmark comparison
| Source | Market Size | Gaps in Research Methodology |
|---|---|---|
| Mordor Intelligence | USD 27.61 B (2026) | |
| Global Publisher A | USD 27.00 B (2026) | Uses a demand-side view that can understate value in markets with higher-priced branded mix if net price and combination-therapy uplift are simplified, and the class-to-price mapping is not fully adjusted for generic erosion timing. |
| Industry Publisher B | USD 25.30 B (2024) | Uses an earlier base year and a shorter horizon, and may apply broader average pricing across classes without explicitly rebalancing for fixed-dose combination share and post-patent price decline patterns. |
The comparison indicates that year selection and price-treatment logic explain most of the gap, more than any single demand input. When the scope is limited to true anti-hypertensive classes, and when combination uplift and generic erosion are handled consistently, the outcome is easier to trace back to clear patient and prescribing variables.


Key Questions Answered in the Report
Q1. What is the current size of the antihypertensive drugs market?
A1. The antihypertensive drugs market stands at USD 27.61 billion in 2026 and is projected to reach USD 32.72 billion by 2031.
Q2. Which drug class leads global sales?
A2. Angiotensin II Receptor Blockers hold the largest share at 31.02% of 2025 revenue, thanks to strong efficacy and tolerability.
Q3. Which region will grow fastest through 2031?
A3. Asia-Pacific is expected to post the highest CAGR at 5.52%, driven by rising hypertension prevalence and expanding healthcare access.
Q4. How are fixed-dose combinations influencing the market?
A4. Triple- and dual-agent tablets improve adherence and have gained favorable reimbursement, boosting their uptake and lifting overall market value.
Q5. What impact will patent expiries have between 2025–2027?
A5. Patent cliffs for major ARBs and CCBs will intensify generic competition, likely depressing branded prices but widening patient access.
Page last updated on:


