Market Overview
| Study Period | 2020 - 2031 |
|---|---|
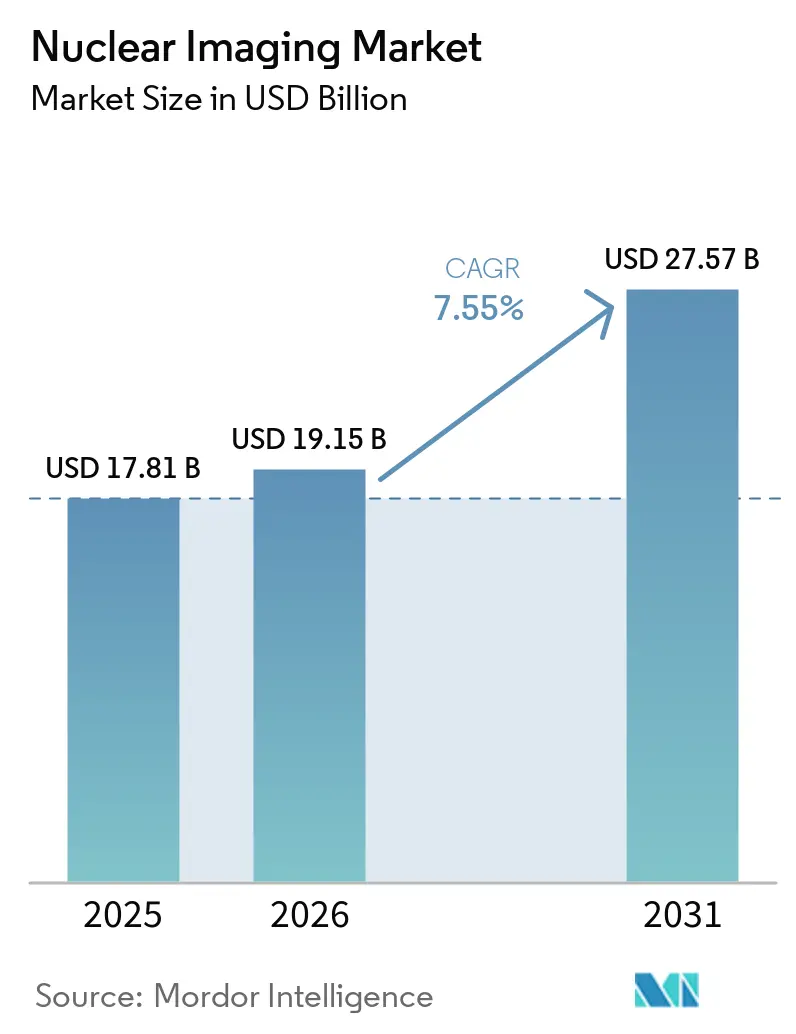
| Market Size (2026) | USD 19.15 Billion |
| Market Size (2031) | USD 27.57 Billion |
| Growth Rate (2026 - 2031) | 7.55% CAGR |
| Fastest Growing Market | Asia-Pacific |
| Largest Market | North America |
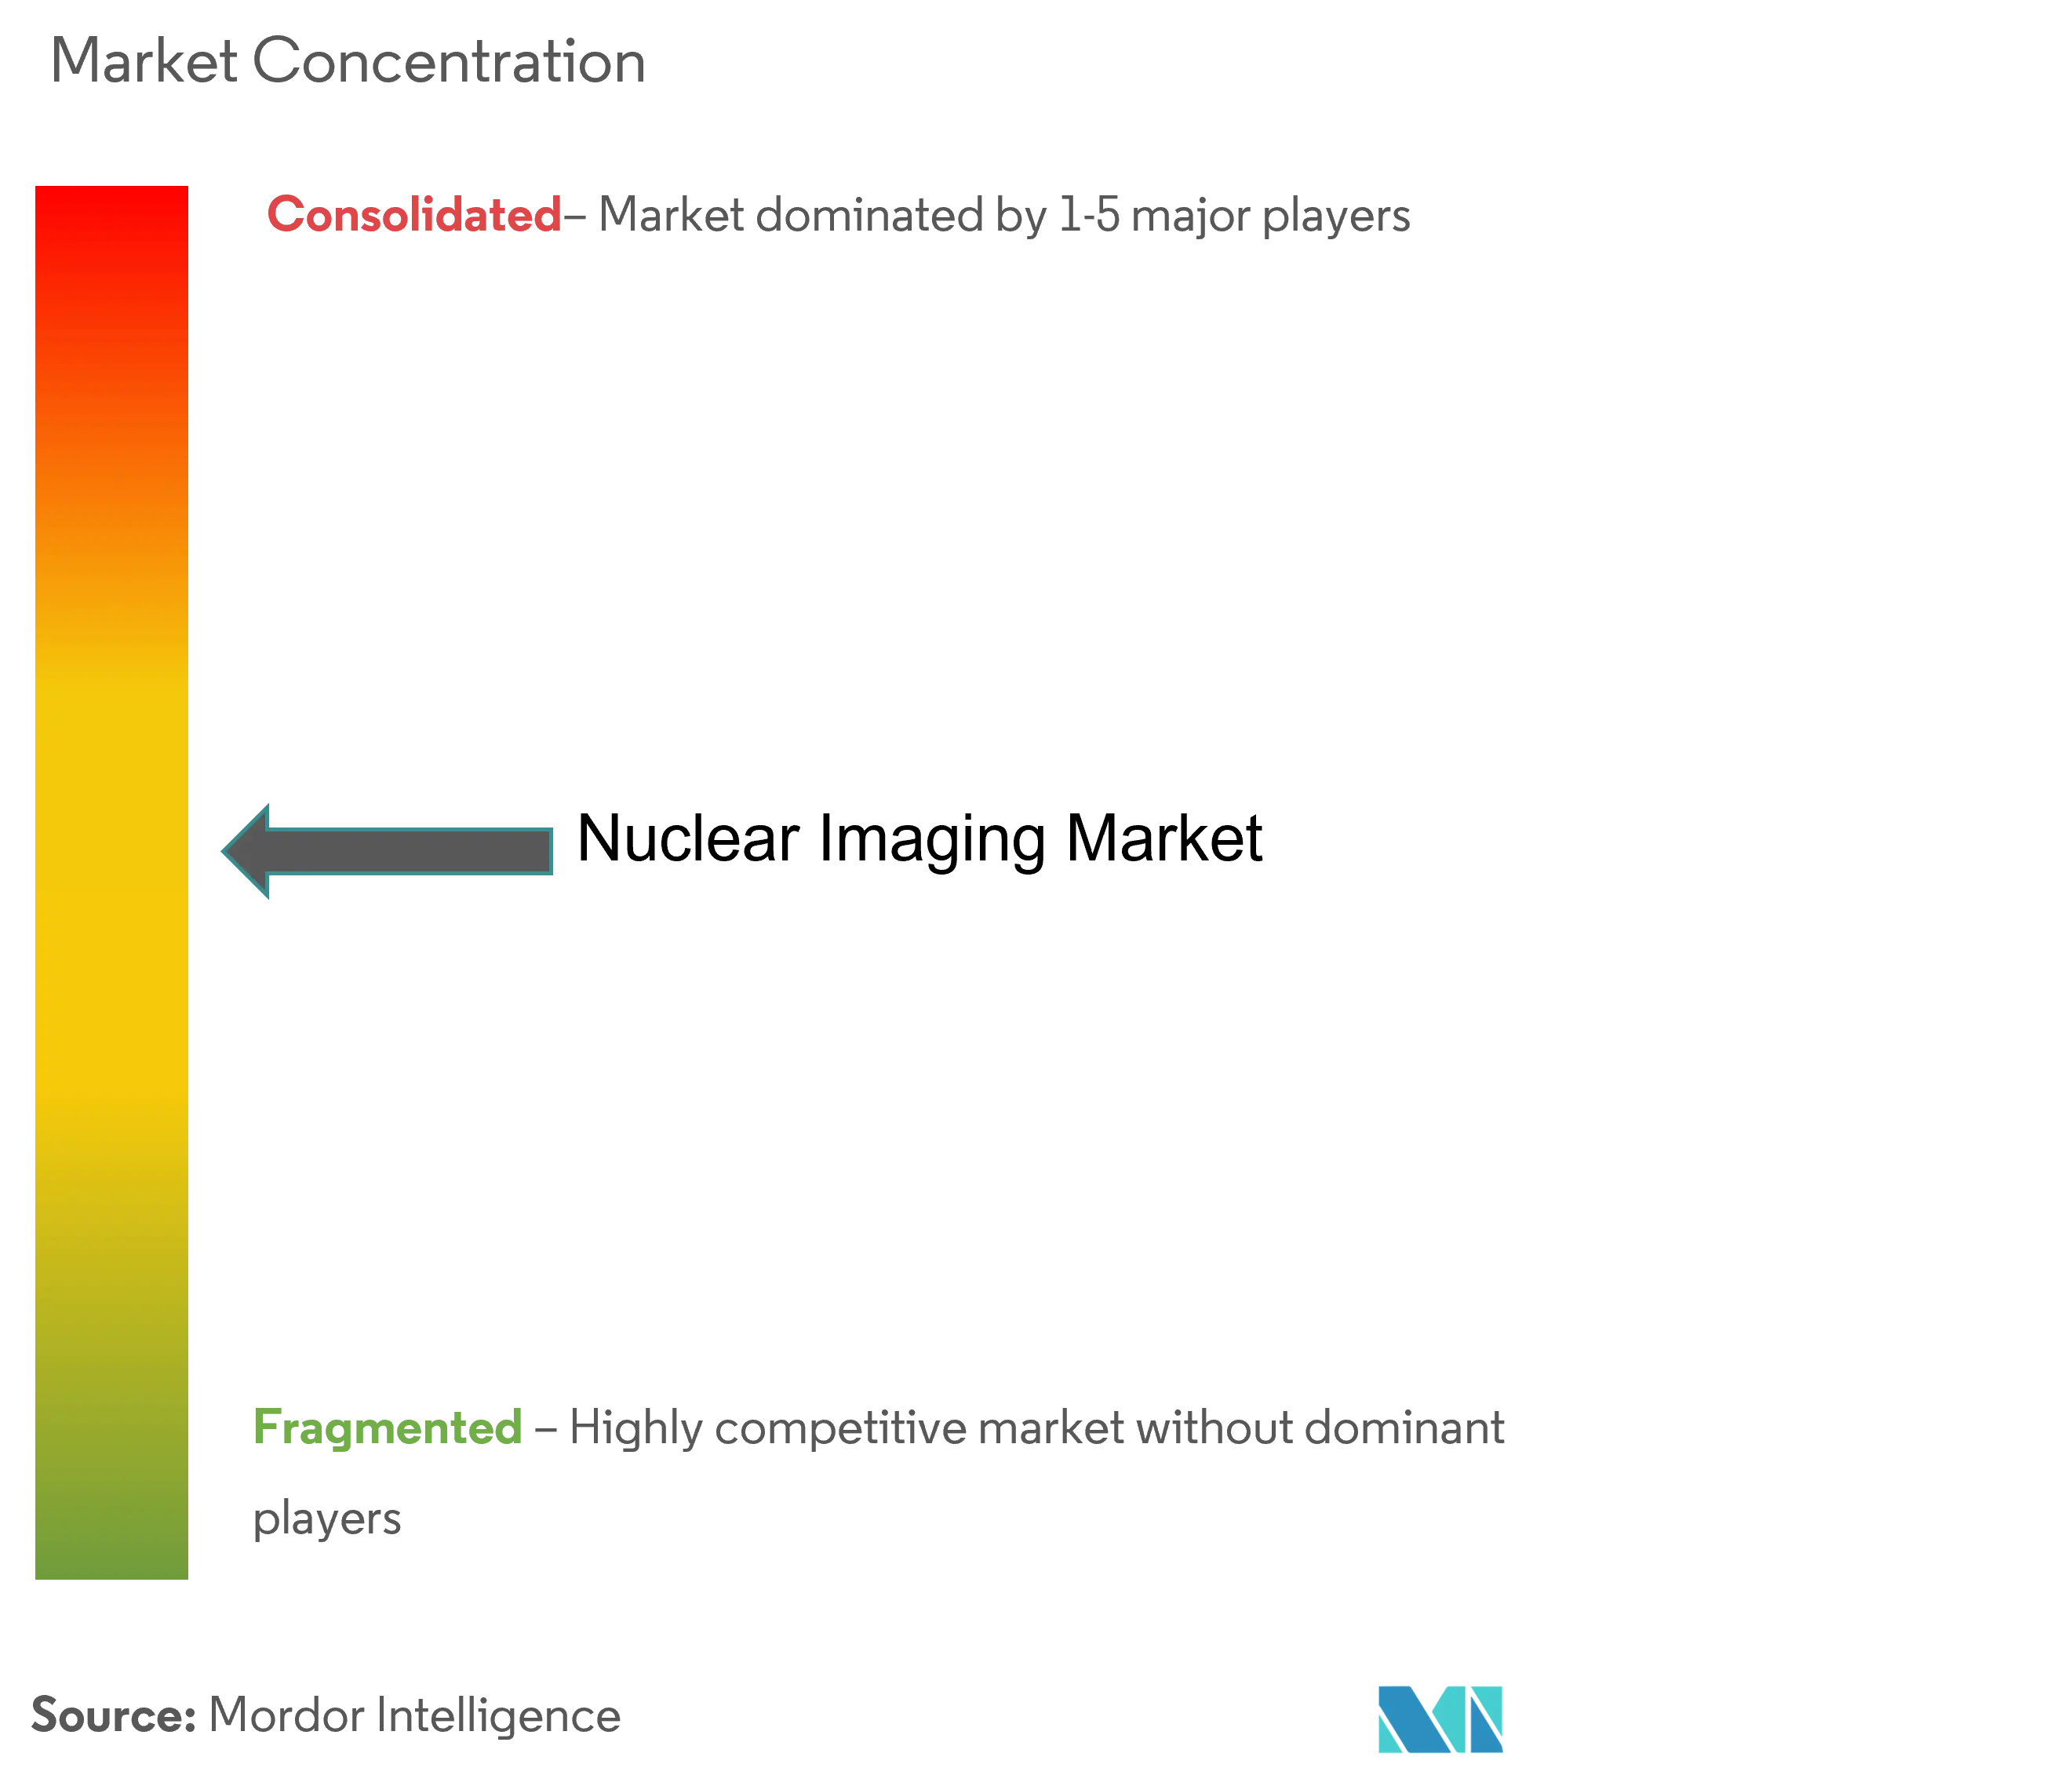
| Market Concentration | Medium |
Major Players *Disclaimer: Major Players sorted in no particular order Image © Mordor Intelligence. Reuse requires attribution under CC BY 4.0. | |
Nuclear Imaging Market Analysis by Mordor Intelligence
The Nuclear Imaging Market size is expected to increase from USD 17.81 billion in 2025 to USD 19.15 billion in 2026 and reach USD 27.57 billion by 2031, growing at a CAGR of 7.55% over 2026-2031.
Demand gains stem from rapid clinical adoption of targeted radiopharmaceuticals, ongoing upgrades to hybrid PET/CT and SPECT/CT scanners, and new reimbursement rules that separate high-cost tracers from bundled imaging payments[1]Source: Society of Nuclear Medicine and Molecular Imaging, “CMS Adjusts Nuclear Medicine Reimbursement Policy, Expanding Access to Life-Saving Scans,” snmmi.org . Government-backed investments in replacement isotope reactors, the build-out of hospital-based cyclotrons, and artificial-intelligence workflow tools further widen addressable procedure volumes. At the same time, persistent shortages of molybdenum-99, rising equipment outlays, and a widening technologist talent gap temper near-term upside. Well-capitalized suppliers are responding with vertical integration strategies that link isotope production, generator distribution, and software-enabled scanners, positioning themselves to capture premium margins as therapeutic applications broaden. Taken together, innovation advances faster than structural constraints, sustaining the nuclear imaging market’s long-run expansion trajectory.
Key Report Takeaways
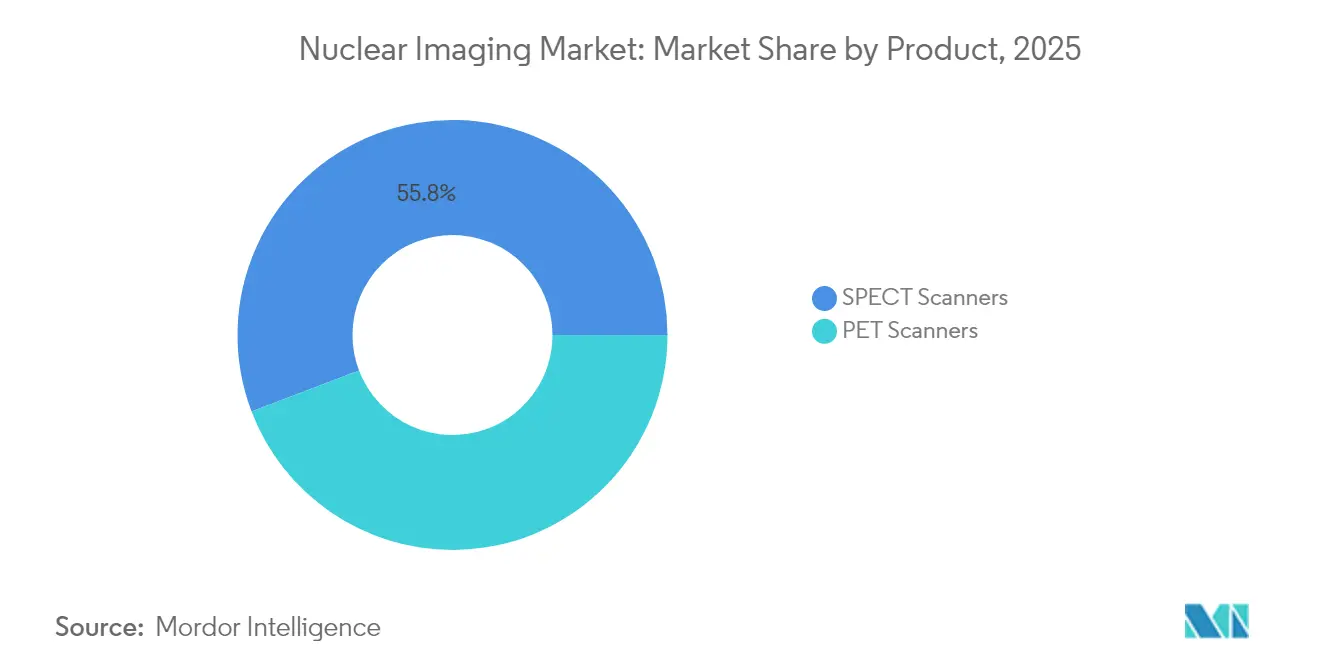
- By product, SPECT captured 55.78% of the nuclear imaging market share in 2025; PET are forecast to expand at an 8.03% CAGR through 2031.
- By application, SPECT applications held 72.65% share of thenuclear imaging market size in 2025; PET application is advancing at an 8.34% CAGR through 2031.
- By end user, hospitals commanded 53.10% share of the nuclear imaging market size in 2025; diagnostic imaging centers are projected to grow at an 8.69% CAGR through 2031.
- By geography, North America led with 41.85% share of the nuclear imaging market size in 2025, while Asia-Pacific is projected to expand at a 9.05% CAGR through 2031.
Note: Market size and forecast figures in this report are generated using Mordor Intelligence’s proprietary estimation framework, updated with the latest available data and insights as of 2026.
Global Nuclear Imaging Market Trends and Insights
Driver Impact Analysis*
| Driver | (~) % Impact on CAGR Forecast | Geographic Relevance | Impact Timeline |
|---|---|---|---|
| Rising cancer & CVD incidence | +2.1% | Global | Long term (≥ 4 years) |
| Rapid adoption of hybrid PET/CT & SPECT/CT systems | +1.8% | North America & EU, APAC expansion | Medium term (2-4 years) |
| Regulatory approvals of novel PSMA- & FAPI-based tracers | +1.5% | Global, with early gains in US, EU | Short term (≤ 2 years) |
| Government investments in isotope-production reactors | +1.2% | EU, North America, China | Long term (≥ 4 years) |
| Decentralised hospital cyclotrons | +0.9% | APAC core, spill-over to MEA | Medium term (2-4 years) |
| AI-driven dose- and workflow optimisation | +0.7% | North America & EU | Short term (≤ 2 years) |
| Source: Mordor Intelligence | |||
Rising Cancer and Cardiovascular Disease Incidence
Global oncology and cardiology case loads continue to climb, creating durable demand for both diagnostic imaging and therapeutic radiopharmaceuticals. FDA approval of Lu-177 PSMA-617 generated USD 1.04 billion in nine-month 2024 sales, validating precision oncology’s commercial scale. Cardiology meanwhile benefits from flurpiridaz F-18, which delivers superior sensitivity over legacy SPECT perfusion scans and enables exercise-stress protocols. Procedure growth spreads beyond mature markets as emerging economies integrate nuclear imaging units into tertiary hospitals. Because the same radioisotope infrastructure serves both disease areas, volume expansion produces operating-leverage benefits that reinforce supplier profitability. Ongoing increases in life expectancy and lifestyle-driven risk factors point to sustained high procedure counts through the forecast horizon.
Rapid Adoption of Hybrid PET/CT and SPECT/CT Systems
Hybrid imaging unites functional tracer data with high-resolution anatomical detail in a single exam, improving lesion localization while lowering false-negative rates. PET procedure volumes jumped 12.2% year-on-year in 2024 and average scans per PET/CT system rose 8.2%, signaling both installed-base expansion and higher utilization. Next-generation total-body PET platforms shorten acquisition times to under one minute, cutting tracer dose and boosting patient throughput. SPECT/CT gains detector efficiency from cadmium–zinc–telluride crystals, supporting low-activity protocols that lower pharmacy costs. AI engines embedded in reconstruction software automate organ segmentation and attenuation correction, freeing technologists for higher-value tasks. Hospitals thus view platform upgrades as a route to superior diagnostic accuracy and faster return on capital, accelerating the replacement cycle.
Regulatory Approvals of Novel PSMA- and FAPI-Based Tracers
The FDA cleared TLX007-CDx for prostate-cancer imaging, offering longer circulation times and higher target-to-background ratios versus legacy gallium-68 formulations. The U.K. MHRA authorized trofolastat, the first technetium-99m PSMA agent suitable for SPECT scanners, democratizing access where PET capacity is limited. Fibroblast-activation-protein inhibitors (FAPI) outperform FDG in low-glucose-metabolism tumors, opening new indications across pancreatic, breast, and colorectal cancers. Each approval adds billable procedure codes and stimulates generator, cyclotron, and cold-kit demand, enabling suppliers to monetize both equipment and consumables.
Government Investments in Isotope-Production Reactors
Aging research reactors risk unplanned outages that disrupt global technetium supplies. Policymakers now fund replacement capacity to safeguard clinical access. The European Union approved EUR 2.2 billion for the Dutch Pallas reactor, scheduled to assume Mo-99 production leadership when the High Flux Reactor retires. The U.S. Department of Energy awarded USD 88.8 million toward the Stable Isotope Production and Research Center at Oak Ridge, targeting domestic supply resilience[2]Source: U.S. Department of Energy, “DOE Awards Stable Isotope Facility Contract,” isotopes.gov . France’s EUR 250 million investment in thorium-228 extraction underpins European ambitions in alpha-emitting therapies. These programs anchor long-term production security, reduce price volatility, and encourage downstream private investment in radiopharma manufacturing.
Restraint Impact Analysis*
| Restraint | (~) % Impact on CAGR Forecast | Geographic Relevance | Impact Timeline |
|---|---|---|---|
| Fragile Mo-99 and other isotope supply chains | -1.8% | Global | Short term (≤ 2 years) |
| High capital cost & patchy reimbursement | -1.2% | Global, acute in emerging markets | Medium term (2-4 years) |
| Shortage of certified nuclear-imaging technologists | -0.9% | North America & EU | Medium term (2-4 years) |
| Slow regulatory path for alpha-emitting therapeutics | -0.6% | Global | Long term (≥ 4 years) |
| Source: Mordor Intelligence | |||
Fragile Mo-99 and Other Isotope Supply Chains
October 2024 maintenance delays at Europe’s Petten and Maria reactors cut Mo-99 deliveries by up to 100%, forcing clinics to postpone scans and ration generator activity. U.S. congressional hearings warned the nation remains vulnerable to similar disruptions, given its continuing reliance on imported technetium. While accelerator-based production pilots show promise, they cannot yet replace multi-curie reactor output. Such supply fragility raises procurement costs and complicates scan scheduling, constraining near-term nuclear imaging market growth.
High Capital Cost and Patchy Reimbursement
PET/CT systems exceed USD 2 million and shielded radiopharmacies add further structural outlays, making project economics highly sensitive to payor policy. CMS’s 2025 rule grants separate payment for diagnostic tracers above USD 630 per dose, easing some pressure, yet simultaneous 2.8% physician-fee cuts offset gains [acr.org]. Emerging-market payors frequently exclude advanced imaging, limiting addressable patient cohorts. As a result, providers adopt gradual, multi-year investment plans that slow installed-base growth despite favorable clinical evidence.
*Our forecasts treat driver/restraint impacts as directional, not additive. The impact forecasts reflect baseline growth, mix effects, and variable interactions.
Segment Analysis
By Product: Radioisotopes Extend Clinical Reach
SPECT captured 55.78% of the nuclear imaging market share in 2025; PET are forecast to expand at an 8.03% CAGR through 2031. Equipment sales benefit from hybrid upgrade cycles and AI-driven workflow features. Total-body PET platforms, priced at the system premium, enable eyes-to-thigh coverage within minutes, significantly raising department capacity. SPECT/CT gains detector sensitivity improvements that permit pediatric and renal protocols with reduced radiation burden. PET/MRI remains a niche for neuro-oncology research owing to high acquisition costs and integration complexity. Hospitals increasingly co-purchase cyclotrons to secure tracer supply, bundling financing packages that spread capital repayment across equipment, isotope contracts, and software maintenance. Together, these dynamics keep the nuclear imaging market size anchored by radioisotope volume growth even as hardware values advance steadily.


By Application: PET Accelerates as SPECT Holds Volume Base
SPECT maintained 72.65% share of the nuclear imaging market size in 2025, anchored by cardiology perfusion, thyroid imaging, and bone scans where technetium-based kits remain cost-effective. Cardiology alone accounts for more than half of SPECT activity, supported by widespread generator access and established reimbursement codes. Thyroid applications leverage iodine-123’s long clinical pedigree for hyperthyroidism and differentiated cancer follow-up. Neurology SPECT continues in dementia work-ups, though emerging amyloid-PET agents erode this niche. Despite these headwinds SPECT volumes exhibit resilience, and technetium agents remain inexpensive compared with PET tracers.
PET volumes rise at an 8.34% CAGR through 2031, narrowing the gap as oncologists transition from planar bone scans to whole-body FDG or PSMA imaging for metastatic survey. The September 2024 flurpiridaz F-18 approval opens exercise-stress cardiac PET, increasing patient throughput and diagnostic accuracy in coronary artery disease. FAPI-PET demonstrates superior lesion detection in desmoplastic tumors, accelerating inclusion in clinical guidelines. Multiorgan inflammatory and infection imaging emerges as a new PET frontier, leveraging tracers such as 68Ga-Citrate. As clinical scenarios diversify, PET’s share of the nuclear imaging market rises steadily, though SPECT retains a workhorse role in cost-sensitive settings.
By End User: Diagnostic Imaging Centers Gain Momentum
Hospitals accounted for 53.10% of the nuclear imaging market size in 2025, reflecting integrated oncology, cardiology, and neurology care pathways. Academic centers drive early adoption of alpha-emitter trials and AI-powered reconstruction algorithms, while community hospitals maintain high generator volumes for bread-and-butter technetium studies. Capital-budget committees increasingly prioritize cyclotron acquisition to secure tracer deliveries and capture outpatient revenue streams. At the same time, rising staff shortages and competing MRI or CT upgrades sometimes delay nuclear imaging expansion projects.
Diagnostic imaging centers register the fastest growth at an 8.69% CAGR, aided by freestanding PET/CT suites that streamline outpatient oncology staging. These centers negotiate bulk F-18 contracts with regional radiopharmacies and leverage AI-guided scheduling to maximize scanner uptime. Their nimble cost structures and shorter patient wait times appeal to oncologists seeking rapid diagnostic turnaround. Academic and research institutes remain a modest volume share yet play an outsized role in early-phase tracer trials, supporting the evidence base that feeds future commercial indications. Altogether, procedure decentralization diffuses market opportunity beyond hospital walls, supporting broader adoption and reinforcing the nuclear imaging market’s structural expansion.

Geography Analysis
North America led the nuclear imaging market with 41.85% share in 2025, supported by the world’s largest fleet of PET/CT scanners, robust payor coverage, and a deep pipeline of FDA-cleared tracers. CMS’s 2025 radiopharmaceutical payment carve-out above USD 630 removes a key deterrent to high-cost agents, encouraging hospitals to adopt F-18, Ga-68, and Cu-64 tracers for oncology, cardiology, and infection imaging. The U.S. also houses multiple cyclotron clusters and emerging accelerator production trials for Mo-99, aiming to reduce import dependence. Canada contributes specialized isotope production through the McMaster and TRIUMF facilities yet continues to rely on cross-border generator flows after the Chalk River reactor retirement.
Europe ranks second, balancing coordinated health systems with sustained public investment in isotope infrastructure. The EUR 2.2 billion Pallas reactor project secures long-term technetium supply and supports therapeutic isotope diversification. France positions itself at the forefront of alpha-therapy manufacturing via Orano Med’s thorium-228 plant, projected to supply 100,000 lead-212 doses annually post-2034. Regulatory agility is on display with U.K. MHRA approval of the first technetium-PSMA product, illustrating a willingness to extend tracer innovation beyond PET-dominant pathways. However, periodic reactor outages and varying national reimbursement tariffs produce patchwork market conditions across the bloc.
Asia-Pacific delivers the fastest regional growth at a 9.05% CAGR through 2031, spurred by large unmet diagnostic needs, rising oncology prevalence, and aggressive government backing for isotope self-sufficiency. China operates nearly 1,200 nuclear imaging departments and aims to double service capacity by 2035 under its medical-isotope development blueprint. Japan blends advanced device engineering with a growing radiopharmaceutical export platform, bolstered by GE HealthCare’s takeover of Nihon Medi-Physics. India and South Korea prioritize cyclotron deployments to support burgeoning PET activity and medical-tourism demand. Australia builds redundancy into Mo-99 supply through the ANSTO OPAL reactor. Across the region, regulatory harmonization efforts and workforce-training initiatives seek to keep pace with rapid equipment installation, shaping Asia-Pacific into the next demand engine for the nuclear imaging market.
Competitive Landscape
Competition spans two intertwined arenas, hybrid-scanner manufacturers and radiopharmaceutical suppliers, each racing to secure supply-chain control and software differentiation. Market leaders pursue bolt-on acquisitions to close capability gaps: GE HealthCare’s USD 183 million purchase of Nihon Medi-Physics amps up its tracer portfolio while the subsequent MIM Software deal adds AI-image-review tools . Lantheus sharpened its PET focus by spending up to USD 750 million for Life Molecular Imaging’s Neuraceq while offloading its SPECT line to SHINE Technologies, signaling a pivot toward higher-growth platforms .
Intellectual-property stakes intensify as Novartis defends Lu-177 franchises, filing infringement suits against rivals exploring similar radioligand therapies. Vertical integration emerges as a hedge against isotope shortages; companies invest in cyclotrons, generator production, and even reactor partnerships to secure raw-material flow. AI capabilities turn into competitive table stakes as automated lesion-tracking and quantitative-response tools drive clinician preference toward software-rich vendors. Smaller innovators focus on niche tracers—FAPI, CXCR4, and Alzheimer’s-targeting ligands—often partnering with larger firms for late-stage trials and commercialization muscle.
Alpha-emitter collaboration highlights pharmaceutical interest in next-generation therapies: Sanofi and Orano Med launched a EUR 300 million program to co-develop lead-212 candidates for rare cancers. Similarly, fusion-neutron start-ups court venture funds aiming to fast-track actinium-225 supply. The resulting landscape exhibits moderate concentration, with the top five players controlling just over 60% of combined scanner and radiopharmaceutical revenue, leaving room for mid-cap entrants that can exploit technology niches or regional production advantages.
Nuclear Imaging Industry Leaders
Bracco Imaging SpA
Cardinal Health Inc.
Koninklijke Philips NV
Siemens Healthineers
General Electric Company (GE Healthcare)
- *Disclaimer: Major Players sorted in no particular order

Recent Industry Developments
- March 2025: MHRA approved trofolastat (RoTecPSMA) as the first technetium-99m PSMA product for prostate-cancer imaging
- March 2025: FDA cleared TLX007-CDx, a PSMA PET agent with extended pharmacokinetics
- January 2025: Lantheus agreed to acquire Life Molecular Imaging for up to USD 750 million, adding the Neuraceq Alzheimer’s tracer


Global Nuclear Imaging Market Report Scope
As per the scope of the report, nuclear imaging equipment refers to medical devices used to create images of the internal structures and functions of the body by detecting radiation emitted from radioactive substances introduced into the patient.
The global nuclear imaging market is expected to register a CAGR of 7.63% during the forecast period. The global nuclear imaging market is segmented by product (equipment and radioisotope (SPECT radioisotopes (Technetium-99m (TC-99m), Thallium-201 (TI-201), Gallium (Ga-67), Iodine (I-123), and other SPECT radioisotopes) and PET radioisotopes (Fluorine-18 (F-18), Rubidium-82 (RB-82), and other PET radioisotopes))), application (SPECT applications (cardiology, neurology, thyroid, and other SPECT applications) and PET applications (oncology, cardiology, neurology, and other PET applications)), and geography (North America, Europe, Asia-Pacific, Middle East and Africa, and South America). The market report also covers the estimated market sizes and trends for 17 countries across major regions globally. The report offers the value (USD million) for the above segments.
By Product
| Equipment | PET Scanners |
| SPECT Scanners |
By Application
| SPECT Applications | Cardiology |
| Neurology | |
| Thyroid | |
| Other SPECT Applications | |
| PET Applications | Oncology |
| Cardiology | |
| Neurology | |
| Other PET Applications |
By End User
| Hospitals |
| Diagnostic Imaging Centres |
| Academic & Research Institutes |
By Geography
| North America | United States |
| Canada | |
| Mexico | |
| Europe | Germany |
| United Kingdom | |
| France | |
| Italy | |
| Spain | |
| Rest of Europe | |
| Asia-Pacific | China |
| India | |
| Japan | |
| South Korea | |
| Australia | |
| Rest of Asia-Pacific | |
| South America | Brazil |
| Argentina | |
| Rest of South America | |
| Middle East and Africa | GCC |
| South Africa | |
| Rest of Middle East and Africa |
| By Product | Equipment | PET Scanners |
| SPECT Scanners | ||
| By Application | SPECT Applications | Cardiology |
| Neurology | ||
| Thyroid | ||
| Other SPECT Applications | ||
| PET Applications | Oncology | |
| Cardiology | ||
| Neurology | ||
| Other PET Applications | ||
| By End User | Hospitals | |
| Diagnostic Imaging Centres | ||
| Academic & Research Institutes | ||
| By Geography | North America | United States |
| Canada | ||
| Mexico | ||
| Europe | Germany | |
| United Kingdom | ||
| France | ||
| Italy | ||
| Spain | ||
| Rest of Europe | ||
| Asia-Pacific | China | |
| India | ||
| Japan | ||
| South Korea | ||
| Australia | ||
| Rest of Asia-Pacific | ||
| South America | Brazil | |
| Argentina | ||
| Rest of South America | ||
| Middle East and Africa | GCC | |
| South Africa | ||
| Rest of Middle East and Africa | ||


Key Questions Answered in the Report
What is the current value of the nuclear imaging market?
The nuclear imaging market stands at USD 19.15 billion in 2026 and is forecast to reach USD 27.57 billion by 2031.
Which product segment leads revenue?
Radioisotopes dominate with 55.78% share in 2025 and are also the fastest-growing segment at an 8.03% CAGR.
Why are PET procedures growing faster than SPECT scans?
PET offers higher diagnostic accuracy, new tracers such as PSMA and FAPI, and hybrid PET/CT systems that improve workflow efficiency, driving an 8.34% CAGR through 2031.
How will new reactors affect isotope supply?
Projects like the Pallas reactor and the Oak Ridge isotope facility will add capacity, reducing Mo-99 shortages and stabilizing tracer pricing after 2027.
What hampers widespread adoption of alpha-emitting therapies?
Limited actinium-225 and lead-212 production capacity and lengthy regulatory requirements delay large-scale commercialization until the late forecast period.
Page last updated on:


