
Market Overview
| Study Period | 2020 - 2031 |
|---|---|
| Forecast Data Period | 2026 - 2031 |
| Base Year Market Size (2025) | USD 51.23 Billion |
| Market Size (2026) | USD 53.06 Billion |
| Market Size (2031) | USD 63.25 Billion |
| Growth Rate (2026 - 2031) | 3.57 % |
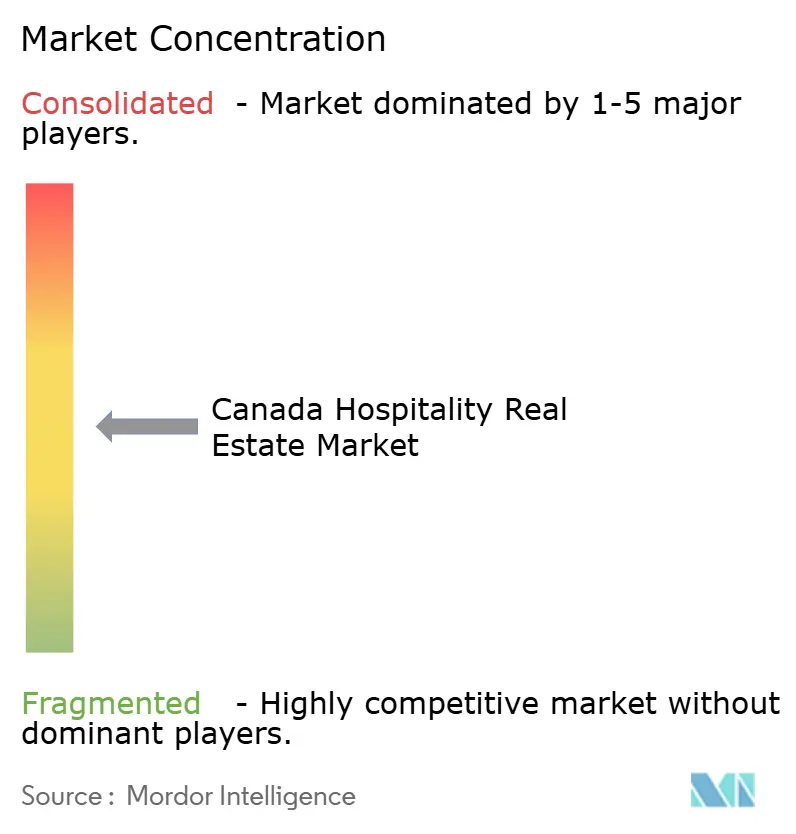
| Market Concentration | Medium |
Major Players *Disclaimer: Major Players sorted in no particular order Image © Mordor Intelligence. Reuse requires attribution under CC BY 4.0. | |
Canada Hospitality Real Estate Market Analysis by Mordor Intelligence
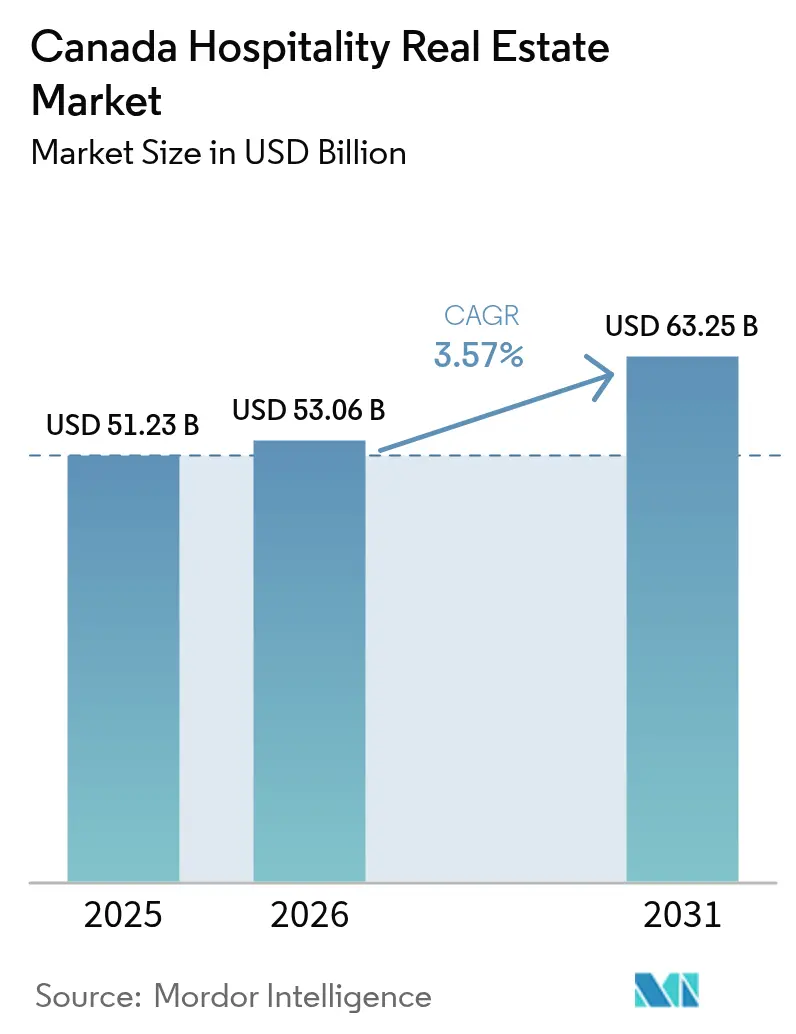
The Canada Hospitality Real Estate Market size is expected to grow from USD 51.23 billion in 2025 to USD 53.06 billion in 2026 and is forecast to reach USD 63.25 billion by 2031 at 3.57% CAGR over 2026-2031. Leisure-driven domestic demand, the rebound of inbound tourism, and price-resilient average daily rates (ADR) in supply-constrained metros are sustaining revenue momentum. Gateway cities—Toronto, Vancouver, and Montreal—benefit from restored air capacity and a weaker Canadian dollar that boosts cross-border spending, while secondary markets capture extended-stay and corporate-relocation demand. Tight credit and elevated construction costs temper ground-up development, but adaptive-reuse projects and ESG retrofits provide alternative growth corridors. Global chains double down on focused-service and extended-stay roll-outs, whereas well-capitalized independents use soft-brand affiliations to scale distribution.
Key Report Takeaways
- By property type, hotels held 79.65% of 2025 revenue, while resorts & spas are growing at a 4.02% CAGR through 2031.
- By type, chain hotels accounted for 62.15% of the 2025 Canada hospitality real estate market share; independent hotels post the fastest forecast CAGR at 4.36%.
- By asset class, midscale captured 40.35% of 2025 revenue; luxury is projected to expand at a 4.63% CAGR to 2031.
- By geography, Ontario controlled 30.35% of 2025 revenue, whereas British Columbia is set to deliver the quickest 4.92% CAGR through 2031.
Note: Market size and forecast figures in this report are generated using Mordor Intelligence’s proprietary estimation framework, updated with the latest available data and insights as of 2026.
Canada Hospitality Real Estate Market Trends and Insights
Drivers Impact Analysis*
| Drivers | (~) % IMPACT ON CAGR FORECAST | Geographic Relevance | Impact Timeline |
|---|---|---|---|
| Population growth and tourism recovery | +1.2% | Ontario, British Columbia, Quebec | Medium term (2–4 years) |
| Weak CAD, events travel, restored air routes | +0.9% | Border provinces and gateway cities | Short term (≤ 2 years) |
| Extended-stay and select-service resilience | +0.7% | Calgary, Edmonton, Toronto, Vancouver | Medium term (2–4 years) |
| Urban office-to-hotel conversions | +0.5% | Toronto, Vancouver, Montreal, Calgary | Long term (≥ 4 years) |
| ESG retrofits unlock green financing | +0.3% | Ontario and British Columbia | Long term (≥ 4 years) |
| Source: Mordor Intelligence | |||
Population Growth and Tourism Recovery Lifting Occupancy and ADR
Immigration added a record 1.3 million residents in 2024, and domestic overnight trips reached 105.6 million, up 8.8% year-over-year, directly supporting hotel demand[1]Statistics Canada, “National Travel Survey, second quarter 2024,” statcan.gc.ca. Accommodation revenue already sat 9.6% above 2019 by 2022, and Q4 2024 lodging consumption advanced 2.6% quarter-over-quarter. Although international arrivals remain 12% below 2019, ongoing visa-processing gains suggest more upside. Average daily rates climbed 2.9% in Q1 2025 despite a marginal occupancy dip, underscoring pricing power in capacity-tight metros. New event infrastructure, such as Calgary’s expanded BMO Centre, layers incremental group demand for nearby rooms.
U.S. and International Demand Buoyed by Weaker CAD and Air Capacity Rebuild
The CAD traded between 1.35 and 1.44 per USD through 2024–2025, making Canada cost-competitive for Americans and long-haul visitors. U.S. travelers logged 23.5 million trips in 2024, and international air capacity exceeded 2019 levels in four straight quarters. Europe and Asia arrivals each rose more than 8% year-over-year in August 2024, cushioning a slide in Canadian outbound travel. Leisure and event-driven trips, including high-profile concerts and sports tournaments, funneled spend into hotels across Toronto, Vancouver, and Ottawa. That inbound tailwind directly lifts urban RevPAR, given the concentration of international visitors in gateway markets.
Extended-Stay, Select-Service, and Limited-Service Formats Showing Resilient Margins
Focused-service brands accounted for half of Hilton’s Canadian openings in the past decade, while its extended-stay keys doubled, signaling franchisee preference for lean-staff models. Cap-rate evidence aligns: select-service assets transacted at 6.0–9.5% yields, yet reached breakeven faster than full-service counterparts. Staffing efficiencies matter when accommodation-sector weekly pay trails the national norm by nearly 50%, and vacancies still hover above 4%. Home-like amenities and lower food-and-beverage overheads keep margins firm even during demand wobble. Pipeline data—20-plus openings slated in the next year—points to durable developer appetite.
Urban Repositioning—Office/Retail Conversions and Mixed-Use Projects—Expanding Supply
Persistently high downtown office vacancies coax owners toward hotel or aparthotel conversions. Quebec City’s Îlot Dorchester, a 150-room hotel within a 17-story mixed-use tower, and Vancouver’s 464-unit Granville Street hotel exemplify this reuse path. Adaptive projects leverage existing utility and transit lines, shortening pre-development phases relative to greenfields. Heritage retrofits also align with municipal carbon targets; the Fairmont Royal York’s deep-carbon overhaul cut emissions 80% and unlocked USD 46.5 million of low-rate debt via Canada Infrastructure Bank. Nonetheless, approvals often stretch 18–36 months, lengthening carry periods and pressuring developer returns.
Restraints Impact Analysis*
| RESTRAINTS | (~) % IMPACT ON CAGR FORECAST | Geographic Relevance | Impact Timeline |
|---|---|---|---|
| High financing costs and tighter underwriting | -0.8% | Toronto and Vancouver debt-sensitive projects | Short term (≤ 2 years) |
| Construction inflation and permitting delays | -0.6% | British Columbia and Ontario | Medium term (2–4 years) |
| Acute labor shortages and rising wages | -0.4% | Alberta and British Columbia | Short term (≤ 2 years) |
| Source: Mordor Intelligence | |||
High Financing Costs and Tighter Underwriting Slowing Transactions
The overnight rate eased to 2.25% by December 2025, yet five- and ten-year yields remain 100 basis points above pre-2022 norms, sustaining higher debt-service burdens. OSFI’s November 2024 notice tightened provisioning rules, compelling lenders to demand more equity and stronger sponsor track records. Morguard’s sale of 14 hotels for USD 410 million typifies landlords reallocating capital to less-risky sectors. Development leverage has fallen, often capping at 55% loan-to-cost, slowing ground-up starts. This tighter capital climate drags on the Canada hospitality real estate market expansion pace despite healthy demand fundamentals.
Construction Inflation, Supply-Chain Delays, and Permitting Complexity Elevating Capex and Timelines
Building-cost indices continued to rise through 2024 as material tariffs and wage escalation fed into bids. Municipal approvals in Vancouver or Toronto frequently exceed two years, layering soft-cost inflation on stalled projects. Contractors price supply-chain risk premiums into hotel scopes because mechanical systems often depend on imported components. These hurdles raise per-key costs and push project IRRs below hurdle rates unless ADR forecasts are reset higher. Consequently, some developers pivot to converting existing buildings to sidestep both expense and red-tape drag.
*Our forecasts treat driver/restraint impacts as directional, not additive. The impact forecasts reflect baseline growth, mix effects, and variable interactions.
Segment Analysis
By Property Type: Hotels Anchor Revenue, Resorts Capture Wellness Demand
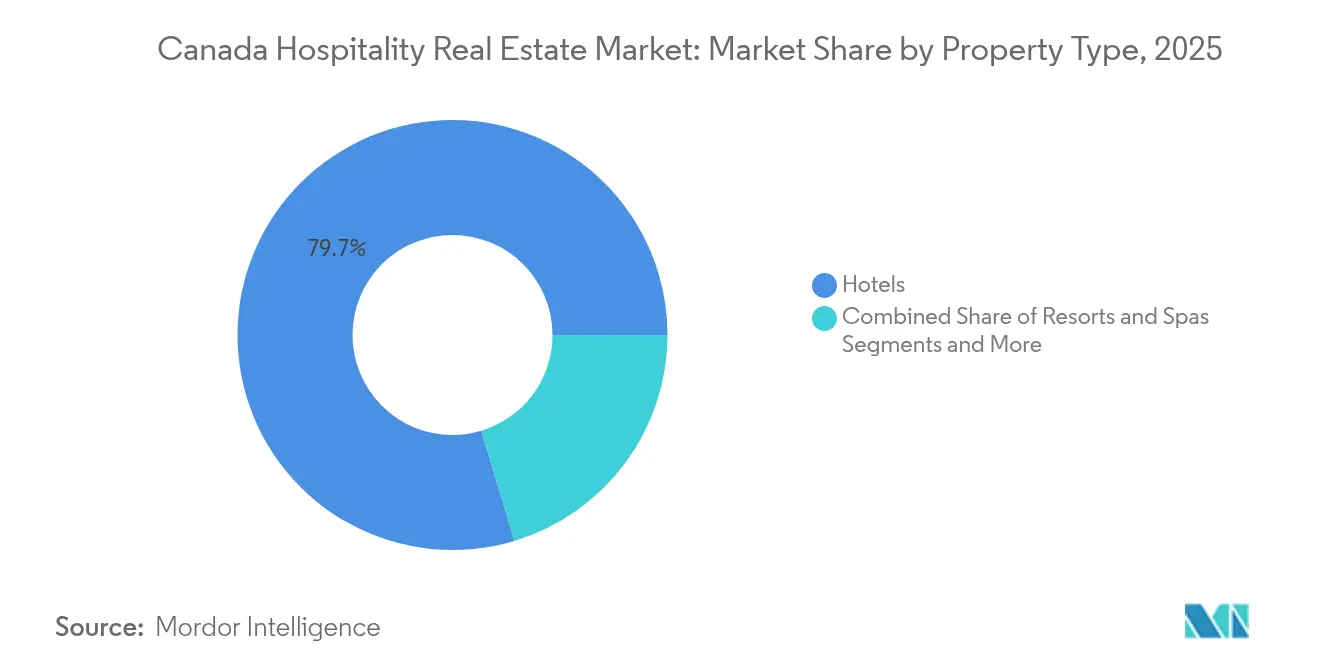
Hotels captured 79.65% of 2025 revenue in the Canada hospitality real estate market, reflecting their extensive footprint in every major urban corridor. Revenue comes from a balanced corporate, leisure, and group mix, enabling chains to spread fixed costs across high-occupancy seasons. Branded operators continue to refurbish lobbies into co-working lounges, monetizing non-room square footage and increasing ancillary spend. Resorts & spas, although representing a smaller base, are forecast to expand at a 4.02% CAGR through 2031, outstripping the broader Canada hospitality real estate market as wellness tourism gains mainstream traction.
Investor interest pivots toward experience-rich properties such as Therme Canada’s Ontario Place redevelopment, which layers water-park, botanical, and thermal attractions under one roof. Legacy icons like Fairmont Chateau Lake Louise add eco-friendly thermal facilities to secure year-round occupancy premiums. Tight land availability near national parks and lakes protects ADR, while brands pursue asset-light management agreements to cap downside. Overall, hotels will keep dominating transaction volume, yet resorts are tipped to deliver higher RevPAR growth as affluent travelers prioritize holistic wellness experiences.



By Type: Chains Leverage Scale, Independents Gain Through Soft Brands
Chain hotels controlled 62.15% of 2025 rooms, a figure backed by powerful loyalty ecosystems and procurement savings that widen EBITDA margins. Their pipeline favors focused-service and lifestyle concepts that require smaller banquet and kitchen footprints yet drive comparable RevPAR. Independents, aided by soft-brand affiliations, are on track for a 4.36% CAGR, the quickest growth rate in this segmentation. Ascend Hotel Collection and Tapestry Collection extend CRS and loyalty reach to boutique owners that retain design autonomy.
Domestic operator Germain Hotels illustrates the strength of the hybrid model after securing USD 118 million to expand its Alt and Le Germain banners. Franchise structures attract newcomers by offering standardized operating manuals, but rising fee loads motivate some owners to renegotiate or switch to emerging white-label managers. Over 2026-2031, the Canada hospitality real estate market size tied to independents will expand as digital marketing lowers distribution barriers, while chains maintain dominance through scale and brand equity.
By Asset Class: Midscale Dominates Volume, Luxury Commands Premium Growth
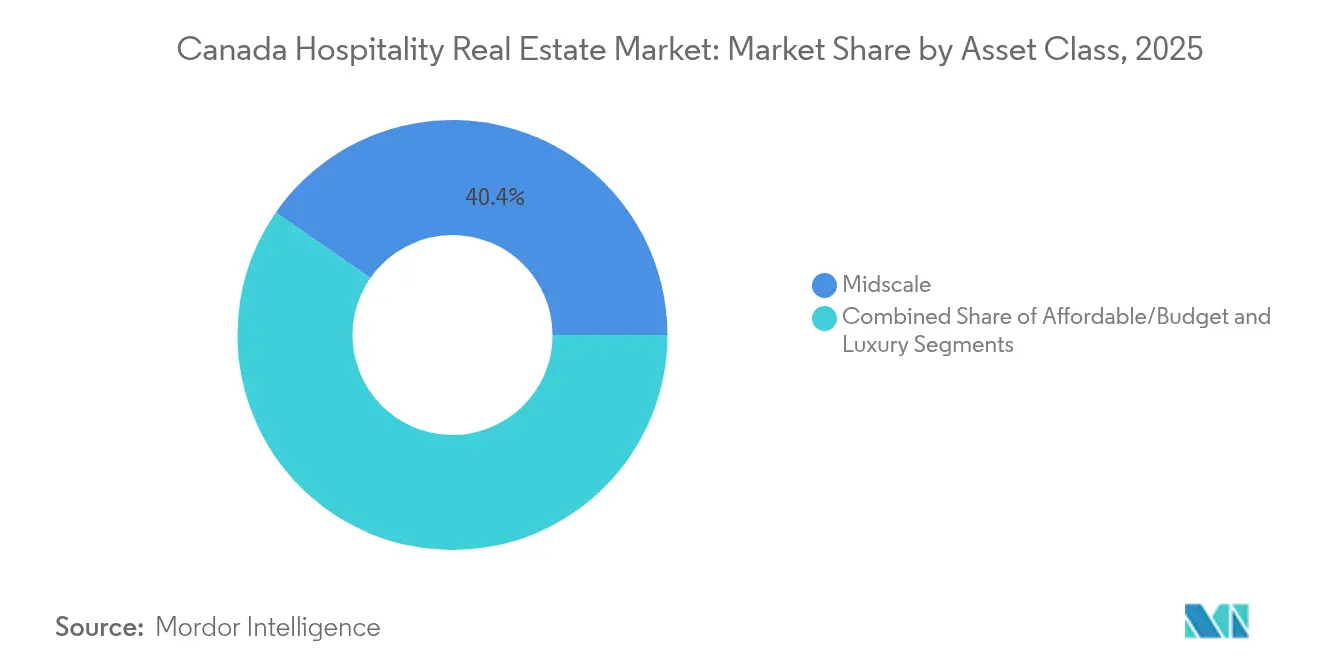
Midscale captured 40.35% of 2025 revenue in the Canada hospitality real estate market, leveraging highway, airport, and suburban demand nodes. These properties operate lean, with automated breakfast service and reduced banquet space, keeping fixed costs low. Loyalty points and consistent mattress standards continue to resonate with cost-conscious travelers and small corporate accounts.
Luxury, projected to grow at a 4.63% CAGR, outperforms as high-net-worth travelers seek personalized, experience-centric stays. Hilton’s lifestyle push—Curio, Canopy, and forthcoming Tempo in Toronto—illustrates the chain's ambitions to capture boutique-luxury wallet share. Capital follows: downtown conversions of heritage buildings into five-star hotels often achieve cap-rate compression to near-6%, reflecting investors’ confidence in rate resilience. Midscale will remain the market’s volume backbone, yet luxury assets will disproportionately drive incremental RevPAR and attract trophy-seeking capital.
Geography Analysis
Ontario generated 30.35% of 2025 revenue, anchored by Toronto’s convention demand, Ottawa’s government traffic, and Niagara Falls’ leisure inflows. British Columbia leads growth with a 4.92% CAGR forecast, fueled by Vancouver’s restored Asia-Pacific lift and Victoria’s resort pull. Quebec holds a strong cultural tourism base; Montreal’s festival calendar shores up summer occupancy, while Quebec City benefits from heritage travel and government business. Alberta, still linked to energy-sector cycles, leverages the new BMO Centre to diversify group bookings, though Calgary’s RevPAR slipped in early 2025 before stabilizing as commodity prices rebounded.
Saskatchewan and Atlantic provinces show volatile RevPAR swings tied to event clusters and contract demand. Manitoba’s 13% RevPAR decline in Q1 2025 illustrates that one-off government housing contracts can skew comps. Conversely, Saskatchewan’s 8% rise underscores the upside when provincial events align with limited room supply. Northern territories remain niche, servicing resource projects and adventure tourism, but limited pipeline pockets keep ADR firm. Across regions, rising air capacity, especially at Vancouver International and Toronto Pearson, concentrates international guest nights in gateway metros, whereas highway-fed areas rely on domestic leisure drive trips. ESG mandates also vary geographically: British Columbia and Ontario municipalities offer tax incentives for electrification, leading to a higher share of certified green hotels in these provinces. Meanwhile, Alberta’s abundant natural gas pushes some operators toward co-generation solutions. Provincial tourism agencies increasingly coordinate with Indigenous communities, as shown by the First Nations’ majority stake in Hilton Québec, to ensure equitable development and cultural authenticity. These regional nuances shape capital allocation and brand rollout strategies in the Canada hospitality real estate market.
Regulatory Landscape
Canada's hospitality real estate development and conversions operate under a layered framework of federal tax rules, and provincial and municipal regimes for building, planning, and short-term rental enforcement. Federally, the Real Property (GST/HST) Regulations (SOR/2024-157) linked to the Enhanced GST Rental Rebate for purpose-built rental housing set eligibility parameters and exclude hotels and motels supplying accommodation for periods under 60 days. This has implications for mixed-use schemes that compare hospitality and long-term rental components.
On the construction and retrofit side, code and specification updates continue to lift compliance expectations for major renovations and new builds. In April 2026, Ontario published updated Ontario Amendments to the National Building Code of Canada 2020, and Quebec approved Regulation O.C. 236-2026 to amend the Construction Code, both reinforcing safety and design requirements for public-use facilities. Nationally, the National Research Council Canada updated the National Master Construction Specification in April 2026, adding climate resiliency and Buy Canadian compliance elements that affect tender requirements and cost planning for hotel projects and ESG retrofits. Separately, Housing, Infrastructure and Communities Canada's Short-Term Rental Enforcement Fund (CAD 45.9 million, 2024-2027) supports municipal enforcement activity that can tighten the operating environment for non-hotel short-term accommodation, which may redirect demand toward compliant lodging stock.
Value Chain Analysis
Capital formation and site control typically begin with owners and developers (institutions, REITs, and private groups) working through brokers and advisors, followed by brand selection (franchise, management agreement, or soft brand) and project underwriting with banks, credit unions, and increasingly institutional lenders. The development and renovation chain then moves through architects, engineers, general contractors, and specialist trades, while procurement is influenced by mechanical and building-systems availability and prevailing construction inflation. In early 2026, the active pipeline referenced in industry tracking totaled about 331 projects and 45,401 rooms, with Ontario, British Columbia, and Quebec accounting for a large share, reflecting where entitlement and construction capacity are most concentrated.
Operations and asset optimization sit downstream, where hotel owners depend on third-party managers, revenue-management and distribution platforms, and staffing ecosystems to deliver NOI. Labor constraints remain a key bottleneck in the operating layer, and industry reporting indicates many operators experienced service impacts from staffing gaps in 2025. This supports the investor appeal of select-service and extended-stay formats, which generally need fewer staff per occupied room. On the transaction side, industry reporting of roughly USD 2.2 billion in 2025 indicates liquidity for recapitalizations, repositionings, and portfolio churn, which then feeds back into renovation pipelines and brand change-of-control processes.
Competitive Landscape
Global chains control roughly 60–65% of branded keys, giving them procurement clout and loyalty capture that underpin stable occupancy. Hilton surpassed 200 open hotels in September 2025 and has more than 100 projects in the pipeline, with emphasis on focused-service and lifestyle banners. Marriott, IHG, Hyatt, and Choice pursue similar multi-brand layering to fill white spaces across price points and trip purposes.
Domestic contenders compete through agility and localized design. Germain Hotels’ coast-to-coast push, financed with USD 118 million of long-dated capital, demonstrates how a strong regional brand can secure prime urban sites. Sunray Group’s acquisition of the historic Walper Hotel for USD 13.7 million signals an independent appetite for heritage assets in tech-hub markets. Indigenous investment vehicles enter marquee properties, aligning economic returns with community development mandates.
Institutional capital treats hospitality as a tactical allocation. Brookfield monetized USD 40 billion of real estate in 2024, including hotel exits, to recycle into higher-yielding bets. Morguard’s USD 410 million divestiture and InnVest REIT’s continued acquisitions illustrate portfolio re-balancing along risk-adjusted lines. Technology adoption—revenue-management AI, mobile key, and guest analytics—emerges as a decisive edge. ESG credentials, now considered in RFPs by Fortune 500 meeting planners, further differentiate winners in the Canada hospitality real estate market.
Canada Hospitality Real Estate Industry Leaders
Brookfield Asset Management
InnVest Hotels
Westmont Hospitality Group
Superior Lodging Corp
Coast Hotels
- *Disclaimer: Major Players sorted in no particular order

Market Opportunities and Future Outlook
Adaptive reuse and mixed-use development continue to act as primary whitespace for adding rooms in supply-constrained gateway cores, where permitting and construction inflation make greenfield feasibility harder. Pipeline signals include the February 2026 revised site plan submission for the Exhibition Place Exhibition Hotel and Venue (a 32-storey hotel tower paired with a 5,500-seat performance venue), and the July 2026 Vancouver City Council review process for a proposed 68-storey hotel tower in downtown Vancouver. Together, these projects show hospitality supply being anchored to event, entertainment, and urban regeneration nodes.
New-build opportunities also cluster around convention and group-demand infrastructure, plus branded luxury or upper-upscale repositioning, where trophy assets can be re-flagged to capture higher-rate demand. In January 2026, Fairmont and Truman announced plans for a 225-room Fairmont hotel with 100 branded residences in downtown Calgary near the expanded BMO Centre, linking convention capacity to adjacent hotel investment. On the capital side, transaction flow shows breadth across markets, with reported Q1 2026 deal activity spanning multiple transactions and emphasizing Western Canada, reinforcing the role of secondary-market acquisitions and repositionings when financing conditions limit the pace of ground-up starts.
Recent Industry Developments
- July 2026: Westmont Hospitality Group was reported as the prospective purchaser of the Chateau Montebello resort in Quebec, with bidder plans discussed that include adding new suites. A control change at a marquee resort asset can accelerate capital expenditure and repositioning activity, influencing competitive set dynamics in the Quebec resort and meetings segment.
- April 2026: InnVest Hotels acquired the 306-room Hotel Grand Pacific in Victoria, British Columbia. The acquisition expands InnVest's presence in a high-demand leisure and government-travel market and creates a platform for renovation and revenue-management upgrades that can lift the asset's market positioning.
- January 2024: InnVest Hotels announced the acquisition of a portfolio of 10 hotels in Ontario and Halifax totaling 1,737 guestrooms and 40,000 square feet of meeting space. The portfolio deal increased scale across major provincial markets and added meeting inventory that aligns with group-demand recovery in key urban and regional nodes.


Research Methodology Framework and Report Scope
Market Definition and Coverage
This market is sized as the total value of hospitality real estate activity in Canada that is tied to operating lodging properties, where demand is ultimately driven by overnight stays and related guest services within the property.
Scope exclusions: We exclude purely residential rentals, most standalone food service real estate that is not part of a lodging asset, and land-only transactions that are not linked to an operating hospitality property.
Segmentation Overview
- By Property Type
- Hotels
- Resorts & Spas
- Others (Serviced Apartments, Boutique Inns, etc.)
- By Type
- Chain Hotels
- Independent Hotels
- By Asset Class
- Affordable / Budget
- Midscale
- Luxury
- By Province
- Ontario
- Quebec
- British Columbia
- Alberta
- Rest of Canada
Data Sources, Market Sizing, and Validation
Desk Research
Desk research starts by grounding the demand picture and operating fundamentals in public series, then translating those signals into real estate value drivers. For Canada, we typically use Statistics Canada for travel and accommodation activity, the Canada Mortgage and Housing Corporation for housing context that affects extended-stay demand, and Bank of Canada releases to frame rate and credit conditions.
To keep the market view realistic by province, we also review government tourism portals and airport authority traffic releases, along with trade sources such as hotel association publications. We add reputable press coverage of openings, renovations, and conversions to confirm changes in active lodging supply. Company filings and investor presentations are used to sanity-check pipeline commentary and asset mix. In a few places, we also draw on paid databases for company financials and news, and on import-export shipment level signals when construction and fit-out trends need an external check. This list is illustrative, and we reviewed many other public sources to collect data, validate assumptions, and clarify open questions.
Primary Interviews and Surveys
Primary interviews are used to confirm what the data does not explain well, especially around rate setting, occupancy recovery patterns, and how investors think about cap rates by asset class. We speak with a mix of owners, developers, operators, lenders, brokers, and local advisors across Canada so that provincial differences in seasonality and demand mix are reflected in our inputs.
Distribution of primary research fieldwork respondents
| Company type | Respondent position |
|---|---|
| Top tier: 32% | CXOs: 16% |
| Mid tier: 52% | Functional/Unit leaders: 40% |
| Smaller Players: 16% | Managers: 44% |
Market-Sizing & Forecasting
Our model uses a top-down approach, reconstructing national and provincial accommodation activity through demand and operating metrics, and then linking that activity to real estate value using pricing and yield assumptions. To keep totals practical, we corroborate with selective bottom-up checks, including sampled room supply by province, observed ADR bands, and a limited roll-up of known portfolios and new additions, which we use to adjust for outliers.
The inputs that move the totals most are room supply additions and closures, occupancy and ADR movement, RevPAR direction in key cities, the split between chain and independent properties, and financing conditions that affect development timing and transaction appetite. Where data gaps exist, particularly for smaller independent assets, we apply conservative proxies based on peer properties and then re-check them via channel conversations. For forecasting, we use scenario analysis supported by variable-level expectations gathered in interviews, so tourism rebound and rate-shock downside are treated as separate paths before selecting the final base case.
Data Validation & Update Cycle
Validation is done through triangulation across independent signals, so modeled outputs are compared against lodging performance indicators, announced project pipelines, and the direction of credit conditions. When a province-level result moves too far from what operators and brokers are seeing, we re-check the key inputs, and we may re-contact sources to confirm the underlying driver.
Before sign-off, an analyst review checks currency consistency, timing mismatches, and unusual jumps caused by one-time events. The report is refreshed annually, and interim updates are triggered when major policy shifts, financing changes, or demand shocks are material. Right before delivery, we complete a final pass so the published view aligns with the latest public releases.
Mordor Intelligence's Canada Hospitality Real Estate Sector Market Sizing Compared With Other Published Estimates
It is common to see different published market sizes for Canada hospitality real estate, since researchers do not always count the same components even when titles sound similar. In practice, the biggest gaps come from scope choices (real estate value versus broader hospitality spend), the year used for currency conversion, and whether pipeline and renovation activity is treated within the market or as a separate capital cycle.
Some published estimates also bundle restaurant real estate, amusement venues, and travel centers into a single total, which expands the counted universe beyond lodging-led assets. In Mordor Intelligence, the value stays tied to the hospitality real estate sector as defined in the study, and we check the sizing against lodging operating metrics such as occupancy and ADR so that non-lodging property categories do not inflate the total.
Benchmark comparison
| Source | Market Size | Gaps in Research Methodology |
|---|---|---|
| Mordor Intelligence | USD 51.23 B (2025) | |
| Industry Publisher A | USD 3.47 B (2025) | Uses a narrower valuation that reads closer to a limited property set and related service-oriented real estate, with definitions that mix in non-lodging categories and do not visibly anchor the sizing to Canada lodging fundamentals like room supply, occupancy, and ADR. |
| Advisory Firm B | USD 3.36 B (2024) | Anchors the base year at 2024 and describes a scope that includes restaurants and related venues, which can shift the counted pool and the price assumptions. The shorter forecast window and different currency timing can also compress the reported value versus a sector-level real estate view. |
The spread in the table mainly comes from what is being counted and how the value is tied back to measurable demand signals. By keeping inputs traceable to lodging supply and performance, and then pressure-testing the totals with expert feedback, our estimate stays easier to reproduce and explain year to year.


Key Questions Answered in the Report
What is the expected value of the Canada hospitality real estate market by 2031?
The market is projected to reach USD 63.25 billion by 2031, reflecting a 3.57% CAGR over 2026–2031.
Which province is forecast to grow fastest in Canadian hospitality real estate?
British Columbia leads with a 4.92% CAGR through 2031, buoyed by Vancouver’s international air lift and Victoria’s resort appeal.
Why are extended-stay and select-service hotels attractive to investors?
They ramp occupancy faster, run with leaner staffing, and traded at competitive 6.0–9.5% cap rates in early 2025.
How are ESG retrofits influencing hotel returns?
Deep-carbon projects like the Fairmont Royal York cut energy costs by more than 35% and unlock preferential green financing, boosting NOI.
What financing hurdles confront new hotel development in Canada?
Higher policy rates, stricter OSFI underwriting, and lower leverage availability have slowed ground-up starts despite healthy demand fundamentals.
Which segment shows the fastest revenue growth within asset classes?
Luxury hotels, projected to expand at a 4.63% CAGR through 2031, driven by high-net-worth traveler demand and heritage-building conversions.
Page last updated on:





