Market Overview
| Study Period | 2020 - 2031 |
|---|---|
| Forecast Data Period | 2026 - 2031 |
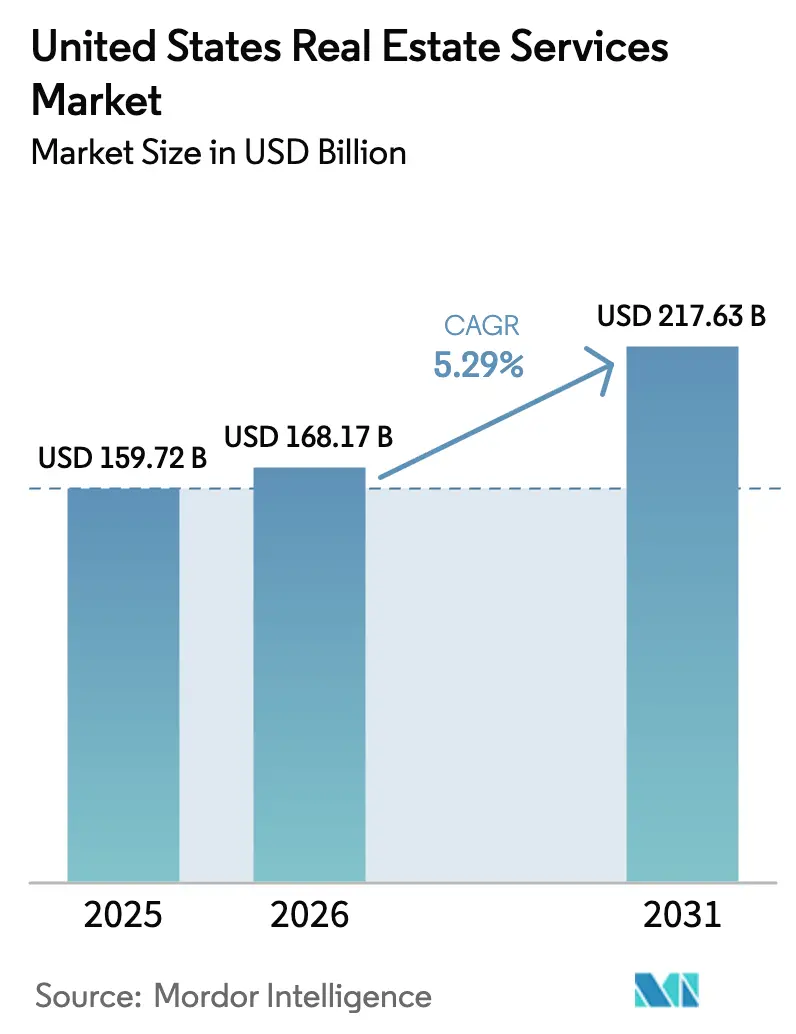
| Base Year Market Size (2025) | USD 159.72 Billion |
| Market Size (2026) | USD 168.17 Billion |
| Market Size (2031) | USD 217.63 Billion |
| Growth Rate (2026 - 2031) | 5.29% CAGR |
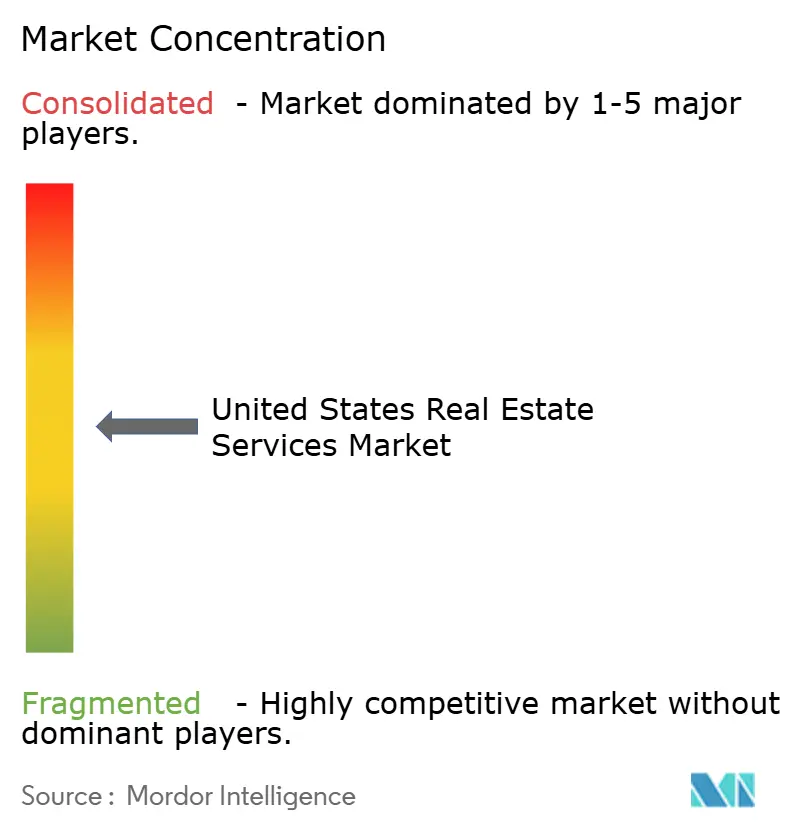
| Market Concentration | Medium |
Major Players *Disclaimer: Major Players sorted in no particular order Image © Mordor Intelligence. Reuse requires attribution under CC BY 4.0. | |
United States Real Estate Services Market Analysis by Mordor Intelligence
The United States Real Estate Services Market size is expected to grow from USD 159.72 billion in 2025 to USD 168.17 billion in 2026 and is forecast to reach USD 217.63 billion by 2031 at 5.29% CAGR over 2026-2031.
Residential transactions still dominate fee income, yet institutional outsourcing and technology adoption are shifting the revenue mix toward higher-margin management and advisory work. Institutional investors are reallocating operating budgets toward third-party specialists to gain access to analytics platforms, while build-to-rent portfolios are scaling quickly and require centralized oversight. Brokerage models are under price pressure after the Sitzer-Burnett settlement, and firms that cannot prove differentiated service are losing listings to flat-fee competitors. Mortgage rates have eased from their 2024 peaks, unlocking pent-up buyer demand, but the lingering lock-in effect keeps existing-home supply tight. Companies that bundle brokerage, management, and mortgage solutions are gaining market share because clients want a single accountable provider.
Key Report Takeaways
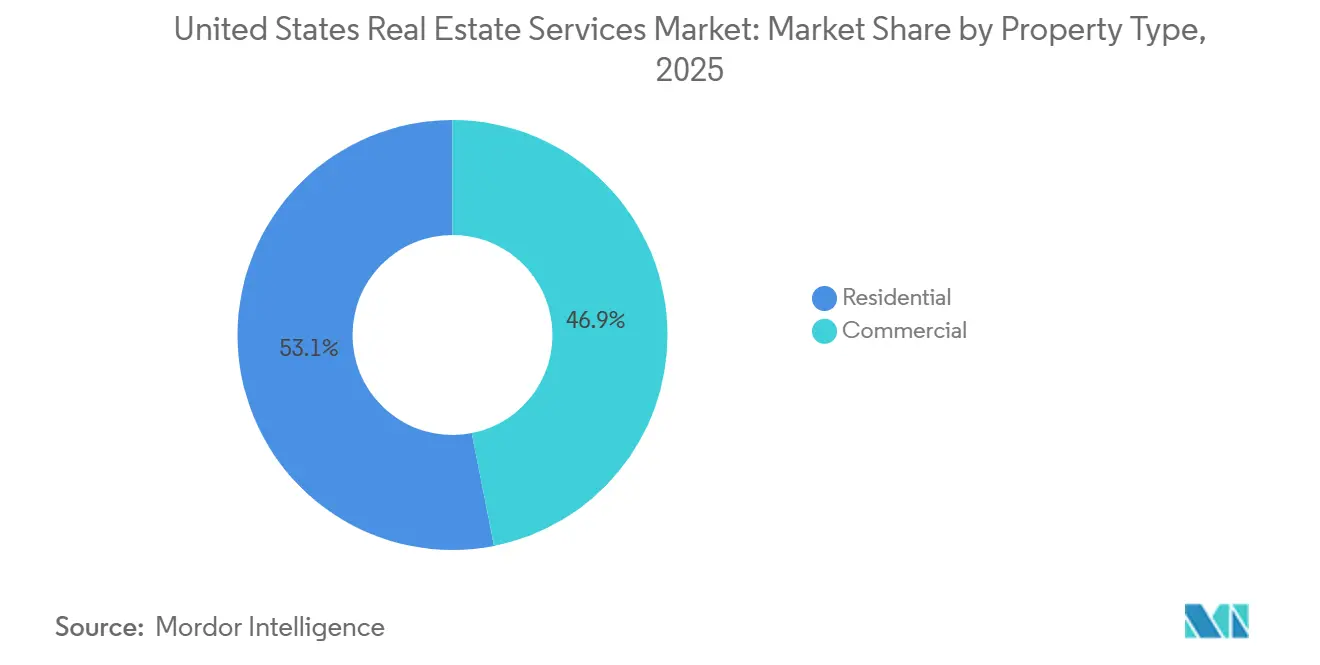
- By property type, residential assets captured 53.1% of the United States real estate services market share in 2025, while commercial segments are projected to expand at a 5.77% CAGR through 2031.
- By service, brokerage commanded 43.9% of the United States real estate services market size in 2025, while property management is forecast to grow at a 5.94% CAGR through 2031.
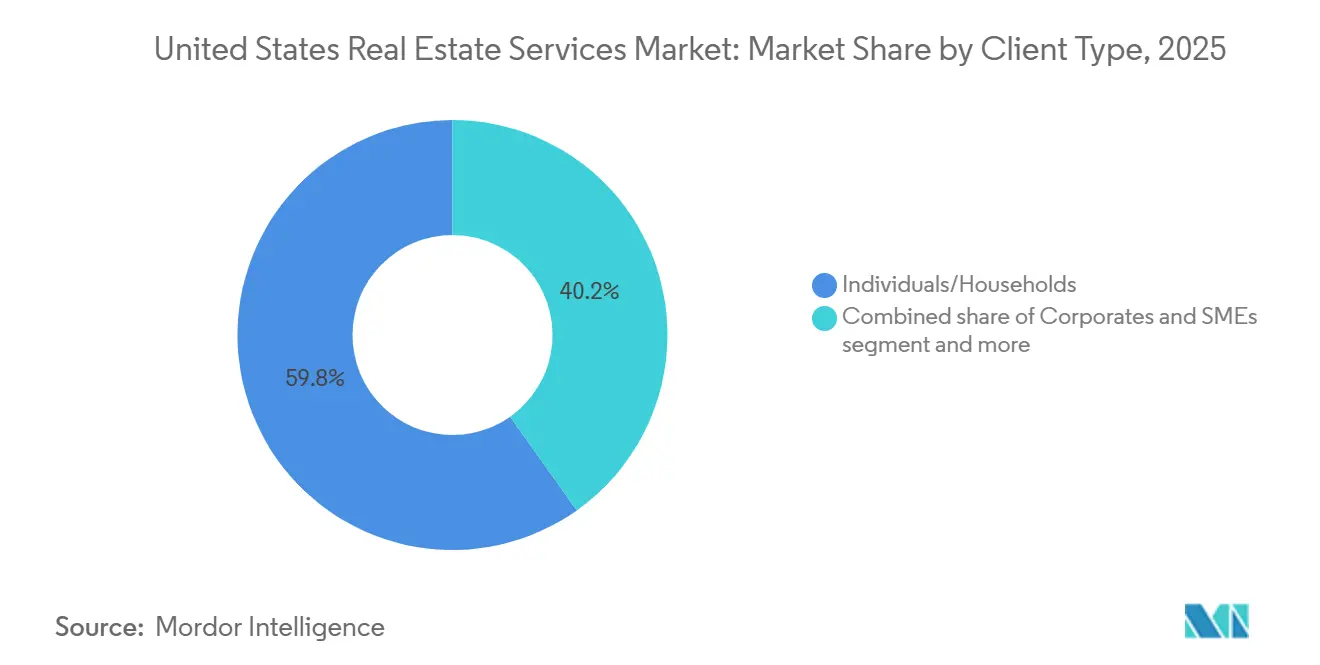
- By client type, individuals and households accounted for 59.8% of 2025 spending, whereas corporates and SMEs are advancing at a 6.08% CAGR to 2031.
- By state, California generated 20.9% of 2025 revenue, and Texas is projected to post the fastest growth at a 6.39% CAGR between 2026-2031.
Note: Market size and forecast figures in this report are generated using Mordor Intelligence’s proprietary estimation framework, updated with the latest available data and insights as of January 2026.
United States Real Estate Services Market Trends and Insights
Drivers Impact Analysis*
| Drivers | (~) % Impact on CAGR Forecast | Geographic Relevance | Impact Timeline |
|---|---|---|---|
| Institutional investors are increasing outsourcing to property and asset managers | +1.2% | National, with concentration in Texas, California, and Florida | Medium term (2-4 years) |
| Growth in build-to-rent and single-family rentals is expanding management volumes | +0.9% | National, strongest in Sun Belt states (Texas, Florida, Arizona, North Carolina) | Long term (≥ 4 years) |
| Strong demand for valuation, appraisal, and advisory services for financing and compliance | +0.8% | National, elevated in high-transaction metros (New York, California, Illinois) | Short term (≤ 2 years) |
| Adoption of digital leasing, e-sign, and AI-enabled brokerage or marketing tools | +0.7% | National, with early-adopter gains in tech-forward markets (California, Washington, Texas) | Medium term (2-4 years) |
| Rising O&M complexity in commercial buildings is boosting facilities and REFM services | +0.6% | National, concentrated in major office and mixed-use markets (New York, California, Illinois, Texas) | Long term (≥ 4 years) |
| Source: Mordor Intelligence | |||
Institutional Investors Increasing Outsourcing to Property and Asset Managers
Large investors are shifting real estate operations from internal teams to specialized third-party managers, which broadens the revenue pool for full-service providers. A 2025 industry survey showed that 61% of firms plan to partner with external managers to gain access to modern data platforms they cannot cost-effectively build on their own. Roughly half of institutional investors already outsource fund administration, and about three-quarters of the rest are evaluating that option. This trend is most visible in complex asset classes such as office conversions and logistics facilities, where seasoned operators can raise net operating income through tenant-experience technology. Some leading service providers have completed “lift-out” deals that move entire in-house teams to the vendor while preserving expertise. Managers who pair integrated software with deep sector knowledge are positioned to win a large share of this outsourcing wave, while generalist firms risk lower margins.
Growth in Build-to-Rent and Single-Family Rentals Expanding Management Volumes
Build-to-rent single-family housing has moved from a niche strategy to a reliable growth engine for property managers. The National Association of Realtors reported that completions in this format reached 90,000 units in 2024, up from 60,000 in 2021, and now represent 8.1% of all single-family starts[1]National Association of Realtors, “Build-to-Rent Housing Report 2025,” nar.realtor. CBRE places the national inventory near 350,000 units and expects institutional owners to expand portfolios by 50% within three years. A January 2025 federal order that eased certain zoning limits accelerated permitting and attracted an estimated USD 60 billion of new capital. Purpose-built BTR communities include centralized leasing offices and technology-enabled tenant services, which create steady fee income that is less volatile than brokerage commissions. A potential risk emerges if large owners choose to manage operations in-house once scale is reached, which could trim third-party demand in more mature regions.
Strong Demand for Valuation, Appraisal, and Advisory for Financing and Compliance
Banks tightened underwriting standards after regional stress events in 2023, and lenders now require more frequent appraisals to meet internal controls and regulatory reviews. On the residential side, refinancing picked up in early 2026 when the average 30-year mortgage rate slipped to 6.01%, unlocking an extra 5.5 million qualifying households[2]Federal Housing Finance Agency, “Monthly Mortgage Rate Survey February 2026,” fhfa.gov . Institutional owners rebalancing away from challenged office assets are also commissioning studies that test conversion and disposition options. The Appraisal Institute notes that demand for MAI-designated professionals is high, especially for complex income-property work[3]Appraisal Institute, “Valuation Outlook 2026,” appraisalinstitute.org . Service firms with deep benches in commercial valuation and compliance support are winning assignments as clients place a premium on defensible, audit-ready reports.
Adoption of Digital Leasing, E-Sign, and AI-Enabled Brokerage or Marketing Tools
Technology is shortening deal cycles and letting agents handle more clients. A 2025 survey by the National Association of Realtors found that 79% of agents use e-signature tools, 46% rely on AI for listing text, and 82% receive positive client feedback on AI-enhanced materials. By 2026, nearly all brokerage professionals reported using at least one AI solution, covering lead scoring, virtual staging, and dynamic pricing. Independent studies suggest entry-level administrative roles could shrink by more than 10% as repetitive tasks become automated, allowing staff to focus on advisory work. Brokerages and managers that invest in integrated platforms improve unit economics and staff retention, while firms that lag face margin pressure and higher turnover.
Restraints Impact Analysis*
| Restraints | (~) % IMPACT ON CAGR FORECAST | Geographic Relevance | Impact Timeline |
|---|---|---|---|
| Transaction slowdowns from high mortgage rates are reducing brokerage revenues | -0.6% | National, with acute impact in high-cost coastal markets (California, New York, Massachusetts) | Short term (≤ 2 years) |
| Commission and fee compression from litigation, regulation, and alternative models | -0.5% | National, with regulatory influence from NAR settlement and state real estate commissions | Medium term (2-4 years) |
| Labor shortages and wage inflation for property management and maintenance roles | -0.4% | National, most severe in fast-growing Sun Belt markets (Texas, Florida, Arizona) and high-cost metros (California, New York) | Medium term (2-4 years) |
| Source: Mordor Intelligence | |||
Transaction Slowdowns from High Mortgage Rates Reducing Brokerage Revenues
Elevated borrowing costs kept many owners from listing properties because they hold mortgages below 4%. The Federal Housing Finance Agency estimates that this “lock-in” trimmed existing-home transactions by up to 1.7 million in 2024 compared with pre-pandemic norms. Although the average rate eased to 6.01% in February 2026, it still doubles early-2022 levels. Brokerages with high fixed costs and limited diversification feel the squeeze most. NAR confirms that 2024 unit sales stayed near multi-decade lows on a per-capita basis, cutting agent income and driving professionals to leave the field. Firms that shift mix toward recurring management fees and advisory work stand on firmer ground during volume slumps.
Commission and Fee Compression from Litigation, Regulation, and Alternative Models
A November 2024 settlement changed how buyer agents are paid, requiring buyers and agents to negotiate compensation separately rather than rely on seller-funded splits. The National Association of Realtors agreed to a USD 418 million payment and new rules mandating signed representation agreements before property tours. The result is faster uptake of flat-fee and à-la-carte services that pull traditional 5–6% commissions lower. Online brands such as Zillow and Redfin have expanded low-fee listing packages, appealing to price-sensitive sellers. Many state commissions are updating disclosure rules, which adds compliance expense. Leading brokerages respond by bundling premium services like staging and legal support to justify higher rates, while also adding budget options for value shoppers. Those without a clear value story risk losing share to tech-enabled rivals.
*Our forecasts treat driver/restraint impacts as directional, not additive. The impact forecasts reflect baseline growth, mix effects, and variable interactions.
Segment Analysis
By Property Type: Institutional Capital Reshapes Commercial Demand
Residential services held 53.1% of 2025 revenue in the United States real estate services market. Commercial assets are forecast to grow 5.77% annually through 2031, powered by investor appetite for logistics, life-science office, and mixed-use conversion projects. Build-to-rent portfolios are expanding fastest, with CBRE projecting 50% growth in inventory by 2027. Property managers who can integrate smart-building sensors and predictive maintenance unlock higher net operating income, an advantage that keeps renewal rates high. Office turnaround work converting class B towers into residential or hotel uses creates complex advisory assignments that favor multidisciplinary firms.
As e-commerce firms pursue next-day delivery, logistics landlords demand tight service-level agreements on facility uptime, pushing management fees above historical averages. Multifamily retains steady momentum, but Sun Belt oversupply is moderating rent growth, reinforcing the need for advanced revenue-management software. Retail assets emphasize experiential design and grocery anchors, maintaining solid occupancy even as enclosed malls retrench. Providers that offer sector-specific talent pools and data analytics capture the lion’s share of cross-selling opportunities, while generalist competitors lose mandates to specialists.


By Service: Management Fees Outpace Transaction Commissions
Brokerage accounted for 43.9% of 2025 revenue in the United States real estate services market share, yet property management is projected to expand at a 5.94% CAGR, the fastest pace among major service lines. Recurring fees tied to gross rents often 8-12% for residential and 3-5% for commercial protect earnings when deal volumes sag. The November 2024 commission ruling has already nudged several leading agents into salaried roles under firms such as Redfin and eXp, stabilizing payroll expenses. Appraisal and valuation revenue is also climbing as lenders raise documentation standards; the Appraisal Institute confirms persistent shortages of senior MAI talent.
Ancillary services, facilities management, workplace strategy, and ESG reporting are growing as corporates seek single-vendor accountability. Deloitte’s 2025 poll showed 61% of owners planning to outsource at least one additional function by 2027. Integrated providers capture higher client lifetime value by bundling brokerage, management, and capital markets advice under a single contract, thereby lowering customer-acquisition costs compared with single-line specialists.
By Client Type: Corporate Outsourcing Accelerates Growth
Individuals and households represented 59.8% of 2025 spending in the United States real estate services market. Corporates and SMEs are advancing at a 6.08% CAGR through 2031 as mid-market firms without in-house departments look to external partners for lease administration and workplace analytics. Mortgage rate relief in early 2026 qualified 5.5 million extra households, briefly boosting consumer transactions, yet lock-in effects still constrain overall listing inventories. Enterprise buyers, in contrast, pursue multi-year outsourcing deals that cover rent audits, facility upgrades, and compliance reporting, underpinning long-term fee visibility for service providers.
Government entities and nonprofits form a small but stable revenue niche, focused on compliance-driven valuations and community redevelopment projects. Providers that segment their sales strategy, self-service digital tools for consumers alongside consultative enterprise teams, are gaining wallet share across client tiers.

Geography Analysis
California remains the single largest state market, but transaction activity in 2026 lags national averages because median home prices in Los Angeles, San Francisco, and San Diego stay above USD 800,000. Service demand shifts toward regulatory advisory work as Title 24 energy codes and local inclusionary zoning rules grow stricter, favoring firms with deep compliance expertise. Life-science office clusters in San Diego and South San Francisco still attract capital, sustaining brokerage and project-management pipelines even as office vacancies elsewhere rise.
Texas posts the fastest growth, propelled by corporate relocations, diverse job creation, and friendly land-use statutes that shorten development cycles. Dallas-Fort Worth and Houston lead in both logistics absorption and build-to-rent deployments, attracting global investors who prefer a single integrated manager across statewide portfolios. Austin sustains above-average fee rates despite tech-sector layoffs, as limited supply upholds pricing power in core neighborhoods.
Florida benefits from retiree and remote-worker inflows, lifting demand for multifamily and single-family rentals. Yet property-insurance spikes, which raised homeowner premiums by 40-60% in several coastal counties, are beginning to curb buying appetites, nudging some owners to rent out units rather than sell. In the Northeast and Midwest, mature markets like New York and Illinois concentrate on asset conversions and industrial redevelopment around logistics corridors, generating advisory assignments rather than large net-new square footage. Secondary metros and rural areas remain the province of regional franchises that know local zoning nuance, a barrier that deters national entrants seeking scale.
Competitive Landscape
Competition is moderate in the United States real estate services market. CBRE, JLL, and Cushman & Wakefield dominate commercial mandates through end-to-end platforms that integrate brokerage, property management, capital markets, and valuation. Residential brokerage is more fragmented, though franchise systems such as Keller Williams, RE/MAX, and Century 21 give independents brand leverage and recruiting scale. Disruptors, including Zillow, Redfin, and eXp Realty, gain share by pairing low commissions with data-driven search tools and in-house mortgage paths, winning cost-sensitive clients.
Strategic moves focus on vertical integration and technology differentiation. CBRE’s February 2026 partnership with an AI maintenance firm promises 8-12% cost savings for institutional landlords, with contracts anchored for the long term. JLL’s USD 1.2 billion management award from a sovereign fund underscores investor preference for one service provider across multi-state logistics assets. Cushman & Wakefield’s October 2025 Sun Belt acquisition added 8 million square feet of multifamily under management, accelerating its exposure to the fastest-growing geography.
Litigation and regulation are compressing traditional commissions, hastening consolidation among smaller brokerages that lack technology budgets. Redfin’s fixed-fee commercial pilot and Zillow’s lending expansion illustrate how digital incumbents are monetizing across the transaction chain. ESG mandates spur new advisory niches; Colliers’ March 2025 launch of a sustainability practice targets owners preparing for net-zero legislation. Competitive advantage increasingly rests on data integration, regulatory fluency, and the ability to cross-sell complementary services through one portal.
United States Real Estate Services Industry Leaders
CBRE Group Inc.
Jones Lang LaSalle (JLL)
Cushman & Wakefield plc
Colliers International Group Inc.
Berkshire Hathaway HomeServices
- *Disclaimer: Major Players sorted in no particular order

Recent Industry Developments
- February 2026: CBRE Group partnered with an AI platform to roll out predictive maintenance and energy-optimization tools across its global management portfolio.
- January 2026: Jones Lang LaSalle secured a USD 1.2 billion property-management mandate from a sovereign wealth fund, covering 15 million sq ft of U.S. logistics space.
- December 2025: Zillow Group extended Zillow Home Loans into 10 more states, taking mortgage coverage to 35 states.
- November 2025: Redfin introduced a USD 5,000 flat-fee commercial brokerage service for small business owners.


United States Real Estate Services Market Report Scope
By Property Type
| Residential | Single-Family |
| Multi-Family | |
| Commercial | Office |
| Retail | |
| Logistics | |
| Others |
By Service
| Brokerage Services |
| Property Management Services |
| Valuation Services |
| Others |
By Client Type
| Individuals / Households |
| Corporates & SMEs |
| Others |
By State
| Texas |
| California |
| Florida |
| New York |
| Illinois |
| Rest of US |
| By Property Type | Residential | Single-Family |
| Multi-Family | ||
| Commercial | Office | |
| Retail | ||
| Logistics | ||
| Others | ||
| By Service | Brokerage Services | |
| Property Management Services | ||
| Valuation Services | ||
| Others | ||
| By Client Type | Individuals / Households | |
| Corporates & SMEs | ||
| Others | ||
| By State | Texas | |
| California | ||
| Florida | ||
| New York | ||
| Illinois | ||
| Rest of US | ||


Key Questions Answered in the Report
What is the current size of the United States real estate services market?
The market stands at USD 168.17 billion in 2026 and is projected to reach USD 217.63 billion by 2031.
How fast is property management growing compared with brokerage fees?
Property management revenue is forecast to grow at a 5.94% CAGR through 2031, outpacing brokerage services that face commission compression.
Which state offers the highest growth opportunity for service providers?
Texas leads with a projected 6.39% CAGR from 2026-2031, thanks to strong population and job gains.
How is technology changing day-to-day real estate service delivery?
E-signatures, AI-generated marketing, predictive maintenance, and integrated lease platforms are reducing turnaround times and cutting operating costs by 8-12%.
What impact did the Sitzer-Burnett settlement have on commissions?
It required buyer-broker fees to be negotiated separately, accelerating the shift to flat-fee and à-la-carte models that are lowering average commission percentages.
Why are institutional investors outsourcing more real estate functions now?
They seek specialized technology, data analytics, and sector expertise that are costly to build in-house, resulting in higher adoption of third-party service contracts.
Page last updated on:


