Harvesting Machinery Market Size and Share
Market Overview
| Study Period | 2021 - 2031 |
|---|---|
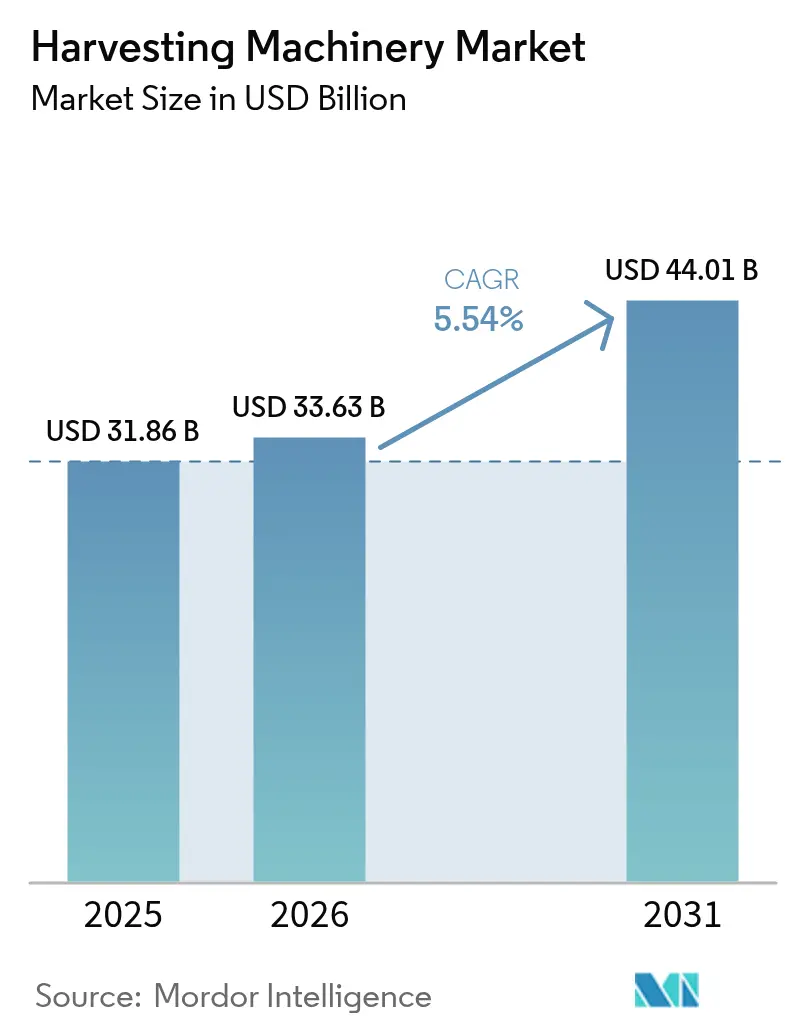
| Market Size (2026) | USD 33.63 Billion |
| Market Size (2031) | USD 44.01 Billion |
| Growth Rate (2026 - 2031) | 5.54% CAGR |
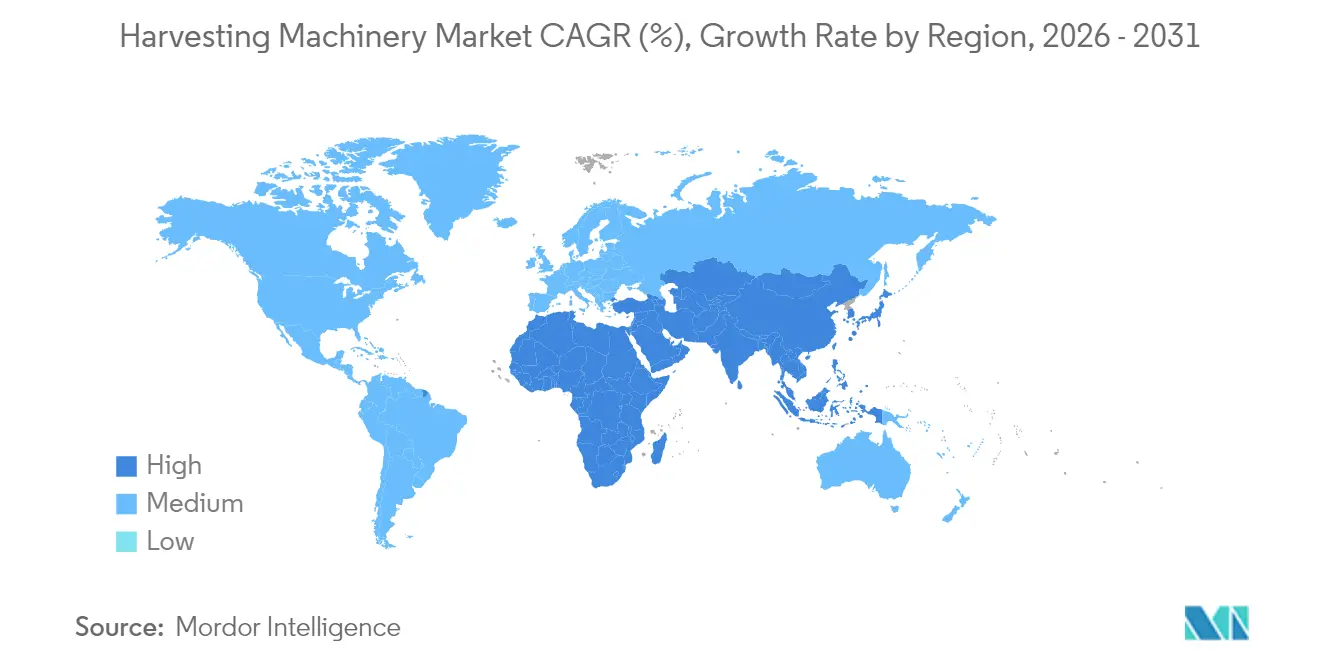
| Fastest Growing Market | Middle East and Africa |
| Largest Market | Asia Pacific |
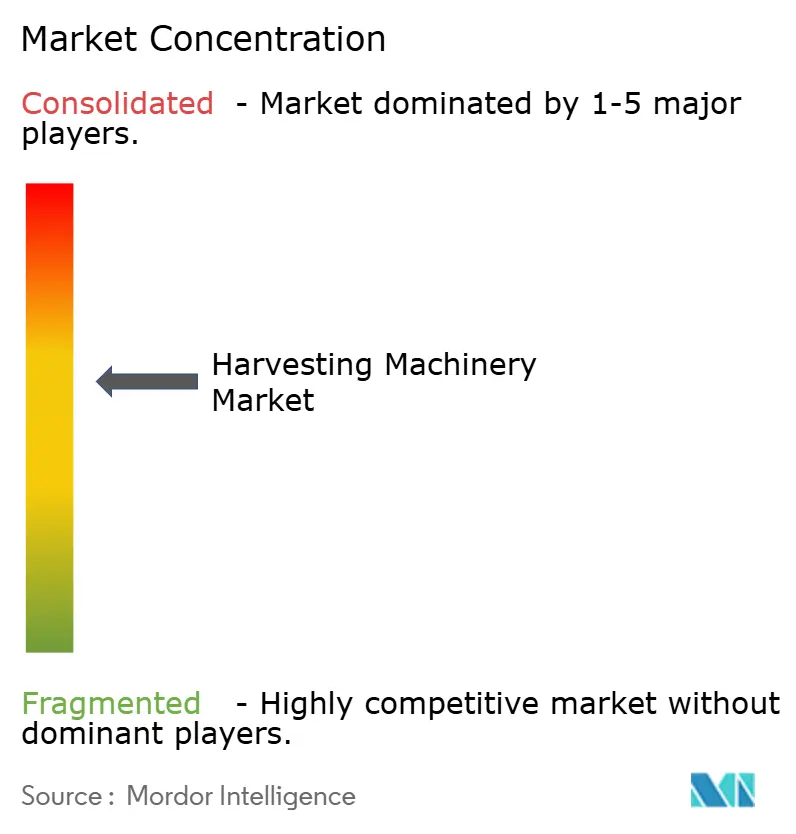
| Market Concentration | Medium |
Major Players *Disclaimer: Major Players sorted in no particular order Image © Mordor Intelligence. Reuse requires attribution under CC BY 4.0. | |
Harvesting Machinery Market Analysis by Mordor Intelligence
The Harvesting Machinery Market size was valued at USD 31.86 billion in 2025 and estimated to grow from USD 33.63 billion in 2026 to reach USD 44.01 billion by 2031, at a CAGR of 5.54% during the forecast period (2026-2031). Growth is propelled by steady mechanization, the spread of precision agriculture, and the arrival of autonomous functions that reduce labor dependence. The Asia-Pacific remains the center of demand, while the Middle East and Africa post the quickest gains as subsidy programs and contract-harvesting models take hold. Diesel engines still dominate powertrains, yet double-digit growth for hybrid and electric solutions signals an important transition that aligns with tightening emissions rules. Crop diversification, particularly the rise of specialty crops, is broadening the application base for sophisticated machinery and creating new revenue streams for data-driven service offerings.
Key Report Takeaways
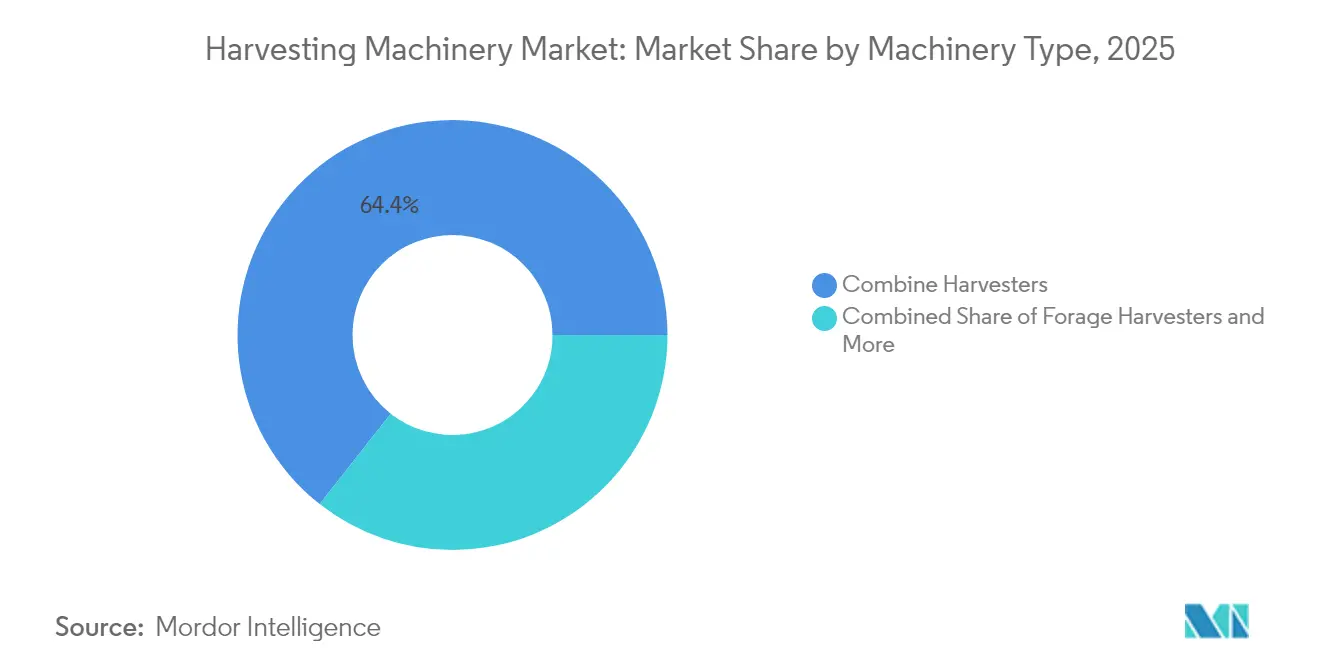
- By machinery type, combine harvesters led with a 64.40% revenue share in 2025, while sugarcane harvesters are forecast to expand at a 7.20% CAGR through 2031.
- By power source, diesel engines held 91.20% of the harvesting machinery market share in 2025, whereas hybrid/electric units are projected to rise at a 11.30% CAGR between 2026-2031.
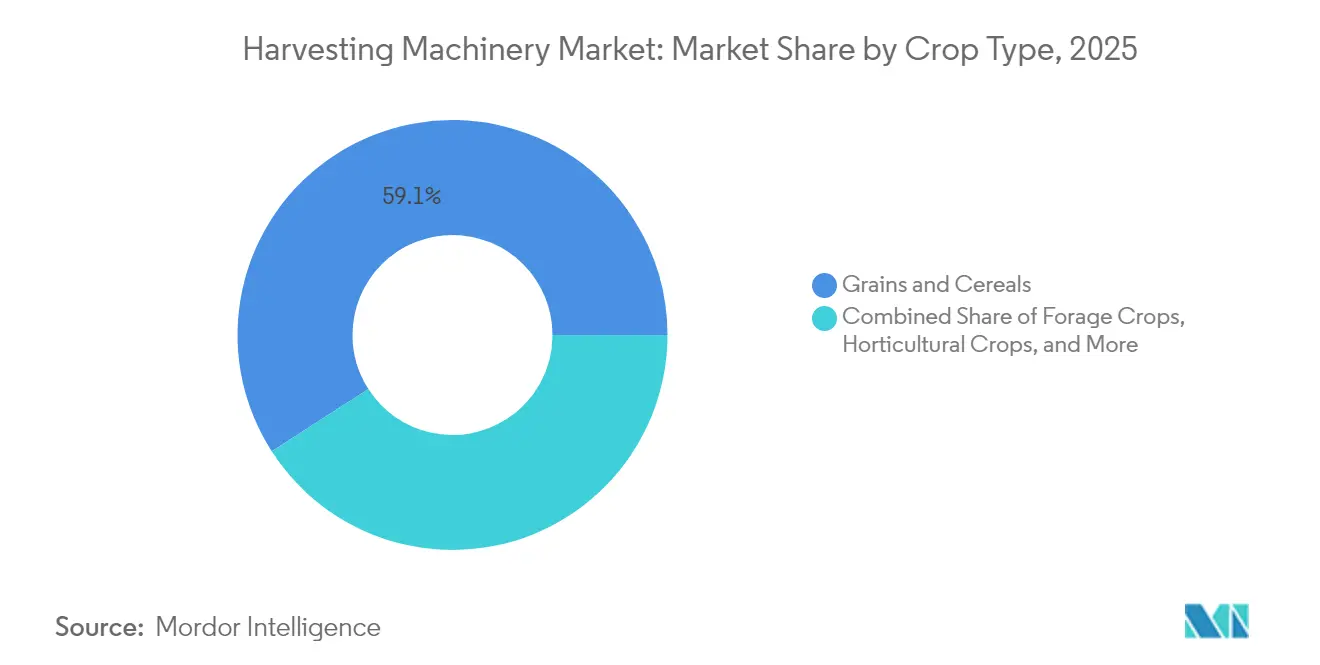
- By crop type, grains and cereals accounted for 59.10% of the harvesting machinery market size in 2025, while specialty crops are advancing at a 8.55% CAGR to 2031.
- By geography, Asia-Pacific commanded 44.60% of the harvesting machinery market in 2025, while the Middle East and Africa is the fastest-growing region with an 7.62% CAGR for 2026-2031.
Note: Market size and forecast figures in this report are generated using Mordor Intelligence’s proprietary estimation framework, updated with the latest available data and insights as of 2026.
Global Harvesting Machinery Market Trends and Insights
Drivers Impact Analysis*
| Driver | (~) % Impact on CAGR Forecast | Geographic Relevance | Impact Timeline |
|---|---|---|---|
| Rising demand for high-capacity combine harvesters | +1.2% | Asia-Pacific | Medium term (2-4 years) |
| Government incentives are accelerating mechanization in developing economies | +0.9% | Africa, South America, South Asia | Long term (≥ 4 years) |
| Labor scarcity and wage inflation are pushing automation | +0.8% | North America, Europe, Australia | Short term (≤ 2 years) |
| Expansion of contract-harvesting business models | +0.7% | Global | Medium term (2-4 years) |
| Integration of precision agriculture and telematics into harvesters | +0.6% | North America, Europe, and advanced Asian markets | Medium term (2-4 years) |
| OEM financing and leasing programmes easing easing capital expenditures burden | +0.5% | Global | Short term (≤ 2 years) |
| Source: Mordor Intelligence | |||
Rising Demand for High-Capacity Combine Harvesters
Mechanical harvesting is gaining momentum across China and India as larger farm clusters emerge and policymakers channel subsidies toward modern equipment. Broad-acre crops harvested with high throughput combine lower post-harvest losses, improve grain quality, and shorten turnaround times between planting cycles. This confluence of scale, technology, and policy is projected to maintain the region’s leadership in combined upgrades through the medium term.
Government Incentives Accelerating Mechanization in Developing Economies
Public-sector grants, tax rebates, and subsidized loans are reshaping the harvesting machinery market, particularly in Africa and parts of South America. National mechanization roadmaps now prioritize harvesters alongside tractors, viewing them as essential to post-harvest loss reduction and food-security targets. Several countries are linking subsidies to domestic assembly conditions, nudging global brands to establish knock-down facilities and engage local partners for after-sales support.
Labor Scarcity and Wage Inflation are Pushing Automation
Farm labor supply has tightened in high-wage economies where seasonal migration patterns have shifted and competing industries offer higher pay. Average agricultural wage costs in North America and Europe climbed by double digits in recent seasons, eroding profitability and compelling growers to replace manual crews with self-leveling, auto-steer, and eventually driverless harvesters.
Integration of Precision Agriculture and Telematics into Harvesters
Modern harvesters now serve as rolling data hubs, collecting yield, moisture, and machine-health metrics in real-time. Cloud connectivity feeds analytics platforms that fine-tune planting prescriptions and fertilizer dosing for subsequent seasons, closing the loop between harvest and input planning. Advanced vision systems adjust ground speed and threshing settings on-the-fly, reducing grain damage and fuel use.
Restraints Impact Analysis*
| Restraint | (~) % Impact on CAGR Forecast | Geographic Relevance | Impact Timeline |
|---|---|---|---|
| High upfront cost versus small-farm income levels | -0.8% | Africa, South Asia, South America | Medium term (2-4 years) |
| Volatility in commodity prices is dampening machinery purchases | -0.7% | Global | Short term (≤ 2 years) |
| Limited dealer and service networks in Africa and the Middle East | -0.5% | Africa, Middle East | Long term (≥ 4 years) |
| Environmental concerns over diesel emissions | -0.4% | Europe, North America | Medium term (2-4 years) |
| Source: Mordor Intelligence | |||
High Upfront Cost Versus Small-Farm Income Levels
Modern combines can cost between USD 300,000 and USD 500,000, a figure beyond the reach of most smallholders. Fragmented land holdings in Africa and South Asia dilute machinery utilization rates and elongate payback periods. Acute financing gaps widen technology adoption divides and sustain a secondary market for aging, high-emission machines that underperform on fuel and grain quality.
Limited Dealer and Service Networks in Africa and the Middle East
Equipment downtime during harvest windows can erase yield gains. Sparse dealer footprints and deficient road infrastructure inflate response times and parts logistics costs. Farmers often opt for simpler, locally serviceable machines even if performance lags current-generation imports. Success hinges on aligning service models with local agronomic calendars and building parts hubs that cut over-the-counter wait times.
*Our forecasts treat driver/restraint impacts as directional, not additive. The impact forecasts reflect baseline growth, mix effects, and variable interactions.
Segment Analysis
By Machinery Type: Combine Harvesters Lead
Combine harvesters generated the highest revenue in 2025, accounting for 64.40% of the harvesting machinery market. Continuous improvements in sensing modules and automation packages now enable operators to delegate most threshing, separation, and cleaning adjustments to software, which raises throughput while conserving fuel. The cost-benefit proposition drives replacement demand among commercial farms facing tighter labor markets. Rising yield penalties from manual cutting, plus health and safety rules, strengthen the case for self-propelled cane machines in these regions.
In contrast, sugar-cane harvesters, though smaller in volume, are forecast to post a 7.20% CAGR to 2031 as Brazil, India, and Thailand expand the acreage under mechanized cane. Rising yield penalties from manual cutting, plus health and safety rules, strengthen the case for self-propelled cane machines in these regions. Manufacturers tailor sugar-cane models for narrow-row layouts, steep slopes, and wetter soils, integrating telematics that report billet length uniformity and extractor-fan speed. Such crop-specific refinements support premium pricing. Forage harvesters, essential for dairy ration quality, maintain mid-single-digit growth as operators upgrade to models with precision chop length control and silage-inoculant applicators.


By Power Source: Electric Transition Accelerates Despite Diesel Dominance
Diesel engines retained 91.20% of the harvesting Machinery market share in 2025, thanks to unmatched energy density and a vast refueling network. The hybrid and fully electric platforms are advancing at a 11.30% CAGR as battery cost curves fall and regulatory caps on particulate emissions tighten. Harvesting machinery market size for electric and hybrid segments is projected to grow by 2030, driven by pilot programs on high-value specialty crops where quiet operation and zero local emissions offer agronomic and community benefits. Early adopters report lower maintenance expenses due to reduced moving parts, while regenerative braking and power-assist systems cut daily fuel or electricity use.
By Crop Type: Specialty Crops Drive Innovation Despite Grain Dominance
Grains and cereals accounted for 59.10% of global revenues in 2025, reflecting installed bases of large-scale combines across the Americas, Europe, and Australia. Nonetheless, specialty crops fruits, vegetables, and nuts are the engine of growth, expanding at a 8.55% CAGR. Delicate produce demands machine-vision systems that detect ripeness, robotic grapples that avoid bruising, and end-effectors that self-clean between picks. Investments in such technology rose sharply, with growers citing labor scarcity and quality premiums in fresh markets.
Geography Analysis
Asia-Pacific anchors 44.60% of the harvesting machinery market and continues to outpace global averages through 2031. Rapid consolidation of cropland in China and growing contract-harvesting fleets in India stimulate continual fleet renewal. Provincial subsidies in China reimburse up to 30% of eligible machine costs, influencing technology choices toward models with precision guidance that aligns with national yield-improvement targets.
The Middle East and Africa is the fastest-growing region at an 7.62% CAGR between 2026 and 2031. Governments prioritize mechanization to secure grain self-sufficiency and reduce post-harvest losses that can exceed 20% in smallholder systems. Import-duty waivers on components and credit guarantees for cooperative fleets aim to leverage scale effects. The Middle East remains an emerging locale where controlled-environment agriculture and government-backed desert farming require specialized harvesters for greenhouse tomatoes, leafy greens, and date palms. Investment incentives and free-zone logistics encourage multinational brands to position regional distribution hubs, closing lead-time gaps and fostering parts availability.
North America and Europe contribute a combined quarter of global sales but differ in replacement dynamics. North American growers focus on integrating autonomy and connectivity into existing fleets, leading to a rise in retrofit kits that extend asset life while delivering advanced functionality. Europe, guided by stringent emissions rules and Common Agricultural Policy incentives, accelerates the adoption of hybrid and electric units.

Competitive Landscape
The harvesting machinery market is characterized by medium concentration. Deere & Company, CNH Industrial, and AGCO Corporation together account for more than 50% of worldwide sales[3]AGCO Corporation, “Q2 2024 Earnings Release,” farm-equipment.com. Their scale advantages span R&D budgets, captive financing, and dealer reach, yet each faces revenue pressure from cyclical softening in farm income. Deere reported USD 7.1 billion net income in 2024, down markedly from the prior year, and signaled another decline in 2025.
Technology differentiation has become the core battleground. Market leaders invest in AI-enabled harvest settings, yield-monitoring sensors, and cloud-based agronomic portals. Partnerships with satellite imagery firms and telematics specialists expand datasets and enhance predictive maintenance. Start-ups targeting specific crops or autonomous navigation offer niche solutions that incumbents either license or acquire to accelerate roadmaps.
Service innovation is equally critical. Dealers now offer uptime guarantees, remote diagnostics, and subscription-based software packages that bundle agronomic advice with machine performance analytics. Contract-harvest service providers emerge as influential buyers who value low lifetime cost, rapid parts delivery, and cross-brand fleet management tools.
Harvesting Machinery Industry Leaders
Deere & Company
CNH Industrial N.V
AGCO Corporation
CLAAS KGaA mbH
Kubota Corporation
- *Disclaimer: Major Players sorted in no particular order

Recent Industry Developments
- May 2025: SDF inaugurated a new building to house its sales, administrative, service, and R&D offices at its German site in Lauingen. This move reaffirms SDF's commitment to its operations in Germany, including the development of harvesting machines.
- March 2025: CNH (Case IH & New Holland) marked 50 years of Twin Rotor combine technology with the CR10 and CR11 models; the flagship CR11 features 775 hp and a 20,000-litre grain tank New Holland.
- March 2025: CNH (Case IH & New Holland) unveiled a two-row sugarcane harvester in field testing alongside Patriot Series 50 sprayers that cut herbicide use by more than 80% Case IH.
- February 2025: Deere introduced a new three-piece CAM reel with dense pack fingers designed to improve harvesting efficiency, especially in challenging crops like pulses and edibles.


Research Methodology Framework and Report Scope
Market Definitions and Key Coverage
Our study defines the global harvesting machinery market as all newly manufactured self-propelled, tractor-mounted, or trailed machines whose primary role is to cut, lift, thresh, or chop crops at physiological maturity; this covers combine harvesters, forage harvesters, and dedicated units for sugarcane, beet, potato, and cotton, with values reported in USD and units shipped.
Scope Exclusions: Used-equipment sales, rental fleets, pre-harvest implements, and post-harvest tools such as balers or dryers are outside the model.
Segmentation Overview
- By Machinery Type
- Combine Harvesters
- Forage Harvesters
- Other Harvesters (Sugarcane Harvesters, Potato Harvesters, Beet Harvesters, Cotton Harvesters, etc.)
- By Power Source
- Diesel
- Hybrid/Electric
- By Crop Type
- Grains and Cereals
- Forage Crops
- Horticultural Crops
- Speciality Crops (Sugarcane, Cotton, and Others)
- By Geography
- North America
- United States
- Canada
- Mexico
- Rest of North America
- Europe
- Germany
- United Kingdom
- France
- Spain
- Russia
- Rest of Europe
- Asia-Pacific
- China
- India
- Japan
- Rest of Asia-Pacific
- South America
- Brazil
- Argentina
- Rest of South America
- Middle East and Africa
- Saudi Arabia
- UAE
- Turkey
- South Africa
- Rest of Middle East and Africa
- North America
Detailed Research Methodology and Data Validation
Primary Research
Mordor analysts interviewed dealer principals, OEM product managers, large-farm fleet supervisors, and ag-lending officers across North America, Europe, Asia-Pacific, and Latin America, gathering insights on utilization cycles, horsepower splits, and emerging hybrid-drive adoption that desk research alone cannot surface.
Desk Research
We begin by collating public fundamentals: crop-wise production and trade data from FAOSTAT, UN Comtrade, and Eurostat; equipment registration records from USDA NASS and China's MARA; and subsidy details from World Bank agriculture programs. Company 10-Ks, investor decks, and shipment intelligence from Volza refine average selling prices. Proprietary snapshots from D&B Hoovers and Dow Jones Factiva let us align maker revenues with regional channel spreads. The sources listed are illustrative; many additional references were tapped for corroboration and gap checks.
Market-Sizing & Forecasting
A top-down acreage-to-demand reconstruction converts harvested hectares and yield patterns into machine need, which is then reconciled with replacement cycles and fleet age. Supplier roll-ups, dealer channel checks, and sampled ASP × unit calculations provide a bottom-up sense-check, anchoring the baseline value. Core variables include harvested grain area, farm-labor costs, diesel prices, combine replacement age, subsidy intensity, and hybrid-drive penetration. Forecasts employ multivariate regression blended with scenario analysis, reflecting weather variability and technology uptake flagged by experts.
Data Validation & Update Cycle
Every model passes automated variance flags, peer analyst audits, and senior sign-off before release. Reports refresh annually, with interim updates triggered by material policy or pricing shocks; a final pre-publication sweep ensures clients always see the latest view.
Why Mordor's Agricultural Harvesting Machinery Baseline Commands Reliability
Published figures often diverge because providers bundle different machines, apply varied price bases, or refresh at unequal intervals.
By anchoring on crop-linked demand pools and validating through live dealer intel, Mordor Intelligence offers a traceable midpoint decision-makers can lean on.
Benchmark comparison
| Market Size | Anonymized source | Primary gap driver |
|---|---|---|
| USD 31.86 B (2025) | Mordor Intelligence | - |
| USD 48.30 B (2025) | Regional Consultancy A | Broader scope includes picker attachments; relies mainly on revenue extrapolation. |
| USD 41.73 B (2025) | Industry Journal B | Combines sugarcane and specialty harvesters; straight-line growth from 2024 base. |
These comparisons show that by selecting a clear scope, mixing top-down acreage logic with bottom-up cross-checks, and updating yearly, Mordor provides the balanced, transparent baseline that strategy teams require.


Key Questions Answered in the Report
What is the current size of the harvesting equipment market?
The harvesting equipment market is worth USD 33.63 billion in 2026 and is projected to rise to USD 44.01 billion by 2031.
Which machinery type dominates global revenues?
Combine harvesters lead, accounting for 64.40% of 2025 revenue, supported by continual automation upgrades.
How fast are hybrid and electric harvesters growing?
Hybrid and electric solutions are expanding at a 11.30% CAGR between 2026 and 2031, driven by emissions regulations and fuel-savings goals.
Why is Africa the fastest-growing regional market?
Government mechanization initiatives, subsidy programs, and contract-harvest models underpin Africa’s 7.62% CAGR forecast for 2026-2031.
Who are the leading companies in the market?
Deere & Company, CNH Industrial, and AGCO Corporation collectively hold more than half of global sales, with each investing heavily in precision agriculture and autonomy.
What is the main barrier to adoption for small farms?
High upfront equipment cost relative to farm income remains the key hurdle, prompting cooperative ownership and pay-per-use service models.
Page last updated on:


