Government And Education Logistics Market Size and Share
Market Overview
| Study Period | 2020 - 2031 |
|---|---|
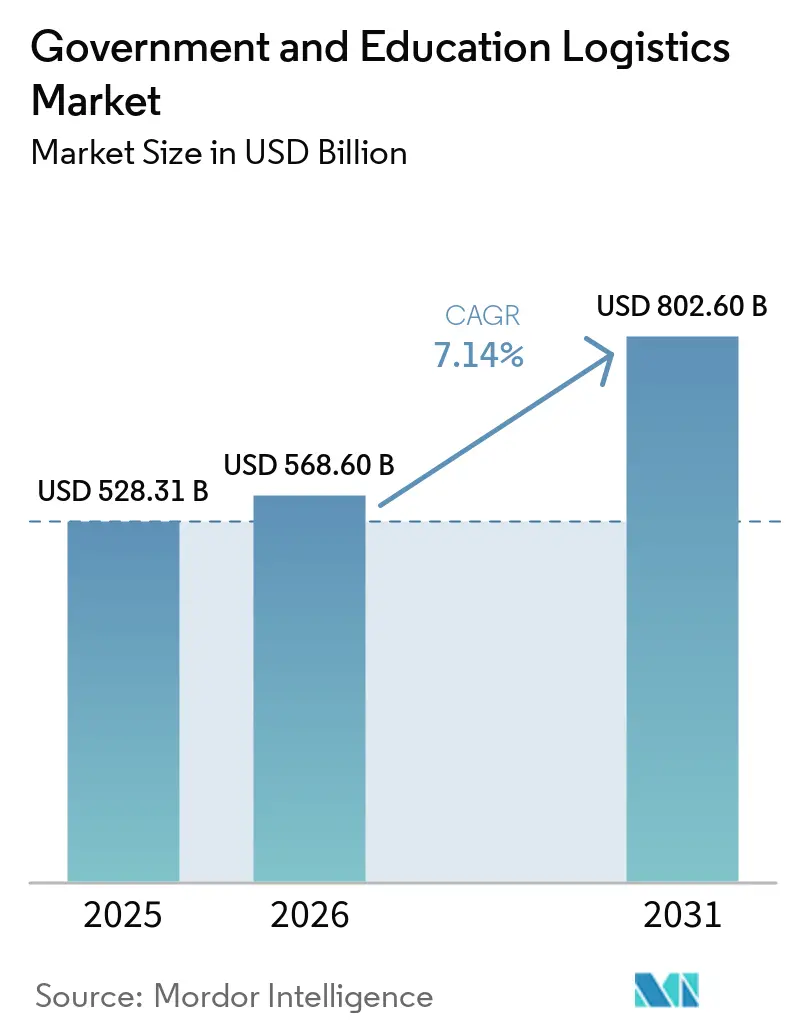
| Market Size (2026) | USD 568.60 Billion |
| Market Size (2031) | USD 802.60 Billion |
| Growth Rate (2026 - 2031) | 7.14% CAGR |
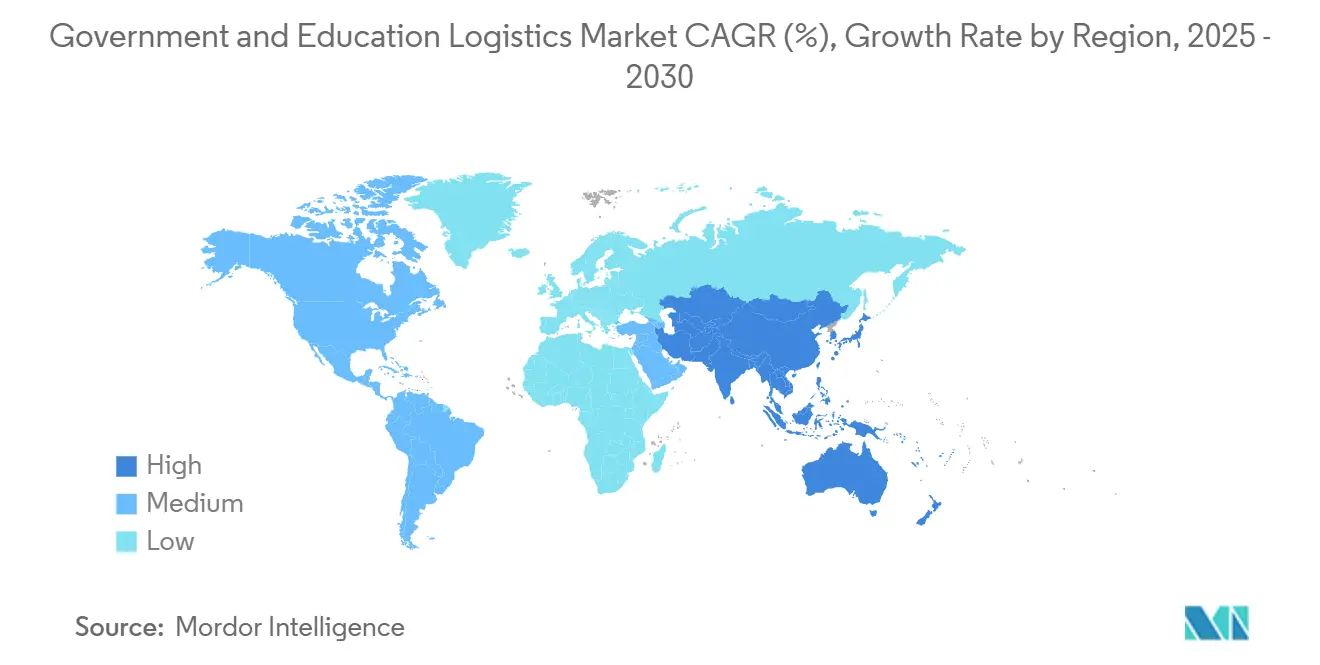
| Fastest Growing Market | Asia Pacific |
| Largest Market | Asia Pacific |
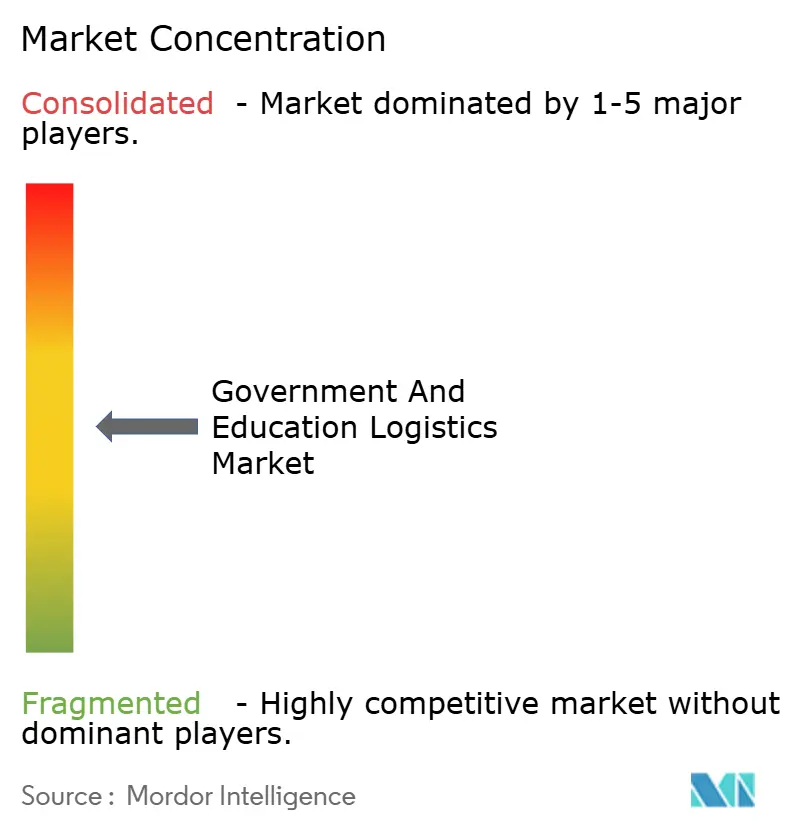
| Market Concentration | Medium |
Major Players
*Disclaimer: Major Players sorted in no particular order Image © Mordor Intelligence. Reuse requires attribution under CC BY 4.0. |
|
Government And Education Logistics Market Analysis by Mordor Intelligence
The government and education logistics market size is expected to increase from USD 528.31 billion in 2025 to USD 568.60 billion in 2026 and reach USD 802.60 billion by 2031, growing at a CAGR of 7.14% over 2026-2031.
Public-sector buyers are shifting from lowest-price contracting toward network resilience, emissions reduction, and digital transparency. Consolidation is accelerating, exemplified by UPS replacing FedEx as the U.S. Postal Service’s primary air-cargo partner in 2024 and DSV’s USD 16.2 billion purchase of DB Schenker in 2025, as agencies reward providers that combine global reach with compliance depth. Mandated decarbonization, satellite-campus expansion in emerging regions, and blockchain-based asset tracking are expanding service scope well beyond basic freight, while U.S. Cybersecurity Maturity Model Certification (CMMC) 2.0 and the European Union’s Green Public Procurement (GPP) directive raise entry barriers for carriers lacking capital to modernize. Despite near-term headwinds from container-capacity volatility and clearance-talent shortages, the government and education logistics market benefits from multi-year contracts that buffer revenue against cyclical freight downturns.[1]Government of India. "Government e-Marketplace (GeM)." Accessed April 2026. https://gem.gov.in.
Key Report Takeaways
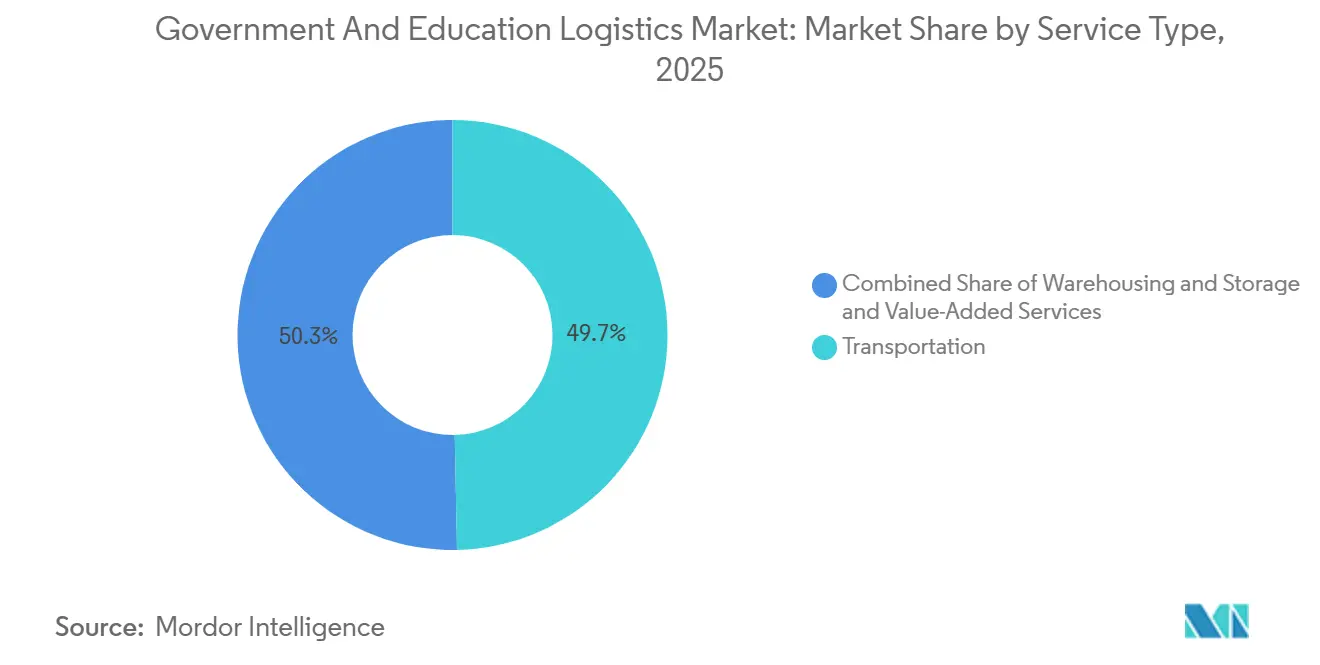
- By service type, Transportation held 49.66% of the government and education logistics market share in 2025, while Value-Added Services is projected to expand at a 10.57% CAGR through 2031.
- By end user, State & Local Government led with 29.17% revenue share in 2025; Public Education (K-12) is forecast to grow at a 9.41% CAGR to 2031.
- By geography, Asia-Pacific accounted for a 40.67% share of the government and education logistics market size in 2025 and is expected to advance at an 8.60% CAGR over 2026-2031.
Note: Market size and forecast figures in this report are generated using Mordor Intelligence’s proprietary estimation framework, updated with the latest available data and insights as of January 2026.
Global Government And Education Logistics Market Trends and Insights
Drivers Impact Analysis*
| Drivers | (~) % Impact on CAGR Forecast | Geographic Relevance | Impact Timeline |
|---|---|---|---|
| Mandated Decarbonization & Green-Procurement Targets | +1.2% | Europe, North America, APAC (China, Japan, South Korea) | Medium term (2-4 years) |
| Post-Pandemic Contingency Planning for Resilient Public Supply Chains | +0.9% | Global, with the highest intensity in North America, Europe | Short term (≤ 2 years) |
| Expansion of Satellite Campuses in Emerging Countries Creating New Logistics Corridors | +1.0% | APAC (India, China, Southeast Asia), the Middle East, and Latin America | Long term (≥ 4 years) |
| Growth in Defense R&D Partnerships with Universities Driving Classified Material Flows | +0.7% | North America, Europe, APAC (Australia, South Korea) | Medium term (2-4 years) |
| Blockchain-Based Credential & Asset Tracking Adoption Across Government Inventories | +0.8% | North America, Europe, APAC (Singapore, UAE) | Medium term (2-4 years) |
| Rural Broadband Stimulus Fueling Large-Scale Educational Equipment Deployments | +1.1% | North America, APAC (India, Indonesia), Latin America (Brazil, Peru) | Short term (≤ 2 years) |
| Source: Mordor Intelligence | |||
Mandated Decarbonization & Green-Procurement Targets
Public agencies now embed emissions caps and local-content rules into every tender. The EU's Clean Vehicles Directive, with mandatory procurement targets for 2025 and 2030, obliges members to favor electric vehicles and rail, while U.S. states such as Maryland require carbon disclosure for logistics serving public construction.[2]European Commission, “Green Public Procurement Criteria,” europa.eu International Institute for Sustainable Development analysis shows green rules have successfully driven down supply chain emissions but lifted upfront contract costs, prompting agencies to sign longer-term deals so carriers can amortize low-carbon fleets. Smaller haulers unable to finance electric trucks are exiting bids, concentrating volumes with global integrators.
Post-Pandemic Contingency Planning for Resilient Public Supply Chains
After COVID-19 shortages, governments treat logistics resilience as a national security priority rather than just a procurement efficiency lever. Building on executive actions such as the establishment of the White House Council on Supply Chain Resilience, federal agencies are increasingly directed to map critical dependencies and prioritize dual-sourcing.[3]The White House, “Executive Order on Supply Chain Resilience,” whitehouse.gov Specific initiatives, such as the Department of Health and Human Services’ push to decentralize and expand the Strategic National Stockpile through split-warehouse networks and vendor-managed inventory, have boosted logistics leasing in secondary markets. Furthermore, federal procurement guidelines are increasingly favoring carriers with robust, redundant domestic networks. While prioritizing buffer stock and network redundancy inherently lifts total logistics costs, these investments remain non-negotiable for public procurement officers determined to avoid repeat disruptions.
Expansion of Satellite Campuses in Emerging Countries Creating New Logistics Corridors
Branch campuses are proliferating in Asia and the Gulf. India’s National Education Policy and the Digital India program encourage foreign universities, each new site needing inbound flows of library collections, lab equipment, and hundreds of student devices. China’s Belt and Road Initiative has funded numerous university tie-ups over recent years, generating demand for the temperature-controlled movement of scientific instruments. Contracts typically span five to seven years and require providers that combine customs brokerage with warehousing near ports of entry.
Growth in Defense R&D Partnerships with Universities Driving Classified Material Flows
U.S. Department of Defense University Affiliated Research Centers handle hypersonics and quantum projects that move prototypes between labs under strict International Traffic in Arms Regulations (ITAR) guard. Security-cleared drivers earn significant wage premiums, and the lengthy processing times required to secure new clearances heavily constrain hiring cycles for logistics providers. Carriers holding Top-Secret facilities and Nuclear Regulatory Commission permits face less competition and capture premium margins for time-definite moves linking campuses with test ranges.
Restraints Impact Analysis*
| Restraints | (~) % Impact on CAGR Forecast | Geographic Relevance | Impact Timeline |
|---|---|---|---|
| Global Container-Capacity Volatility Impacting Cost Predictability | -0.6% | Global, with highest exposure in Asia-Europe and Trans-Pacific lanes | Short term (≤ 2 years) |
| Shortage of Security-Cleared Logistics Personnel | -0.4% | North America, Europe, APAC (Australia, South Korea) | Medium term (2-4 years) |
| Fragmented Last-Mile Infrastructure in Low-Density Education Districts | -0.3% | North America (rural U.S., Canada), APAC (India, Indonesia), Latin America | Medium term (2-4 years) |
| Escalating Cybersecurity Mandates Increasing IT Integration Costs | -0.5% | Global, with highest compliance burden in North America, Europe | Short term (≤ 2 years) |
| Source: Mordor Intelligence | |||
Global Container-Capacity Volatility Impacting Cost Predictability
Red Sea security incidents and drought-affected Panama Canal transits have lengthened routes and inflated bunker fuel costs by up to 40% since 2024. Public buyers insist on fixed prices, so carriers absorb volatility or risk losing bids. Smaller forwarders absent hedging programs exit tenders, further consolidating the government and education logistics market around integrators able to cushion spot spikes.
Shortage of Security-Cleared Logistics Personnel
While the Defense Counterintelligence and Security Agency (DCSA) has improved clearance processing times in recent years, the months-long wait required to secure Secret and Top Secret clearances continues to delay contract start-ups. Consequently, security-cleared logistics personnel command significant wage premiums, and the government and education logistics industry faces a persistent, competitive talent gap, particularly for highly specialized roles such as ITAR-certified freight brokers and cleared warehouse supervisors.
*Our forecasts treat driver/restraint impacts as directional, not additive. The impact forecasts reflect baseline growth, mix effects, and variable interactions.
Segment Analysis
By Service Type: Value-Added Services Expand Beyond Freight
Value-Added services accounted for the fastest growth in 2025 and are forecast to rise at a 10.57% CAGR through 2031, while Transportation retained the largest 49.66% slice of the government and education logistics market share in 2025. Agencies now expect reverse logistics for refurbished laptops, kitting for pre-portioned school meals, and compliance labeling for controlled goods. U.S. Environmental Protection Agency circular-procurement rules require de-installation, secure transport, and certified data wiping of end-of-life devices, creating premium demand for providers that track assets from pickup through resale.[4]U.S. Environmental Protection Agency, “Circular Economy for Federal IT,” epa.gov
Growing reliance on robotics and radio-frequency identification boosts the government and education logistics market size for integrated service suites. UPS equipped all U.S. package cars with RFID readers in 2025, giving public buyers real-time inventory visibility for research prototypes. Automation lowers unit fulfillment cost, letting carriers bundle warehousing, refurbishment, and distribution into multi-year contracts priced below in-house benchmarks. Transportation remains indispensable, especially road haulage for short-haul deliveries and rail for long-distance bulk moves, yet the margin frontier is shifting toward tech-enabled value-added services with double-digit profit potential.


By End User: Public Education (K-12) Leads Future Expansion
State & Local Government represented 29.17% of 2025 spend, but Public Education (K-12) is expected to post the strongest 9.41% CAGR between 2026-2031, driven by broadband rollouts, one-to-one device programs, and expanded meal services. The government and education logistics market size allocated to K-12 shipments climbs as the FCC's E-Rate and connectivity programs fund millions of routers and tablets destined for remote households. Each device needs asset tagging, individual packaging, and tracked delivery, forcing carriers to refine last-mile networks that reach sparsely populated zip codes within strict grant deadlines.
Higher Education, Defense Agencies, and Federal Civilian departments continue to sign five-plus-year agreements emphasizing compliance over speed, preserving baseline volume. Yet growth concentrates where stimulus dollars flow: school nutrition and rural connectivity. Cold-chain capacity rises to serve summer meal programs in an expanding network of rural U.S. districts. Cross-border demand emerges as Southeast Asian ministries import laboratory kits and English-language textbooks for new satellite campuses. Providers capable of integrating customs brokerage with proof-of-delivery reporting stand to gain share.
Geography Analysis
Asia-Pacific held 40.67% of 2025 revenue and is projected to grow at an 8.60% CAGR to 2031, underpinned by India’s Government e-Marketplace, China’s Belt and Road university projects, and Southeast Asia’s digital-campus boom. India processed more than USD 30 billion in public purchases on GeM during 2025, and embedded real-time vendor scoring now rewards logistics firms that meet aggressive on-time metrics. Chinese partnerships across Central Asia funnel scientific instruments through bonded corridors, and the Association of Southeast Asian Nations' duty harmonization lifts intra-regional textbook flows. Australia and South Korea add ITAR-compliant traffic as defense research proliferates, while Japan pilots autonomous on-campus delivery robots within its Society 5.0 program.
North America remains the contractual anchor of the government and education logistics market, supported by U.S. federal spending that topped USD 700 billion in 2024 and Canadian provincial investments in rural broadband. The U.S. General Services Administration is consolidating contract vehicles under OASIS+ and Polaris, trimming the field of eligible bidders yet streamlining procurement cycles. secured the primary USPS air-cargo slot in 2024, demonstrating that integrated ground-and-air networks matter more than legacy tenure. Mexico’s nearshoring surge attracts cross-border education-equipment flows, although customs chokepoints and California port congestion still test schedule reliability.
Europe’s outlook hinges on tightening environmental regulations, such as the Clean Vehicles Directive, which forces public buyers to prioritize low-carbon and zero-emission lanes. This requirement pushes many traditional carriers to upgrade their fleets or form joint ventures to remain compliant with green public procurement standards. BENELUX and Nordic states are early adopters of digitized e-CMR (electronic consignment notes), obliging 3PLs to integrate with advanced digital tracking platforms for asset provenance. Eastern European education infrastructure receives EU cohesion funds, yet currency volatility and regulatory fragmentation complicate pricing, compelling carriers to add risk premia or cap exposure.
Mordor Intelligence provides coverage of the government and education logistics market across other key regional markets, including Asia, North America, Europe, Middle East, and Africa, each with their regulatory frameworks and demand patterns. Detailed country-level analysis extends to India, Canada, United Kingdom, Germany, and Spain incorporating local coverage and market participation, as required.

Competitive Landscape
Competition in the government and education logistics market is moderate, with the top 20 providers generating about one-third of global revenue. DSV’s USD 16.2 billion acquisition of DB Schenker in 2025 produced the world’s largest freight forwarder by sales and capacity, arming the combined entity with 160,000 staff and a multimodal footprint broad enough to meet multinational tender requirements. UPS, FedEx, DHL, and Kuehne + Nagel leverage long histories on the U.S. General Services Administration schedule and NATO-certified air hubs to defend incumbency, but regional specialists still win contracts that demand hyper-local reach or niche compliance, such as medical cold chain.
Technology investment is the principal differentiator. Amazon’s 750,000 + mobile robots and UPS’s nationwide RFID rollout show how automation compresses fulfillment cost while raising visibility to levels public auditors now expect. Walmart’s planned USD 200 million deployment of autonomous forklifts illustrates retail’s influence on public-sector benchmarks; agencies often cite commercial best practice when drafting service-level metrics. First movers on blockchain integrations position themselves for GSA pilot programs that will soon make immutable chain-of-custody tables mandatory.
Smaller entrants exploit gaps unreachable to giants, notably last-mile rural delivery serviced through gig platforms, reverse logistics for circular procurement, and cybersecurity-centric warehousing that satisfies CMMC Level 3. Venture-backed robotics firm Mytra raised USD 120 million in 2026, reflecting capital-market belief that specialty tech vendors can capture slices of the government and education logistics industry by licensing turnkey automation suites to asset-light 3PLs. As compliance obligations intensify, partnership models integrators bundling boutique cyber vendors, drone operators, or blockchain specialists are likely to proliferate.
Government And Education Logistics Industry Leaders
-
DHL Group
-
FedEx
-
United Parcel Service, Inc. (UPS)
-
Kuehne + Nagel International AG
-
PGL (Primary Global Logistics)
- *Disclaimer: Major Players sorted in no particular order

Recent Industry Developments
- March 2026: The U.S. Transportation Command (USTRANSCOM) issued a presolicitation for Deployment and Distribution Service Support (D2S2) in Kuwait supporting the 595th Transportation Brigade, underscoring sustained demand for multimodal military logistics.
- February 2026: GSA opened bidding for a USD 54.5 million Global Supply contract in Hawaii with strict NIST SP 800-161 cybersecurity clauses, signaling higher IT thresholds for all federal logistics vendors.
- January 2026: Robotics provider Mytra secured USD 120 million Series C funding to scale autonomous warehouse systems tailored to public-sector tenders.
- April 2025: DSV finalized its USD 16.2 billion purchase of DB Schenker, doubling revenue and vaulting to the top of global forwarding league tables.


Global Government And Education Logistics Market Report Scope
| Transportation | Road |
| Rail | |
| Air | |
| Sea and Inland Waterway | |
| Warehousing & Storage | |
| Value-Added Services |
| Central/Federal Government |
| State & Local Government |
| Defense Agencies |
| Public Education (K-12) |
| Higher Education Institutions |
| Others |
| North America | United States |
| Canada | |
| Mexico | |
| South America | Brazil |
| Peru | |
| Chile | |
| Argentina | |
| Rest of South America | |
| Asia-Pacific | India |
| China | |
| Japan | |
| Australia | |
| South Korea | |
| South East Asia (Singapore, Malaysia, Thailand, Indonesia, Vietnam, and Philippines) | |
| Rest of Asia-Pacific | |
| Europe | United Kingdom |
| Germany | |
| France | |
| Spain | |
| Italy | |
| BENELUX (Belgium, Netherlands, and Luxembourg) | |
| NORDICS (Denmark, Finland, Iceland, Norway, and Sweden) | |
| Rest of Europe | |
| Middle East and Africa | United Arab of Emirates |
| Saudi Arabia | |
| South Africa | |
| Nigeria | |
| Rest of Middle East And Africa |
| By Service Type | Transportation | Road |
| Rail | ||
| Air | ||
| Sea and Inland Waterway | ||
| Warehousing & Storage | ||
| Value-Added Services | ||
| By End-User | Central/Federal Government | |
| State & Local Government | ||
| Defense Agencies | ||
| Public Education (K-12) | ||
| Higher Education Institutions | ||
| Others | ||
| By Geography | North America | United States |
| Canada | ||
| Mexico | ||
| South America | Brazil | |
| Peru | ||
| Chile | ||
| Argentina | ||
| Rest of South America | ||
| Asia-Pacific | India | |
| China | ||
| Japan | ||
| Australia | ||
| South Korea | ||
| South East Asia (Singapore, Malaysia, Thailand, Indonesia, Vietnam, and Philippines) | ||
| Rest of Asia-Pacific | ||
| Europe | United Kingdom | |
| Germany | ||
| France | ||
| Spain | ||
| Italy | ||
| BENELUX (Belgium, Netherlands, and Luxembourg) | ||
| NORDICS (Denmark, Finland, Iceland, Norway, and Sweden) | ||
| Rest of Europe | ||
| Middle East and Africa | United Arab of Emirates | |
| Saudi Arabia | ||
| South Africa | ||
| Nigeria | ||
| Rest of Middle East And Africa | ||


Key Questions Answered in the Report
What is the projected global spending on government and education logistics by 2031?
Global spending is forecast to reach USD 802.60 billion by 2031 as agencies lock in longer, compliance-heavy contracts.
Which region is expected to post the fastest growth through 2031?
Asia-Pacific is projected to advance at an 8.60% CAGR, driven by India’s Government e-Marketplace and expanding satellite campuses across Southeast Asia.
Why are value-added logistics services gaining traction with public-sector buyers?
Circular-economy mandates and device rollouts require reverse logistics, kitting, and asset refurbishment that deliver higher margins than basic freight.
How are cybersecurity rules such as CMMC 2.0 affecting logistics providers?
Carriers must invest up to USD 500,000 per site for audits and controls; firms unable to fund upgrades are withdrawing from defense bids.
What supply-chain resilience measures remain in force after the pandemic?
U.S. federal guidelines still mandate 90-day domestic stockpiles and dual-sourced distribution centers, increasing warehouse leasing and multimodal demand.
Which technology investments are now table-stakes for winning public logistics tenders?
Providers need RFID-enabled tracking, warehouse robotics, and blockchain-ready data feeds to satisfy real-time visibility and chain-of-custody requirements.
Page last updated on:


