Asia-Pacific Government And Education Logistics Market Size and Share
Market Overview
| Study Period | 2020 - 2031 |
|---|---|
| Forecast Data Period | 2026 - 2031 |
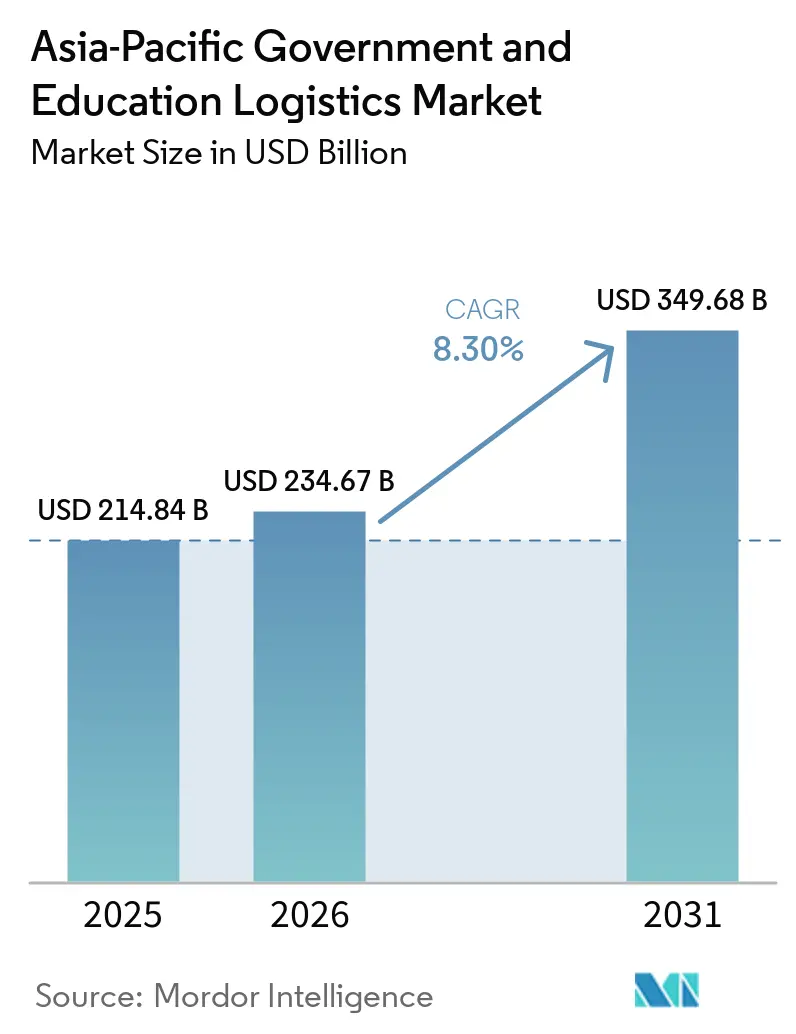
| Base Year Market Size (2025) | USD 214.84 Billion |
| Market Size (2026) | USD 234.67 Billion |
| Market Size (2031) | USD 349.68 Billion |
| Growth Rate (2026 - 2031) | 8.30% CAGR |
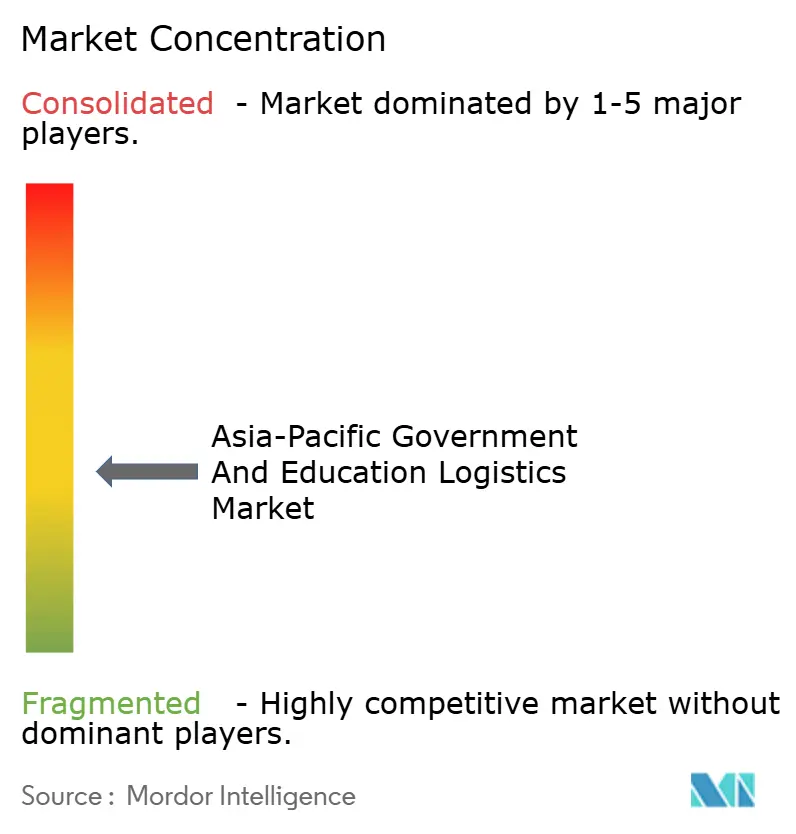
| Market Concentration | Medium |
Major Players *Disclaimer: Major Players sorted in no particular order Image © Mordor Intelligence. Reuse requires attribution under CC BY 4.0. | |
Asia-Pacific Government And Education Logistics Market Analysis by Mordor Intelligence
The Asia-Pacific government and education logistics market size is expected to grow from USD 214.84 billion in 2025 to USD 234.67 billion in 2026 and is forecast to reach USD 349.68 billion by 2031 at an 8.30% CAGR over 2026-2031.
The growth path reflects rising defense self-sufficiency, large-scale digital-learning roll-outs, and public-private outsourcing frameworks that are redrawing supply-chain responsibilities across the region. Secure logistics demand is expanding under AUKUS and QUAD cooperation, while climate-resilient warehousing mandates that followed the latest flood disruptions are reshaping facility designs. Universities are deploying micro-fulfillment hubs and blockchain authentication to combat textbook counterfeiting, bolstering demand for value-added services that combine customs clearance, digital verification, and ESG compliance. These trends favor operators able to integrate advanced warehouse-management software with zero-knowledge encryption and to navigate diverse regulatory environments, creating both premium-pricing opportunities and higher capital requirements.
Key Report Takeaways
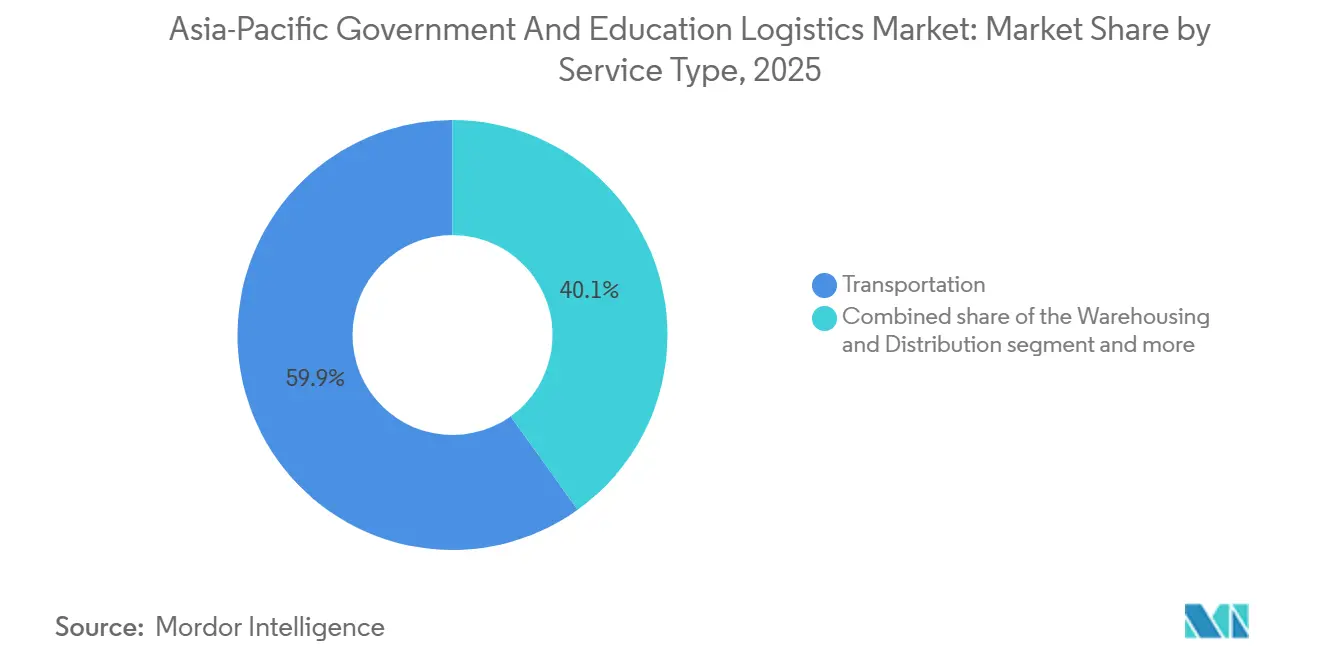
- By service type, transportation services accounted for 59.89% of the Asia-Pacific government and education logistics market share in 2025, while value-added services are projected to advance at a 9.30% CAGR through 2031.
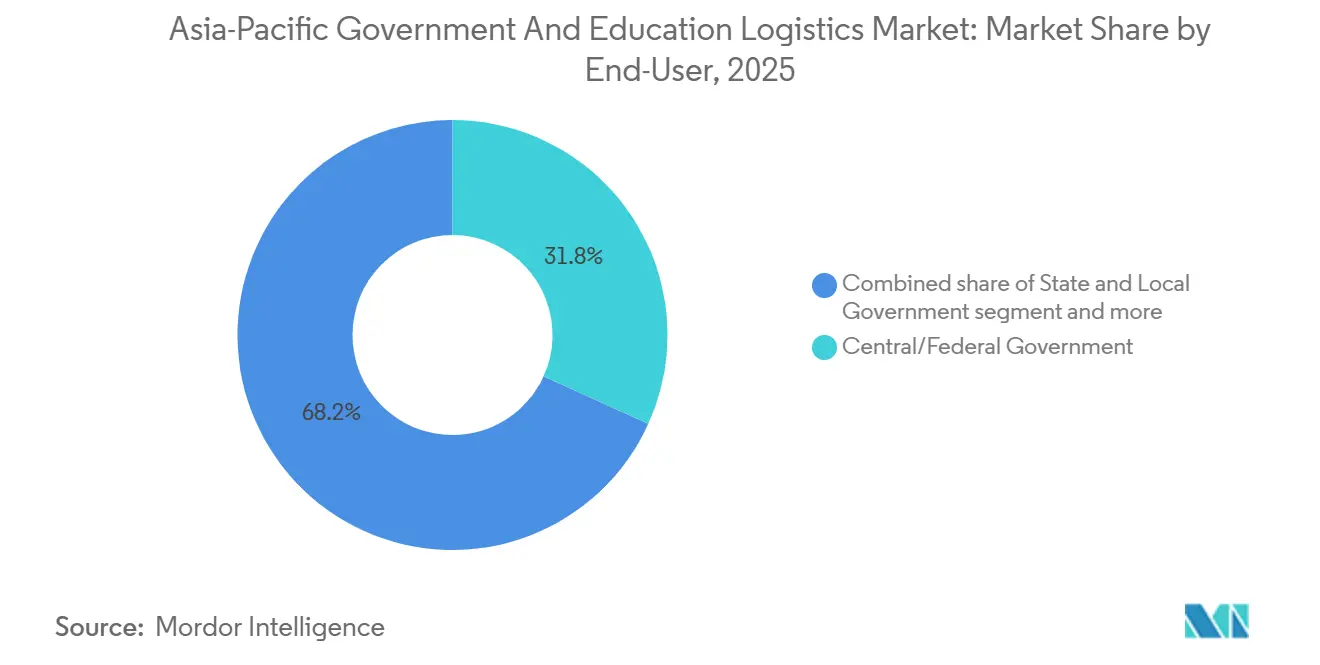
- By end user, defense agencies held the fastest trajectory at a 10.17% CAGR to 2031, compared with the 31.77% share captured by central/federal government buyers in the Asia-Pacific government and education logistics market size in 2025.
- By geography, China led with 39.84% of the Asia-Pacific government and education logistics market share, whereas India is poised to register the region’s highest 9.92% CAGR between 2026 and 2031.
Note: Market size and forecast figures in this report are generated using Mordor Intelligence’s proprietary estimation framework, updated with the latest available data and insights as of January 2026.
Worldwide, activity is shaped by contributions from multiple regions, with Asia representing one of the more structurally developed among them. The global report on government and education logistics market by Mordor Intelligence reflects how these regional layers combine into a single system.
Asia-Pacific Government And Education Logistics Market Trends and Insights
Drivers Impact Analysis*
| Driver | (~) % Impact on CAGR Forecast | Geographic Relevance | Impact Timeline |
|---|---|---|---|
| Large-Scale E-Governance & Smart-Infrastructure Stimulus Packages | +1.6% | India, Indonesia, Vietnam, Philippines | Medium term (2-4 years) |
| Escalating Regional Defense Procurement (AUKUS, QUAD) Fueling Secure 3PL Demand | +1.4% | Australia, Japan, South Korea, India | Long term (≥ 4 years) |
| Public-Private Partnership Outsourcing Wave Across Ministries & Universities | +1.3% | Malaysia, Thailand, Indonesia | Medium term (2-4 years) |
| Climate-Resilient Redundant Warehousing Mandates After 2023 Flood Disruptions | +1.0% | Thailand, Vietnam, Malaysia, Indonesia | Short term (≤ 2 years) |
| Micro-Fulfillment Hubs on University Campuses for On-Demand Learning Kits | +0.9% | Singapore, Australia, Japan, South Korea | Medium term (2-4 years) |
| Blockchain Authentication of Educational Content to Curb Counterfeit Textbooks | +0.7% | China, India, Indonesia, Philippines | Long term (≥ 4 years) |
| Source: Mordor Intelligence | |||
Large-Scale E-Governance & Smart-Infrastructure Stimulus Packages
National digital-government programs are injecting sustained logistics demand by funding hardware roll-outs, cloud-migration projects, and data-center construction. India’s Digital India initiative allocated USD 30 billion to digital infrastructure, creating continuous freight flows to 250,000 offices and 1.5 million schools. Indonesia’s USD 32 billion Nusantara smart-capital project similarly requires synchronized multi-agency freight coordination. Vietnam’s Framework 4.0 mandates cloud-based services throughout ministries by 2027, amplifying the need for secure transportation of critical ICT equipment. Philippine ICT guidelines now score bidders on cybersecurity capacity, pushing third-party providers to certify ISO 27001 systems. Together, these programs provide multi-year visibility for providers but fragment tender cycles across national and provincial entities.
Escalating Regional Defense Procurement (AUKUS, QUAD) Fuelling Secure 3PL Demand
Defense modernization accelerates cargo streams that must meet stringent clearance and chain-of-custody standards. Australia’s USD 368 billion AUKUS submarine program demands nuclear-propulsion component logistics that only vetted contractors can perform. The QUAD Supply Chain Resilience Initiative aligns security procedures across Australia, India, Japan, and the United States, creating designated corridors for dual-use items. Japan is lifting defense outlays to 2% of GDP by 2027, triggering new storage and transport needs for ammunition and high-value systems. South Korea’s push for indigenous platforms adds reverse-logistics complexity. Providers with existing defense accreditations, therefore, capture premium pricing while newcomers face high entry barriers[1]Australian Government Department of Defense, “AUKUS,” defence.gov.au.
Public-Private Partnership Outsourcing Wave Across Ministries & Universities
PPP frameworks allow governments to shift logistics risk and access private innovation. Malaysia’s education PPPs authorize universities to contract third parties for warehousing, customs, and last-mile delivery. Thailand’s Eastern Economic Corridor embeds smart-logistics PPP clauses serving ministries and campuses within the zone. Indonesia and the Philippines employ similar models to guarantee service levels while controlling budgets. Contract durations of five-plus years create annuity-like revenue streams, yet oblige operators to invest early in IT and ESG compliance to satisfy reporting obligations.
Climate-Resilient Redundant Warehousing Mandates After 2023 Flood Disruptions
After the devastating floods halted textbook deliveries to 3 million Thai students three years back, governments now require dual-location storage and flood-resistant designs. Vietnam’s new codes demand elevated racks and cyclone-proof cladding. Malaysia and Indonesia imposed business-continuity audits before contract awards. Operators with multi-node networks and steel-reinforced flooring can win tenders without costly retrofits, whereas single-site operators face penalties or contract loss.
Restraints Impact Analysis*
| Restraint | (~) % Impact on CAGR Forecast | Geographic Relevance | Impact Timeline |
|---|---|---|---|
| Aging Truck Driver Workforce & Widening Talent Gaps in APAC | -1.2% | Japan, South Korea, Australia, Thailand | Short term (≤ 2 years) |
| Volatile Bunker Fuel Surcharges Stressing Fixed-Budget Education Shipments | -0.9% | Island nations, global routes | Medium term (2-4 years) |
| ESG Tier-1 Audit Requirements Adding Compliance Costs for SME Contractors | -0.8% | Australia, Japan, regional | Long term (≥ 4 years) |
| Mandatory Zero-Knowledge Encryption for Defense Cargo Limiting Data Visibility | -0.7% | Australia, Japan, South Korea, India | Medium term (2-4 years) |
| Source: Mordor Intelligence | |||
Aging Truck Driver Workforce & Widening Talent Gaps in APAC
Japan reports 47% of drivers above 50, with retirements accelerating capacity shortfalls. Australia recorded 26,000 vacancies in 2024, compounded by defense-security clearance hurdles. South Korea’s wages jumped 18% year on year, while Thailand struggles to staff rural routes due to limited vocational schools. Providers respond with signing bonuses, simulators, and early autonomous trials, but regulatory lag slows full driverless deployment for government cargo[2]Ministry of Land, Infrastructure, Transport and Tourism, Japan, “Transport Statistics,” mlit.go.jp.
Volatile Bunker Fuel Surcharges Stressing Fixed-Budget Education Shipments
Bunker prices climbed 35% just two years back after Middle-East tensions, forcing emergency surcharges that exceeded Filipino textbook budgets. Indonesia’s island provinces now spend 20% of logistics outlays on fuel adjustments, complicating planning cycles. Malaysia hedged prices in 2025, but smaller colleges lack such tools. Operators with newer dual-fuel vessels secure multiyear fixed-rate contracts, shifting volatility risk onto themselves in exchange for higher base fees[3]International Maritime Organization, “Bunker Fuel Price Trends,” imo.org .
*Our forecasts treat driver/restraint impacts as directional, not additive. The impact forecasts reflect baseline growth, mix effects, and variable interactions.
Segment Analysis
By Service Type: Value-Added Services Capture Premium Growth
Value-added services secured a 9.30% CAGR through 2031, well above the broader Asia-Pacific government and education logistics market share for the transportation sector. In 2025, transportation preserved 59.89% share, underlining the scale of basic freight demand. Yet commoditization, driver shortages, and stricter carbon caps curb rate upside, pushing operators to bundle customs, blockchain stamping, and ESG dashboards. Rail corridors, especially India’s dedicated freight routes, trim textbook lead-times by 30-40% and reduce diesel exposure. Air freight remains a niche for official documents and emergency relief, commanding premiums that offset low tonnage. Sea and inland waterways stay critical for archipelagic deliveries, though fuel risk shifts toward long-term charterers. Warehousing gains from climate-resilient upgrades, with elevated racks and dual-power systems now baseline specifications across Thailand and Vietnam.
Micro-fulfillment hubs multiply on campuses, requiring small-footprint automation and API links to student portals. Consequently, providers integrating these components into one invoice realize higher margins and deepen client lock-in. Market leaders differentiate through ISO 27001 data centers, zero-knowledge encryption modules, and on-site customs desks. Lagging freight forwarders that lack cybersecurity credentials risk relegation to subcontract status, losing pricing power and strategic influence.


By End User: Defense Agencies Lead Growth Acceleration
Defense agencies are emerging as the fastest-growing end-user segment in the Asia-Pacific government and education logistics market size, advancing at a 10.17% CAGR through 2031, while central and federal government buyers continue to lead with a 31.77% market share. Central governments sustain their dominance through consolidated procurement systems and cross-ministry contracting efficiencies, while decentralization is gradually empowering state and local bodies through localized initiatives, expanding opportunities for agile logistics providers.
In the education segment, public institutions continue to generate high-volume demand, while higher-education institutions require more specialized logistics for high-value and cross-border shipments. At the same time, the defense segment is gaining prominence due to complex requirements such as secure compliance, sensitive handling, and reverse logistics. These factors create high entry barriers, reinforcing established players and supporting strong pricing power.
Geography Analysis
China’s 39.84% of the Asia-Pacific government and education logistics market share in 2025 stemmed from centralized procurement and Belt-and-Road corridors. Growth eases as domestic infrastructure reaches saturation and policy pivots toward digital optimization rather than concrete laying. India, by contrast, records a 9.92% CAGR, propelled by Digital India’s USD 30 billion investment and the world’s largest public-school system digitizing content delivery. Australia’s USD 368 billion AUKUS program catalyzes secure-facility construction in Adelaide and Perth.
Japan’s aging truck workforce forces automation pilots, while South Korea’s GDP-linked defense ramp supports sophisticated cold-chain trials for avionics components. Indonesia’s Nusantara capital build drives multimodal freight orchestration across 17,000 islands. Thailand’s Eastern Economic Corridor shows how PPP logistics hubs integrate university and ministry consignments.
Vietnam’s cloud-first government push attracts secure-IT logistics specialists. Malaysia’s Klang Valley flood shock accelerated redundant-warehouse uptake, giving early-mover advantage to providers with dual-site footprints. Smaller states such as the Philippines, New Zealand, and Pacific islands present niche, higher-margin opportunities due to geographic fragmentation and complex customs codes.
Mordor Intelligence provides coverage of the government and education logistics market across other key regional markets, including North America, Europe, and Middle East, each with their regulatory frameworks and demand patterns. Detailed country-level analysis extends to India, Japan, China, South Korea, Germany, and Canada incorporating local coverage and market participation, as required.
Competitive Landscape
Market fragmentation is moderate: the top five players controlled an estimated 43% share in 2025, leaving space for regional specialists. Global integrators like DSV and Kuehne + Nagel expand through climate-resilient mega-hubs in Bangkok and Singapore, embedding blockchain and ESG dashboards to satisfy tender checklists.
Kerry Logistics leverages local know-how and Mandarin-speaking account teams to win Chinese-language government bids across ASEAN. CJ Logistics’ USD 280 million South Korean submarine-component contract demonstrates regional champions’ ability to penetrate defense niches. Nippon Express partners with Australia’s defense ministry to build secure nuclear-component facilities, showing bilateral models that limit geopolitical risk[4]CJ Logistics, “Company Overview,” cjlogistics.com .
Technology remains the primary differentiator. Operators roll out WMS modules that capture blockchain stamps, AI-driven route planning, and sensor-based humidity monitoring for archival documents. ESG tier-1 compliance is rising: Yamato’s ISO 27001 award in 2024 boosted its tender win rate with Japanese ministries.
Autonomous vehicle pilots at the University of Melbourne reveal how last-mile automation counters driver gaps and carbon targets. Capital intensity is climbing, prompting a wave of alliances and selective M&A as smaller players seek scale to fund climate-proof warehouses and encryption upgrades. Moderate consolidation is expected through 2031, yet local specialists with political connections and linguistic agility will preserve defensible strongholds next to global majors.
Asia-Pacific Government And Education Logistics Industry Leaders
DHL Supply Chain & Global Forwarding
Nippon Express Holdings
Yamato Holdings
Yusen Logistics
SF Express (Group) Co., Ltd.
- *Disclaimer: Major Players sorted in no particular order

Recent Industry Developments
- February 2026: SF Airlines partnered with China Cargo Airlines to expand international air cargo cooperation. The agreement includes capacity sharing and development of interline products across Asia, Europe, and the United States.
- April 2025: DSV received EU approval to acquire DB Schenker in a EUR 14.3 billion (USD 16.7billion) deal. This acquisition is expected to significantly reshape global and Asia-Pacific logistics networks and competition.
- March 2025: GXO deployed AI-powered inventory robots (Dexory) after successful pilot programs. The solution improves warehouse accuracy and efficiency, supporting digital transformation in logistics operations.
- March 2025: DHL acquired CryoPDP to strengthen its specialized healthcare and clinical trial logistics capabilities. The move enhances its position in government-regulated pharma supply chains, especially in the Asia-Pacific.


Asia-Pacific Government And Education Logistics Market Report Scope
| Transportation | Road |
| Rail | |
| Air | |
| Sea and Inland Waterway | |
| Warehousing and Distribution | |
| Value-Added Services |
| Central/Federal Government |
| State and Local Government |
| Defense Agencies |
| Public Education (K-12) |
| Higher Education Institutions |
| Others |
| China |
| India |
| Japan |
| South Korea |
| Australia |
| Indonesia |
| Thailand |
| Vietnam |
| Malaysia |
| Rest of Asia-Pacific |
| By Service Type | Transportation | Road |
| Rail | ||
| Air | ||
| Sea and Inland Waterway | ||
| Warehousing and Distribution | ||
| Value-Added Services | ||
| By End-User | Central/Federal Government | |
| State and Local Government | ||
| Defense Agencies | ||
| Public Education (K-12) | ||
| Higher Education Institutions | ||
| Others | ||
| By Country | China | |
| India | ||
| Japan | ||
| South Korea | ||
| Australia | ||
| Indonesia | ||
| Thailand | ||
| Vietnam | ||
| Malaysia | ||
| Rest of Asia-Pacific |


Key Questions Answered in the Report
How fast is logistics spending by Asia-Pacific defense agencies growing?
Defense consignments are advancing at a 10.17% CAGR through 2031 as AUKUS, QUAD, and local modernization programs raise secure-supply-chain demand.
Which country will add the most new logistics value by 2031?
India is on track for the region’s highest 9.92% CAGR, driven by Digital India’s USD 30 billion digital-infrastructure rollout across schools and ministries.
What share of spending will transportation services still hold in 2031?
Despite faster growth elsewhere, transportation is expected to maintain a majority share, though its slice will decline from 59.89% in 2025 as value-added services expand.
Why are micro-fulfillment hubs appearing on campuses?
Universities need same-day delivery of learning kits and lab supplies; on-site automated hubs cut lead times from weeks to hours while lowering inventory costs.
What is driving investment in climate-resilient warehouses?
Severe floods forced Thailand, Vietnam, and Malaysia to mandate dual-location storage and flood-resistant construction for government and educational inventories, spurring a regional retrofitting wave.
Page last updated on:


