Secure Logistics Market Size and Share
Market Overview
| Study Period | 2020 - 2031 |
|---|---|
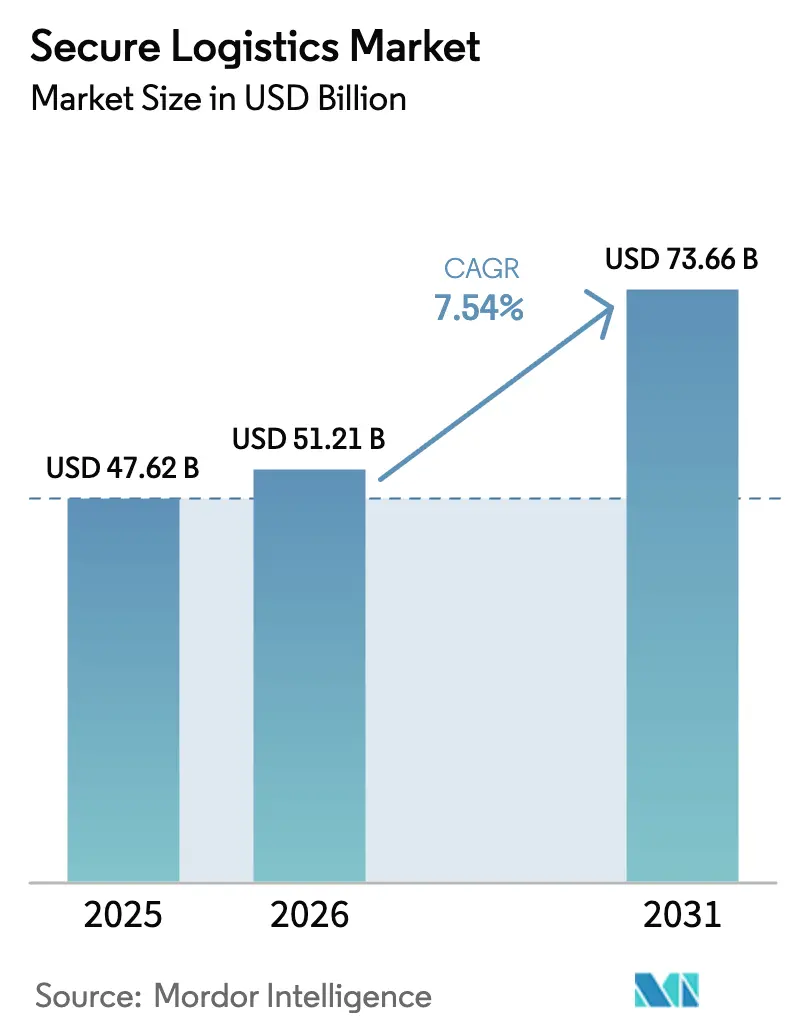
| Market Size (2026) | USD 51.21 Billion |
| Market Size (2031) | USD 73.66 Billion |
| Growth Rate (2026 - 2031) | 7.54% CAGR |
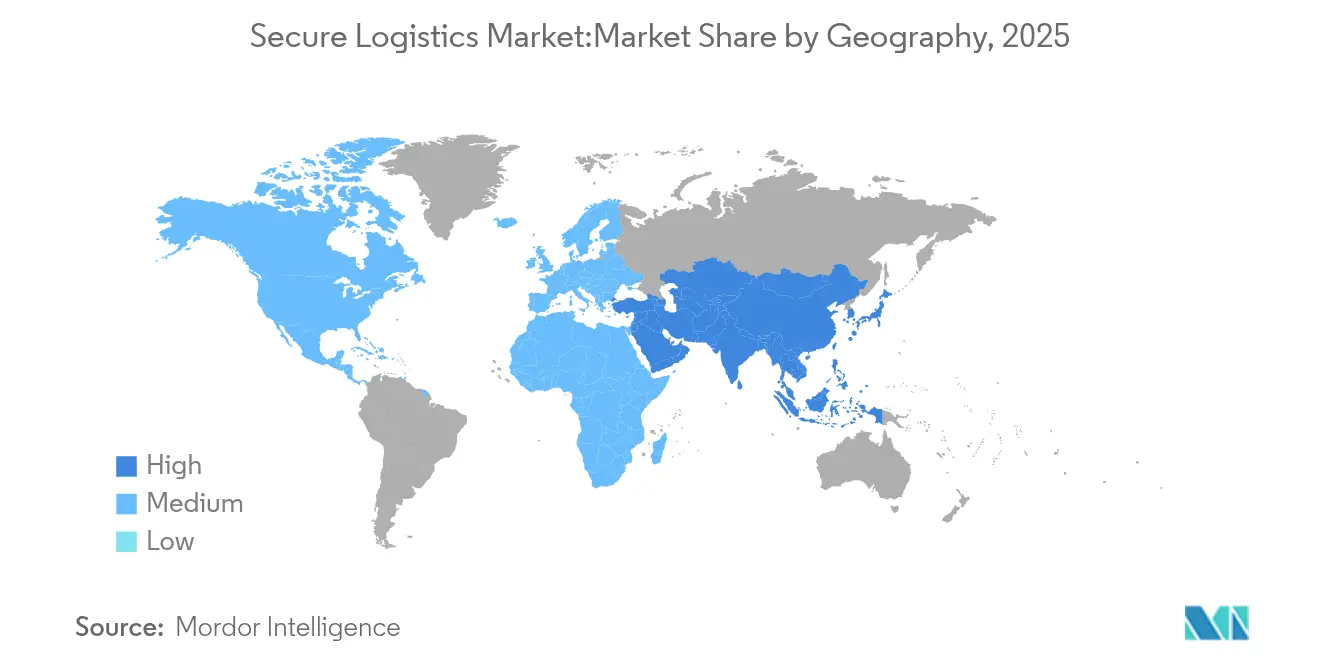
| Fastest Growing Market | Middle East and Africa |
| Largest Market | Asia Pacific |
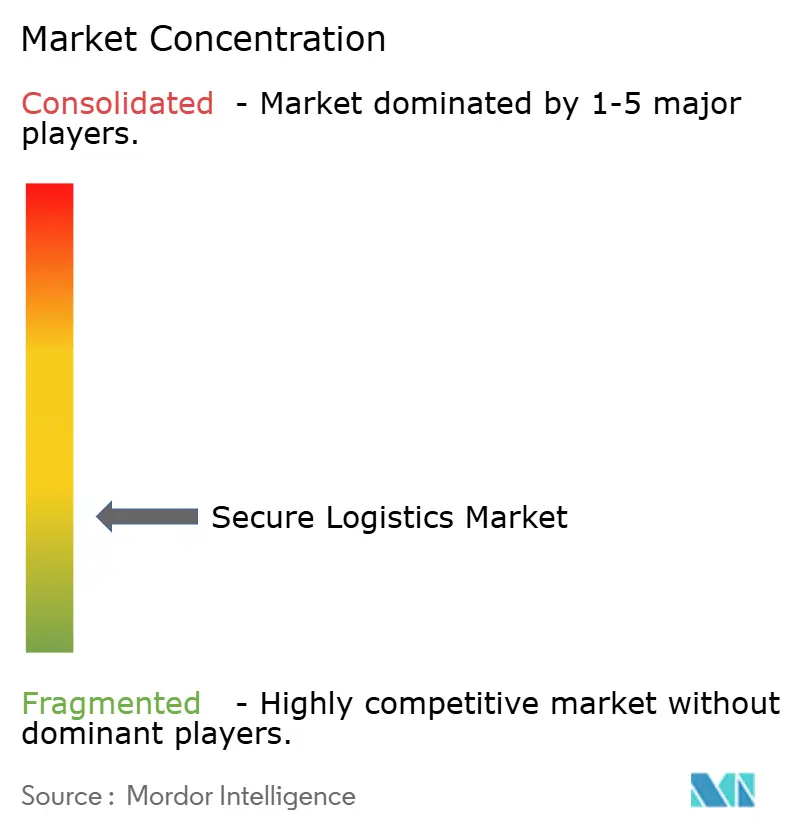
| Market Concentration | Low |
Major Players *Disclaimer: Major Players sorted in no particular order Image © Mordor Intelligence. Reuse requires attribution under CC BY 4.0. | |
Secure Logistics Market Analysis by Mordor Intelligence
The Secure Logistics Market size was valued at USD 47.62 billion in 2025 and estimated to grow from USD 51.21 billion in 2026 to reach USD 73.66 billion by 2031, at a CAGR of 7.54% during the forecast period (2026-2031).
Demand remains resilient because banks, retailers, and mining firms continue to outsource high-risk transportation and storage tasks even while digital payments expand. Growth is further supported by a surge in precious-metals shipments triggered by geopolitical tensions, steady ATM rollouts in emerging economies, and the need for real-time telemetry across armored fleets loomis.com. Market consolidation also fuels expansion as large providers absorb niche technology specialists, accelerating time-to-market for AI-enabled surveillance and blockchain tracking.
Key Report Takeaways
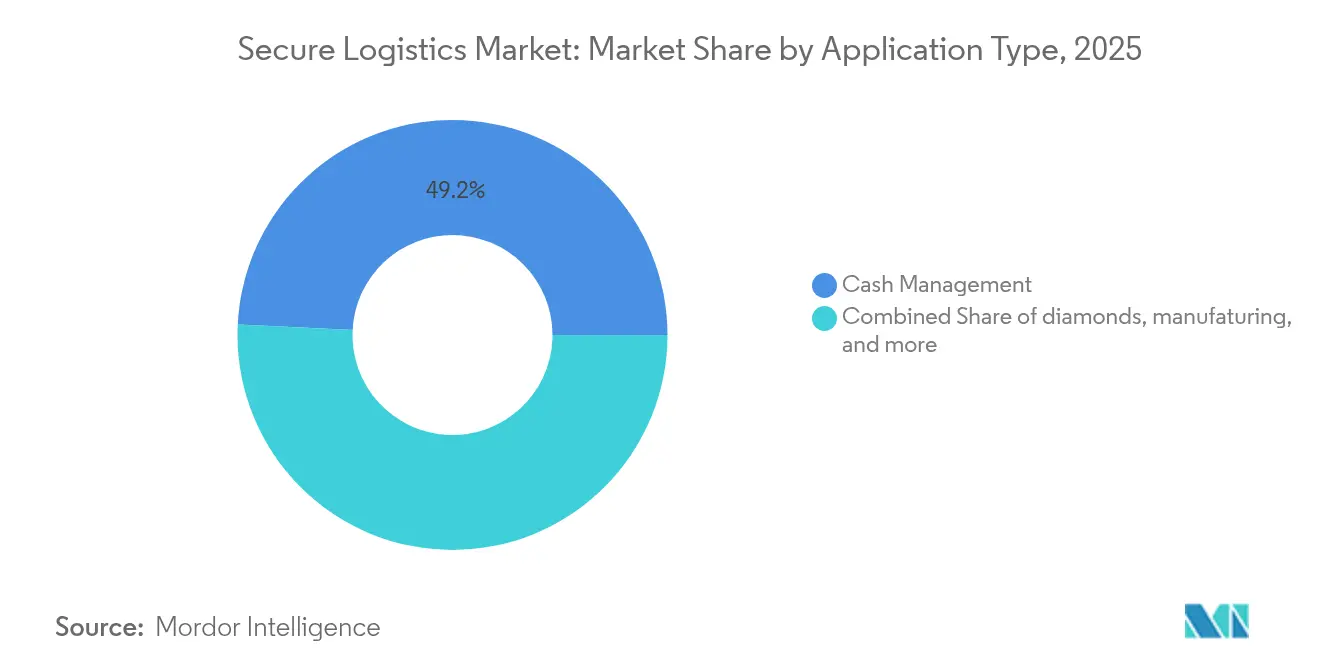
- By application, cash management led with 49.22% of the secure logistics market share in 2025, while jewelry & precious metals is forecast to expand at a 9.52% CAGR to 2031.
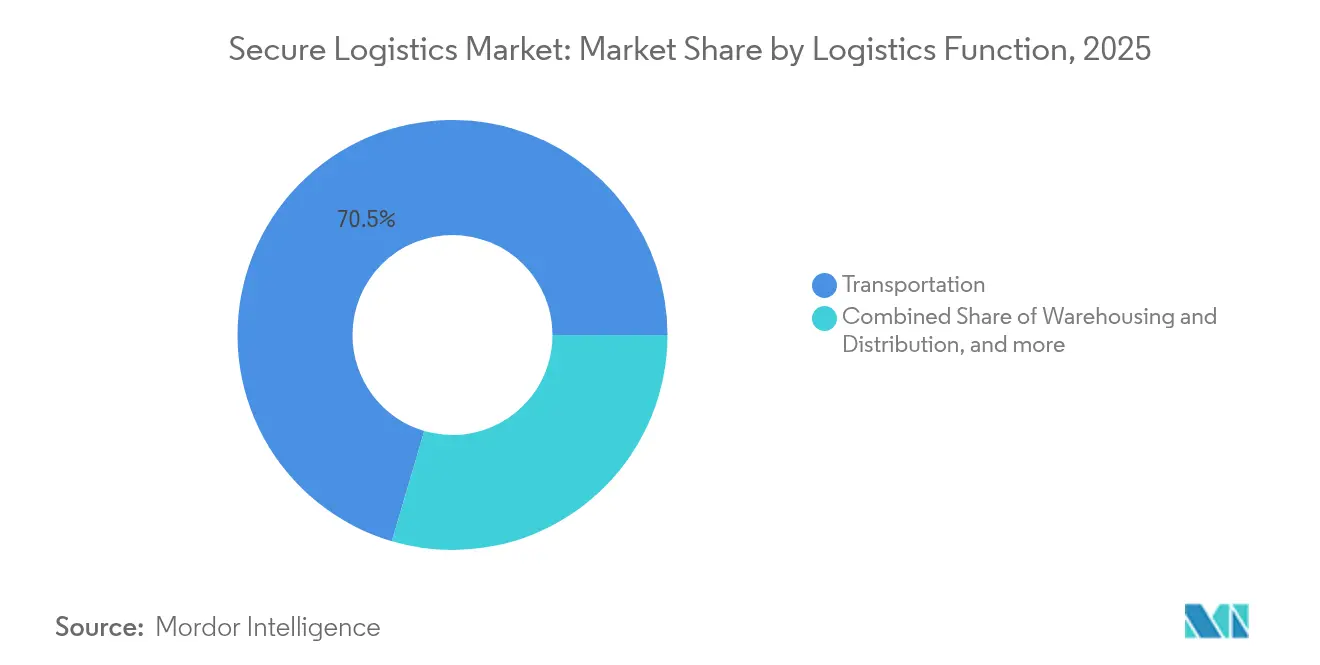
- By logistics function, transportation commanded 70.45% share of the secure logistics market size in 2025 and value-added services are advancing at a 7.12% CAGR between 2026-2031.
- By type, static operations held 60.35% of the secure logistics market share in 2025, whereas mobile services are projected to register an 8.55% CAGR between 2026-2031.
- By end-user industry, Banking & Financial Institutions accounted for 45.35% of the secure logistics market in 2025, with luxury goods are projected to register an 8.93% CAGR between 2026-2031.
- By geography, Asia-Pacific captured 31.60% share of the secure logistics market in 2025; with middle east & africa is projected to register an 7.62% CAGR between 2026-2031.
Note: Market size and forecast figures in this report are generated using Mordor Intelligence’s proprietary estimation framework, updated with the latest available data and insights as of 2026.
Global Secure Logistics Market Trends and Insights
Drivers Impact Analysis*
| Driver | % Impact on CAGR Forecast | Geographic Relevance | Impact Timeline |
|---|---|---|---|
| Rising ATM deployments in emerging economies | 1.2% | Asia-Pacific, Latin America, Africa | Medium term (2-4 years) |
| Rapid growth of e-commerce cash-on-delivery models | 0.8% | Global, with concentration in APAC | Short term (≤ 2 years) |
| Bank branch outsourcing cash-in-transit services | 0.6% | Global, led by North America & Europe | Long term (≥ 4 years) |
| Regulation-driven upgrades to armored fleet telemetry | 0.5% | North America, Europe | Medium term (2-4 years) |
| Supply-chain cyber-theft forcing integrated physical-digital security | 0.4% | Global | Long term (≥ 4 years) |
| Tokenized blockchain tracking for high-value diamonds & bullion | 0.3% | Global, concentrated in diamond trading hubs | Long term (≥ 4 years) |
| Source: Mordor Intelligence | |||
Rising ATM Deployments in Emerging Economies
ATM infrastructure continues to expand in Asia-Pacific and Africa as governments pursue financial-inclusion programs that rely on cash distribution networks. Each new device requires recurring armored-car replenishment, adding stable volumes to the secure logistics market. While ATM density in mature economies is shrinking, the offsetting growth in emerging regions sustains fleet utilization rates and supports multi-year service contracts. Operators also deploy white-label ATMs for mid-tier banks, improving cost efficiency and extending network reach. Such installations underpin predictable cash-handling revenue that complement providers’ investments in vault capacity and electronic monitoring. The clear visibility of long-term cash cycles helps carriers optimize route planning and lower per-cassette costs, thereby reinforcing profitability.
Rapid Growth of E-commerce Cash-on-Delivery Models
Cash-on-delivery remains a dominant payment mode in many emerging e-commerce markets where card penetration lags or trust in digital channels is still developing economictimes. Secure logistics carriers must therefore orchestrate reverse-logistics loops that collect fragmented cash receipts from thousands of deliveries points each day. Route densification around metropolitan clusters helps compress cycle times and enhances service profitability. Providers integrate handheld counting devices and digital reconciliation platforms to accelerate deposit timelines for online merchants. The model faces gradual erosion as mobile wallets gain popularity, yet high double-digit e-commerce growth keeps absolute cash volumes elevated. Consequently, the secure logistics market continues to benefit from a hybrid landscape that balances physical and electronic transactions.
Bank Branch Outsourcing of Cash-in-Transit Services
Retail banks worldwide are converting fixed cash-handling overheads into variable service fees by outsourcing cash-in-transit runs and vault processing to specialists. The shift allows financial institutions to refocus on digital channels without compromising branch security. Outsourcing contracts typically span three to five years and include stringent service-level agreements that lock in revenue visibility for armored-car operators. Providers leverage shared fleets to pool volumes from multiple banks, cutting per-shipment costs and boosting margins. The arrangement also transfers risk and insurance obligations from the bank to the carrier, reinforcing the latter’s value proposition. As branch networks gradually shrink, remaining locations still demand reliable cash replenishment, ensuring a steady baseline for the secure logistics market.
Regulation-Driven Upgrades to Armored Fleet Telemetry
Electronic Logging Device mandates in the United States and similar regulations across Europe require real-time recording of driver hours and vehicle data [1]Federal Motor Carrier Safety Administration, fmcsa.dot.gov. Secure logistics fleets therefore integrate telematics that provide end-to-end shipment visibility, route optimization, and panic-alert capabilities. The capital expenditure yields dual benefits: compliance with safety rules and richer analytics for customers. Carrier dashboards flag route deviations and dwell-time anomalies, mitigating theft risk and strengthening insurance negotiations. Telemetry data also feeds predictive maintenance systems that cut downtime for armored trucks. These innovations reinforce client trust and differentiate technology-forward operators in the secure logistics market.
Restraints Impact Analysis*
| Restraint | % Impact on CAGR Forecast | Geographic Relevance | Impact Timeline |
|---|---|---|---|
| Persistent cash-lite policy pushes in mature economies | -0.6% | North America, Europe, developed APAC | Long term (≥ 4 years) |
| Labor shortages of certified armored-car guards | -0.5% | Global, acute in North America | Medium term (2-4 years) |
| Escalating insurance premiums for conflict-zone routes | -0.4% | Middle East, Red Sea, conflict-affected regions | Short term (≤ 2 years) |
| Growing adoption of virtual/crypto asset transfer replacing physical shipment | -0.3% | Global, led by developed economies | Long term (≥ 4 years) |
| Source: Mordor Intelligence | |||
Persistent Cash-Lite Policy Pushes in Mature Economies
Central banks in Scandinavia and Australia actively promote digital payments to curb cash circulation, trimming shipment volumes that feed the secure logistics market [2]Sveriges Riksbank, “Payments in Sweden 2025,” Sveriges Riksbank, riksbank.se. Retailers respond by reducing daily cash pickups, while governments discuss upper cash-transaction limits. Providers counter this trend by pivoting toward precious-metals logistics, secure storage for cryptocurrency hardware wallets, and ATM second-life management services. Although cash volumes dip, high-value commodities partially fill the gap, ensuring that carriers retain route density in developed markets. Regulatory dialogues around central-bank digital currencies also encourage operators to explore hybrid services that combine physical vaulting with digital token custody, broadening future revenue streams.
Labor Shortages of Certified Armored-Car Guards
Armored-car personnel must pass firearms licensing and rigorous background checks, yet the role offers starting wages near USD 20 per hour despite elevated risk. Tight labor markets in North America push turnover above 30%, inflating recruitment and training costs. Companies raise wages, offer retention bonuses, and invest in autonomous counting machines to limit cash-handling errors. Long-term solutions include tele-operation pilot projects and electric vehicles designed for one-person crews, which cut staffing needs by leveraging remote support centers. While these initiatives blunt cost pressures, persistent labor constraints moderate the secure logistics market growth trajectory.
*Our forecasts treat driver/restraint impacts as directional, not additive. The impact forecasts reflect baseline growth, mix effects, and variable interactions.
Segment Analysis
By Application: Cash Management Dominates Amid Precious Metals Surges
Cash management generated 49.22% of the secure logistics market size in 2025, buoyed by regular ATM replenishments and retail cash pickups. Banks outsource bulk note processing and reconciliation to focus on digital channels. Retailers employ smart safes that transmit deposit values in real time and reduce daily branch visits. Conversely, jewelry & precious metals is projected to post a 9.52% CAGR between 2026-2031 as investors seek safe-haven assets during geopolitical turbulence. Carriers support this uptick by offering temperature-controlled vaults, bonded warehouse capacity, and same-day customs clearance for bullion shipments. Luxury brands also use tamper-evident packaging and GPS beacons to safeguard high-value pieces in transit. As a result, precious-metal lanes now contribute materially to revenue diversification within the secure logistics market.
The manufacturing and pharmaceutical verticals add stable baseline volumes through high-value component deliveries and regulatory-compliant medical logistics. CEIV Pharma certification attracts vaccine producers that demand temperature integrity, while semiconductor firms require antistatic packaging and chain-of-custody transparency. Diamond traceability platforms such as Tracr register millions of stones on blockchain, a development that elevates digital paperwork standards for carriers. Together these trends broaden the service portfolio and reduce dependence on cash volumes. Consequently, the secure logistics market continues to shift from mono-line cash operations toward multi-commodity expertise.


By Type: Static Operations Lead While Mobile Services Accelerate
Static facilities, including smart vaults and cash-processing centers, controlled 60.35% of the secure logistics market size in 2025. Such hubs underpin overnight note sorting and coin wrapping for banks and retailers. Providers invest in biometric access, multilevel fire suppression, and private LTE networks to meet insurance underwriting standards. Simultaneously, mobile services record an 8.55% CAGR as clients demand on-route flexibility and real-time tracking. Electric armored vehicles lower total cost of ownership by cutting fuel and maintenance spend, while cargo telemetry platforms deliver minute-by-minute location data. Route optimization software clusters stops shaving drive-time and greenhouse-gas emissions, enhancing ESG credentials.
Converging hardware and software upgrades allow carriers to convert vehicles into rolling data hubs that feed predictive analytics engines. Managers analyze dwell-time anomalies to refine schedules and maximize asset utilization. One-person crew configurations supported by remote monitoring reduce labor requirements without compromising security. The resulting efficiencies strengthen the competitive position of technology-driven operators in the secure logistics market.
By Logistics Function: Transportation Dominates Despite Value-Added Growth
Transportation accounted for 70.45% of the secure logistics market share in 2025 as armored trucks, air-cargo charters, and bonded railcars moved currency and valuables across continents. Road remains the backbone due to last-mile reach, while air freight handles urgent diamond shipments and bullion consignments. Sea and inland barge routes service bulk precious-metal exports, though vessels now face 900% higher war-risk premiums in Red Sea corridors. Value-added services such as labeling, kitting, and risk consulting are expanding at a 7.12% CAGR as clients seek integrated supply-chain solutions. Consulting arms map threat scenarios and design multilayer security protocols that reduce overall insurance spending.
Warehousing and distribution segments complement transport by offering high-density vaulting and automated storage for collectibles. Providers deploy robotic shuttles and humidity-controlled chambers to store art, gemstones, and cryptocurrency cold wallets. Rail remains a niche player reserved for heavy bullion moves in Canada and South Africa. Nevertheless, cross-border e-commerce flows are encouraging multimodal combinations, further enlarging the addressable secure logistics market.
By End-User Industry: Banking Sector Leads Amid Diversifications
Banking & financial institutions generated 45.35% of revenue in 2025, reflecting ongoing reliance on outsourced cash-in-transit, ATM management, and branch vault processing. Outsourcing transforms fixed overheads into fee-based models that preserve branch profitability. Retail & e-commerce clients represent the next-largest pool as cash-on-delivery remains prevalent in Southeast Asia and Latin America. Mining & metals firms leverage armored carriers for dore bar exports and mineral concentrate shipments that require proactive risk assessments. Government agencies rely on currency issue and tax-collection services, underpinning stable contract pipelines.
Luxury goods manufacturers and pharmaceutical producers emerge as high-growth micro-segments demanding white-glove handling and stringent temperature controls. Secure logistics providers respond by integrating GDP-compliant packaging, active refrigeration, and continuous temperature loggers. Portfolio diversification limits reliance on any single end-user group, sustaining the secure logistics market through payment-method transitions and macroeconomic cycles.
Geography Analysis
Asia-Pacific held 31.60% of the secure logistics market size in 2025, supported by rapid economic expansion, robust remittance flows, and high e-commerce cash-on-delivery ratios. Governments in Indonesia, the Philippines, and Vietnam continue to license new private ATMs that need recurring cash replenishment. Carriers expand armoring capacity and establish joint ventures with local banks to meet regulatory ownership caps. The region’s forecast CAGR outpaces all others as cross-border precious-metal trade between Hong Kong and Singapore accelerates in a volatile investment climate.
North America ranks second because of mature cash management outsourcing, sizable high-value-goods trade, and strict compliance regimes that favor established carriers . Providers deploy analytics platforms that integrate point-of-sale data, enabling retail chains to fine-tune pickup frequencies. Europe posts steady growth although cash-lite policies in the Nordics reduce volume. EU rules around fleet telemetry and cross-border valuables transit create service opportunities for technology-oriented operators.
South America benefits from financial-inclusion programs, mining exports, and rising retail security needs. Armored-car design evolves to manage mountainous terrain, while cash centers introduce high-speed note sorters to support new private banks in Brazil and Colombia. Middle East and Africa remain opportunity regions, driven by infrastructure projects and precious-metal trading hubs such as Dubai. Risk management complexity rises amid geopolitical tensions, prompting demand for satellite tracking and cargo escort services that enrich the secure logistics market.
Mordor Intelligence provides coverage of the secure logistics market across other key regional markets, including Middle East, each with their regulatory frameworks and demand patterns. Detailed country-level analysis extends to Saudi Arabia incorporating local coverage and market participation, as required.

Competitive Landscape
The secure logistics market remains moderately consolidated. Brink’s, GardaWorld, and Loomis operate across more than 100 countries each, giving them scale advantages in procurement, insurance negotiation, and technology rollout. Brink’s issued USD 800 million in senior notes in 2024 to finance geographic expansion and digital investments. Garda World purchased Stealth Monitoring to add AI-enabled video surveillance that now oversees 100,000 cameras nightly. Loomis ordered 150 electric armored vehicles from Xos to cut fleet emissions and operating costs.
Allied Universal closed 24 acquisitions between 2022-2024, adding security-technology specialists in the United States, Europe, and Latin America. Prosegur Cash collaborated with a Spanish university to unveil the country’s first electric armored truck that delivers 15-tonne annual CO₂ savings. Smaller regional players concentrate on niche offerings such as diamond-hub line-haul, armored-air escort, or crypto-cold-wallet vaulting. Technology adoption has become the primary differentiator, with blockchain tracking, fleet telemetry, and AI-driven risk analytics now core to contract tenders. Long-term service agreements, capital intensity, and tight regulation limit the entry of new competitors, preserving pricing discipline in the secure logistics market.
Secure Logistics Industry Leaders
Lemuir Group
CMS Info Systems
Prosegur
Allied Universal
Armaguard
- *Disclaimer: Major Players sorted in no particular order

Recent Industry Developments
- March 2025: Prosegur Cash unveiled Spain’s first electric armored truck, achieving 30% weight reduction and saving 15 tons of CO₂ per year
- March 2025: Allied Universal reported six 2024 acquisitions worth more than USD 240 million in annual revenue
- February 2025: Brink’s posted record 2024 revenue of USD 5,012 million and settled DOJ and FinCEN investigations for USD 45.7 million
- February 2025: GardaWorld released 2024 guidance of USD 5,875-5,925 million in revenue and extended its Term Loan B maturity to 2029


Research Methodology Framework and Report Scope
Market Definitions and Key Coverage
Our study defines the secure logistics market as the specialized handling, storage, and transport of cash, bullion, jewelry, sensitive documents, and other high-value assets by armored vehicles, vaulting facilities, and technology-enabled monitoring networks that prevent loss, theft, or tampering.
Scope Exclusions: We exclude routine courier parcels, unarmored e-commerce fulfillment, and in-house bank branch cash transfers that are not contracted to third-party secure logistics specialists.
Segmentation Overview
- By Application
- Cash Management
- Diamonds
- Jewelry & Precious Metals
- Manufacturing
- Others
- By Type
- Static
- Mobile
- By Logistics Function
- Transportation
- Road
- Air
- Sea and Inland Waterways
- Rail
- Warehousing & Distribution
- Value-added Services (Labelling, Kitting, Consulting)
- Transportation
- By End-User Industry
- Banking & Financial Institutions
- Government & Public Sector
- Retail & E-commerce
- Mining & Metals
- Luxury Goods
- Pharmaceuticals & Healthcare
- Others
- Geography
- North America
- United States
- Canada
- Mexico
- South America
- Brazil
- Peru
- Chile
- Argentina
- Rest of South America
- Asia Pacific
- India
- China
- Japan
- Australia
- South Korea
- South East Asia (Singapore, Malaysia, Thailand, Indonesia, Vietnam, and Philippines)
- Rest of Asia-Pacific
- Europe
- United Kingdom
- Germany
- France
- Spain
- Italy
- BENELUX (Belgium, Netherlands, and Luxembourg)
- NORDICS (Denmark, Finland, Iceland, Norway, and Sweden)
- Rest of Europe
- Middle East And Africa
- United Arab of Emirates
- Saudi Arabia
- South Africa
- Nigeria
- Rest of Middle East And Africa
- North America
Detailed Research Methodology and Data Validation
Primary Research
Mordor analysts then interview armored-car operators, cash-management managers at banks, mining shippers, insurance underwriters, and regional regulators across North America, Europe, Asia-Pacific, and the Middle East. These conversations validate segment definitions, typical service pricing, and technology adoption levels, and they fill gaps that documents alone cannot bridge.
Desk Research
We begin with structured desk work that pulls asset-movement statistics from sources such as the Bank for International Settlements, international customs manifests, and central-bank cash-in-circulation dashboards. Trade association releases from bodies like ESTA, patent analytics via Questel, and country crime statistics complement the picture. Company 10-Ks and investor presentations help us size service revenue pools, while news archives on Dow Jones Factiva track contract wins and ATM rollouts. This list is illustrative; many additional public and proprietary references support data capture and clarification.
Market-Sizing & Forecasting
We anchor the 2025 baseline with a top-down build that reconstructs global cash and valuables flows from production and trade data, which are then aligned with ATM density, cash-to-GDP ratios, jewelry export values, bullion turnover, and e-commerce cash-on-delivery penetration. Selective bottom-up checks, such as sampled armored-car fleets multiplied by average daily routes, help adjust totals. Forecasts to 2030 employ multivariate regression that links service demand to real GDP, retail cash usage trends, and security incident frequency, and expert consensus guides scenario bounds. Where supplier roll-ups are incomplete, interpolation using regional GDP shares bridges gaps before the final cross-check.
Data Validation & Update Cycle
Outputs pass a two-layer analyst review, variance checks against third-party indicators, and corrective re-contacts if deviations exceed preset thresholds. Reports refresh every twelve months, and a mid-cycle update is triggered when material events, such as large mergers or sudden cash-withdrawal spikes, alter assumptions.
Why Mordor's Secure Logistics Baseline Earns Decision-Makers' Trust
Published estimates often diverge because firms track different service mixes, use varied currency conversions, and refresh models on dissimilar cadences.
Key gap drivers include inclusion of static guarding revenue, reliance on vendor self-reported figures without cross-checks, and single-region weighting that overstates Europe's share. Our disciplined scoping, dual-track modeling, and annual update rhythm temper such swings.
Benchmark comparison
| Market Size | Anonymized source | Primary gap driver |
|---|---|---|
| USD 47.62 B (2025) | Mordor Intelligence | - |
| USD 101.31 B (2025) | Global Consultancy A | Bundles secure warehousing and personal courier services, limited bottom-up validation |
| USD 91.51 B (2024) | Industry Journal B | Europe-centric scope and vendor revenue roll-ups without demand-side triangulation |
| USD 69.32 B (2024) | Trade Publication C | Merges static guarding revenue and applies inconsistent base-year exchange rates |
Taken together, the comparison shows that Mordor's carefully delimited scope, transparent variables, and repeatable steps provide a balanced, traceable baseline that clients can rely on for confident planning.


Key Questions Answered in the Report
What is the current value of the secure logistics market?
The secure logistics market stands at USD 51.21 billion in 2026 and is forecast to reach USD 73.66 billion by 2031.
Which region leads the secure logistics market?
Asia-Pacific holds the largest regional share at 31.60% in 2025, thanks to high cash-on-delivery volumes and expanding ATM networks.
Which application segment grows the fastest?
Jewelry & precious metals is set to register a 9.52% CAGR during 2026-2031 due to heightened demand for secure precious-metal transportation.
Why are mobile secure logistics services gaining traction?
Clients seek flexible, route-optimized solutions with real-time tracking, driving an 8.55% CAGR for mobile services.
How are regulations influencing the secure logistics industry?
Electronic Logging Device mandates and similar rules push carriers to adopt advanced telemetry, enhancing compliance and operational efficiency.
What technological trends shape competitive strategy?
AI-enabled surveillance, blockchain shipment tracking, and electric armored vehicles are key differentiators among leading providers.
Page last updated on:


