
Pharmaceutical Excipients Market Size and Share
Market Overview
| Study Period | 2020 - 2031 |
|---|---|
| Market Size (2026) | USD 11.53 Billion |
| Market Size (2031) | USD 16.62 Billion |
| Growth Rate (2026 - 2031) | 7.57 % |
| Fastest Growing Market | Asia Pacific |
| Largest Market | North America |
| Market Concentration | Medium |
Major Players *Disclaimer: Major Players sorted in no particular order Image © Mordor Intelligence. Reuse requires attribution under CC BY 4.0. | |
Pharmaceutical Excipients Market Analysis by Mordor Intelligence
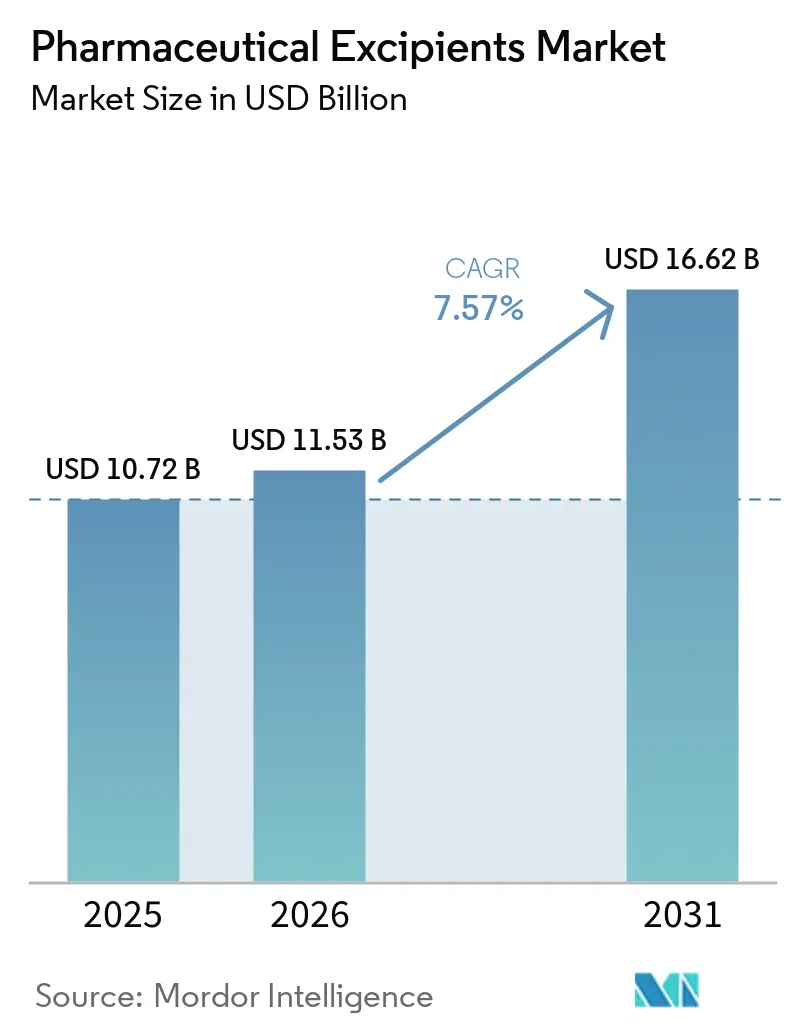
The pharmaceutical excipients market size is expected to grow from USD 10.72 billion in 2025 to USD 11.53 billion in 2026 and is forecast to reach USD 16.62 billion by 2031 at 7.57% CAGR over 2026-2031. Robust expansion stems from the growing use of sophisticated drug-delivery platforms, the shift toward continuous manufacturing, and rising demand for excipients that stabilize high-potency active ingredients. Polymer-based processing aids suited to twin-screw granulation and hot-melt extrusion underpin formulation efficiencies, while biosimilar proliferation elevates the need for protein-friendly stabilizers. Manufacturers are relocating production to cost-efficient regions to mitigate supply-chain risk and leverage local sourcing advantages, especially across Asia-Pacific, which supports a diversified supplier base and competitive pricing.
Key Report Takeaways
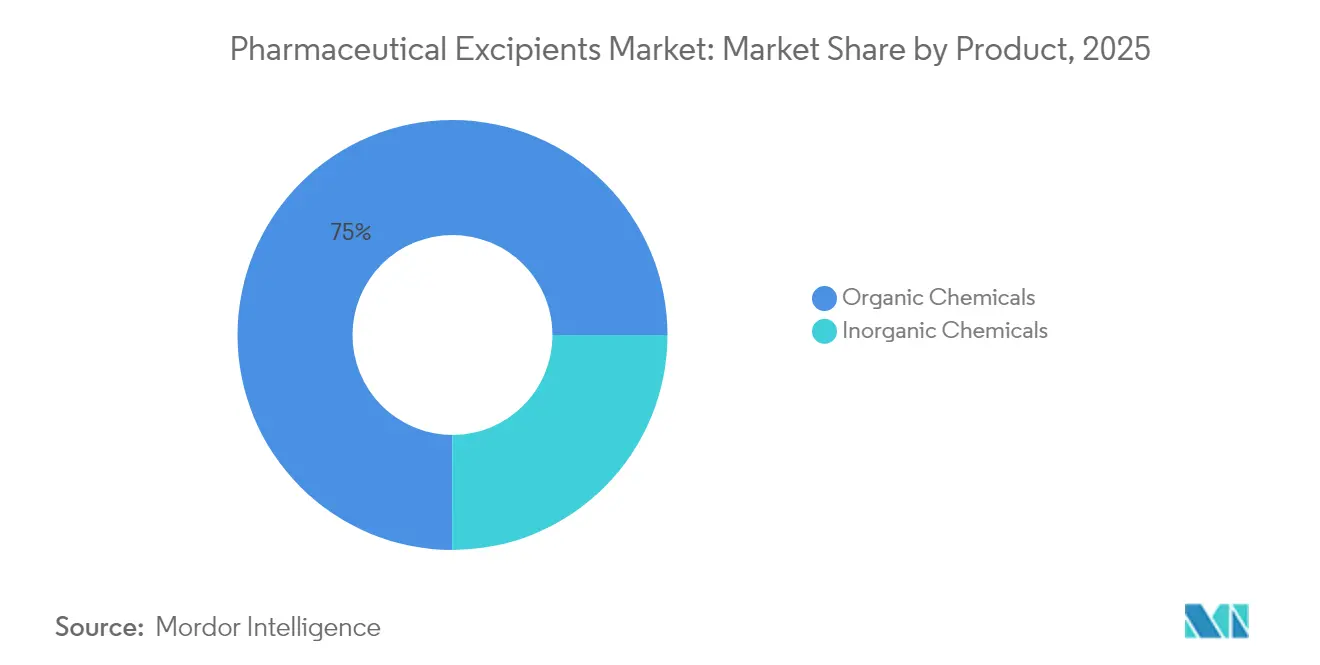
- By product type, organic chemicals accounted for 74.97% of the 2025 pharmaceutical excipients market share, while inorganic halites are forecast to register the strongest CAGR of 7.41% through 2031.
- By functionality, sustained-release agents are projected to advance at a high single-digit CAGR of 7.12%, whereas fillers and diluents retained the largest 2025 volume share at 32.12% of the pharmaceutical excipients market size.
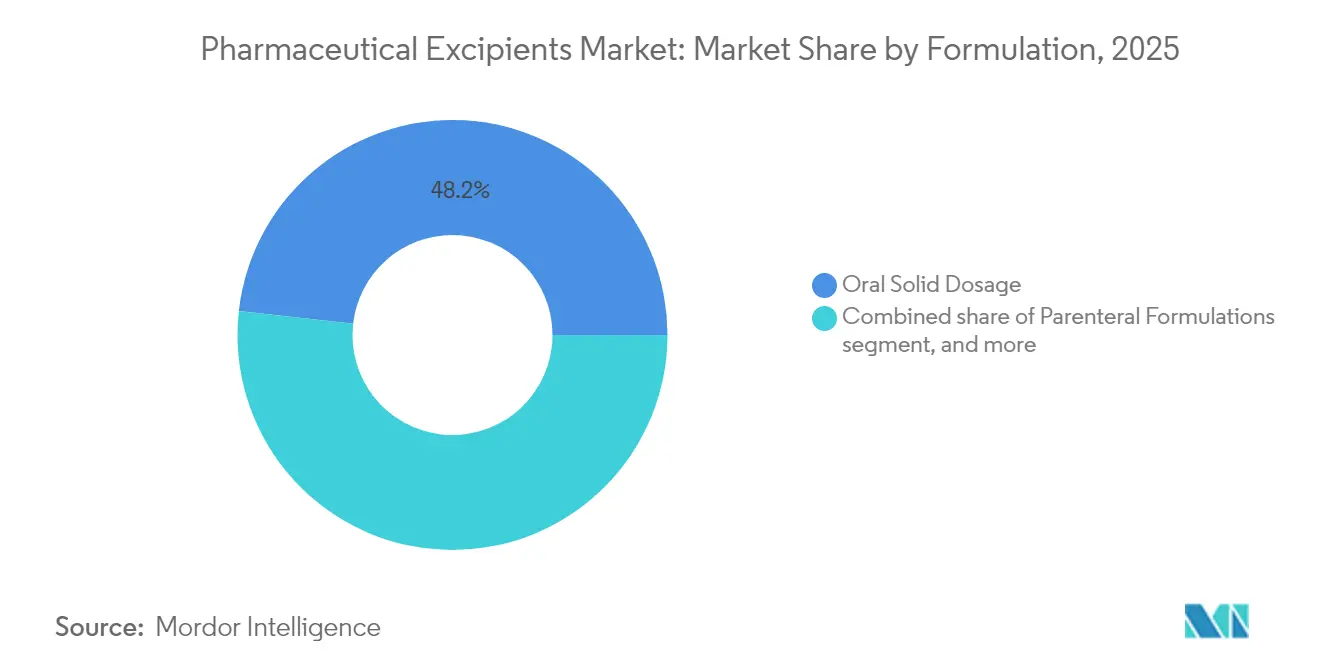
- By formulation, parenteral is projected to deliver 8.01% of CAGR from 2026 to 2031, outpacing tablets even though oral solids still held 48.22% of 2025 demand.
- By source, plant-based materials achieved a 31.76% share of the pharmaceutical excipients market in 2025, reflecting heightened sustainability and clean-label mandates.
- Regionally, Europe led with 37.26% of 2025 revenue; the Middle East is on track for a 6.34% CAGR between 2026 and 2031, the fastest worldwide.
Note: Market size and forecast figures in this report are generated using Mordor Intelligence’s proprietary estimation framework, updated with the latest available data and insights as of 2026.
Global Pharmaceutical Excipients Market Trends and Insights
Drivers Impact Analysis*
| Driver | % Impact on CAGR Forecast | Geographic Relevance | Impact Timeline |
|---|---|---|---|
| Multifunctional novel excipients for high-potency APIs | +1.2% | North America & EU; global adoption | Medium term (2–4 years) |
| Biopharmaceutical excipients supporting biosimilar expansion | +1.8% | North America & Asia-Pacific | Long term (≥ 4 years) |
| Growth in orally disintegrating tablets boosting superdisintegrants | +0.9% | Developed markets worldwide | Short term (≤ 2 years) |
| Continuous manufacturing requiring polymer-based aids | +1.4% | North America & EU; expanding in Asia-Pacific | Medium term (2–4 years) |
| Formulation outsourcing relocation to India | +0.8% | Asia-Pacific core; spill-over to MEA | Long term (≥ 4 years) |
| Preference for plant-derived excipients | +0.7% | Global; regulatory push in EU | Medium term (2–4 years) |
| Source: Mordor Intelligence | |||
Rise of Multifunctional Novel Excipients for High-Potency APIs
Formulators working with potent oncology and immunology drugs now demand excipients that combine binding, disintegration, and flow-enhancing roles in one material[1]Chirag Parmar, “Co-Processed Excipients for High-Potency APIs,” Expert Opinion on Drug Delivery, tandfonline.com. Co-processed platforms reduce unit operations, lower dust exposure, and deliver uniform content, making them attractive for continuous lines. Regulatory dossiers remain challenging because safety data must cover combined functionalities, which lengthens approval cycles. North American innovators hold early know-how, yet European manufacturers are rapidly scaling pilot plants to capture demand. Over the medium term, rising potency thresholds in pipeline molecules will keep multifunctional grades at the center of purchasing decisions.
Surging Demand for Biopharmaceutical Excipients Supporting Biosimilars Expansion
Biosimilar launches following monoclonal antibody patent cliffs have lifted global requirements for high-purity sugars, amino acids, and surfactants that guard protein structure during processing[2]Dorra Lahmo, “Biosimilar Wave Spurs Excipients Demand,” BioPharm International, biopharminternational.com. Suppliers often co-develop stabilizers to match reference biologics’ profiles while demonstrating bioequivalence with different compositions. Liquid formulations for at-home autoinjectors further magnify stability demands, making low-endotoxin and low-aggregate excipients critical. Costs remain high because multi-column chromatography and aseptic filtration add complexity, yet large-scale capacity in Asia-Pacific is narrowing price gaps. Long-term growth hinges on maintaining stringent microbial specs as volumes ramp.
Growth in Orally Disintegrating Tablets Driving Superdisintegrants Consumption
Pediatric and geriatric adherence programs motivate formulators to design tablets that disperse within 30 seconds, pushing uptake of crospovidone and sodium starch glycolate. The FDA’s first 3-D-printed ODT approvals demonstrate how additive manufacturing meets personalization goals. Superdisintegrants must now balance rapid swelling with mechanical strength to survive downstream packaging. Natural variants sourced from sago starch offer clean-label benefits and address petrochemical solvent concerns. Short-term growth is concentrated in Europe and the United States, yet emerging markets are quickly adopting ODTs for over-the-counter lines.
Shift Toward Continuous Manufacturing Requiring Polymer-Based Processing Aids
Regulators actively encourage continuous lines that deliver real-time release testing and fewer deviations, prompting demand for microcrystalline cellulose grades optimized for twin-screw granulation. Excipients require narrow particle-size distribution and consistent moisture sorption to fit small operating windows. Suppliers are investing in process-analytical-technology toolkits to help customers integrate materials seamlessly. Adoption began in North America and Western Europe but is now accelerating among Indian contract development and manufacturing organizations. Continuous processing is expected to reshape raw-material specifications industry-wide over the next four years.
Restraints Impact Analysis*
| Restraints Impact Analysis | (~) % Impact on CAGR Forecast | Geographic Relevance | Impact Timeline |
|---|---|---|---|
| Regulatory variability across regions | -1.1% | Global; emerging markets most affected | Long term (≥ 4 years) |
| High purity requirements escalating costs | -0.8% | Developed markets worldwide | Medium term (2–4 years) |
| Agricultural commodity price volatility | -0.6% | Global; dependent on sourcing mix | Short term (≤ 2 years) |
| Toxicological concerns over petrochemical residuals | -0.4% | EU & North America; spreading globally | Medium term (2–4 years) |
| Source: Mordor Intelligence | |||
Regulatory Variability Across Regions Limiting Global Launch Harmonization
Differing dossier formats and excipient listing rules among the FDA, EMA, and regulators in India, Brazil, and China prolong development timelines. The International Council for Harmonisation continues to draft Q14 and Q2(R2) guidelines, yet risk-assessment philosophies vary, especially for multifunctional materials. Companies maintain region-specific master files, inflating administrative overhead and delaying worldwide rollouts. Variability is especially burdensome for small and midsize innovators that lack dedicated regulatory teams. Harmonization progress remains slow, suggesting the restraint will linger into the next decade.
Toxicological Concerns Over Residual Solvents in Petrochemical Excipients
Authorities scrutinize polyethylene glycol, povidone, and other petroleum-derived materials for potential ethylene glycol contamination, prompting United States Pharmacopeia monograph revisions that tighten impurity limits[3]United States Pharmacopeia, “Revision Bulletin: Polyethylene Glycol 40 Castor Oil,” usp.org. Europe’s precautionary principle magnifies risk perception, encouraging a slow pivot away from certain synthetic vehicles. Compliance pushes suppliers toward costly revalidation programs and drives reformulation projects across finished-dose lines. Although the impact on CAGR is smaller than other restraints, ongoing safety assessments sustain medium-term headwinds.
*Our forecasts treat driver/restraint impacts as directional, not additive. The impact forecasts reflect baseline growth, mix effects, and variable interactions.
Segment Analysis
By Product: Dominance of Organic Chemicals Amid Inorganic Innovation
Organic chemicals made up 74.97% of pharmaceutical excipients market share in 2025, underscoring continued reliance on cellulose, lactose, and starch derivatives for tableting efficiency. The pharmaceutical excipients market size linked to organic categories is expanding steadily because cellulosics match clean-label preferences and retain robust compendial support. Continuous manufacturing further elevates demand for polymer grades engineered to withstand shear and moisture variability. In contrast, inorganic halites such as sodium chloride and potassium chloride display the quickest 7.41% CAGR through 2031, owing to their role in osmotic pumps and modified-release cores. These mineral salts offer stable ionic strength profiles critical for high-load APIs in specialized dosage forms.
Innovation is creating cross-category synergies: oleochemicals derived from fatty acids bridge parenteral and oral use by offering low immunogenicity alongside lubricity advantages. Protein-based stabilizers, though smaller by volume, command premium pricing because they avert aggregation in biologics. Formulators scrutinize petrochemicals for solvent residues, nudging them toward bio-based analogs with equivalent flow properties. As continuous lines proliferate, excipients with tight PSD controls and low endotoxin profiles will dominate procurement lists.



By Functionality: Fillers Led While Sustained-Release Agents Accelerate
Fillers retained 32.12% share of the pharmaceutical excipients market in 2025, reflective of their indispensable role in achieving target tablet weights and mechanical strength. Lactose monohydrate and microcrystalline cellulose remain default options, yet DMF-graded mannitol and isomalt gain traction where moisture sensitivity persists. The rise of controlled-release therapies elevates sustained-release polymers, which are forecast to grow at 7.12% CAGR to 2031, highlighting patient-centric adherence objectives. Controlled-release therapies are increasing demand for polymers used in sustained release excipients. These hydrophilic matrices moderate plasma peaks, supporting chronic disease regimens.
Binders designed for twin-screw wet granulation deliver consistent viscosity under elevated shear, meeting continuous-processing specs. Superdisintegrants graduate from simple swelling agents to critical performance determinants in fast-dissolve formats. Meanwhile, coatings evolve from basic protective films to multifunctional layers providing enteric resistance, taste masking, and brand differentiation. Co-processed excipients blur functionality boundaries by merging binding and disintegration, simplifying bill-of-materials while easing regulatory change control.
By Formulation: Oral Dominance Challenged by Parenteral Growth
Oral solids accounted for 48.22% of pharmaceutical excipients market size in 2025, anchored by cost-effective manufacturing and patient familiarity. Tablets, capsules, and multiparticulates benefit from mature regulatory frameworks and high-speed processing lines. However, parenteral formulations exhibit the fastest 8.01% CAGR through 2031 because mAbs, recombinant proteins, and RNA therapeutics require injectable routes for bioavailability. Excipients for injections must be pyrogen-free and isotonic, driving higher purity specifications and specialized filtration steps.
Topical and transdermal platforms attract niche investments, leveraging permeation enhancers and bioadhesive polymers to deliver systemic dosing without needles. Pulmonary formulations witnessed renewed focus after mRNA vaccine dry-powder feasibility studies, spurring demand for low-density carriers such as mannitol. Ophthalmic solutions maintain strict microbial limits and particulate controls, keeping the category relatively insulated from raw-material substitutions. As self-administration devices proliferate, all formulation types will rely on excipients that support viscosity modulation and long-term stability.
By Source: Plant-Based Leadership Alongside Synthetic Precision
Plant-derived materials captured 31.76% of pharmaceutical excipients market share in 2025, propelled by sustainability campaigns and consumer trust. Corn-based dextrose, wheat starch, and microcrystalline cellulose gain certification under non-GMO and allergen-free programs, giving them a marketing edge. Synthetic excipients, though projected for the briskest 6.91% CAGR, shine where reproducible rheology and batch-to-batch uniformity are mandatory, particularly in complex injectables.
Animal-origin gelatin sees erosion due to halal, kosher, and porcine-free preferences, while marine polysaccharides such as chitosan carve out roles in wound dressings and mucoadhesive nasal sprays. Mineral sources gain relevance as formulators phase out titanium dioxide, turning to calcium carbonate for opacity and color masking. The pharmaceutical excipients industry balances ecological commitments with stringent performance benchmarks, fostering parallel growth tracks for botanical and engineered materials.
Geography Analysis
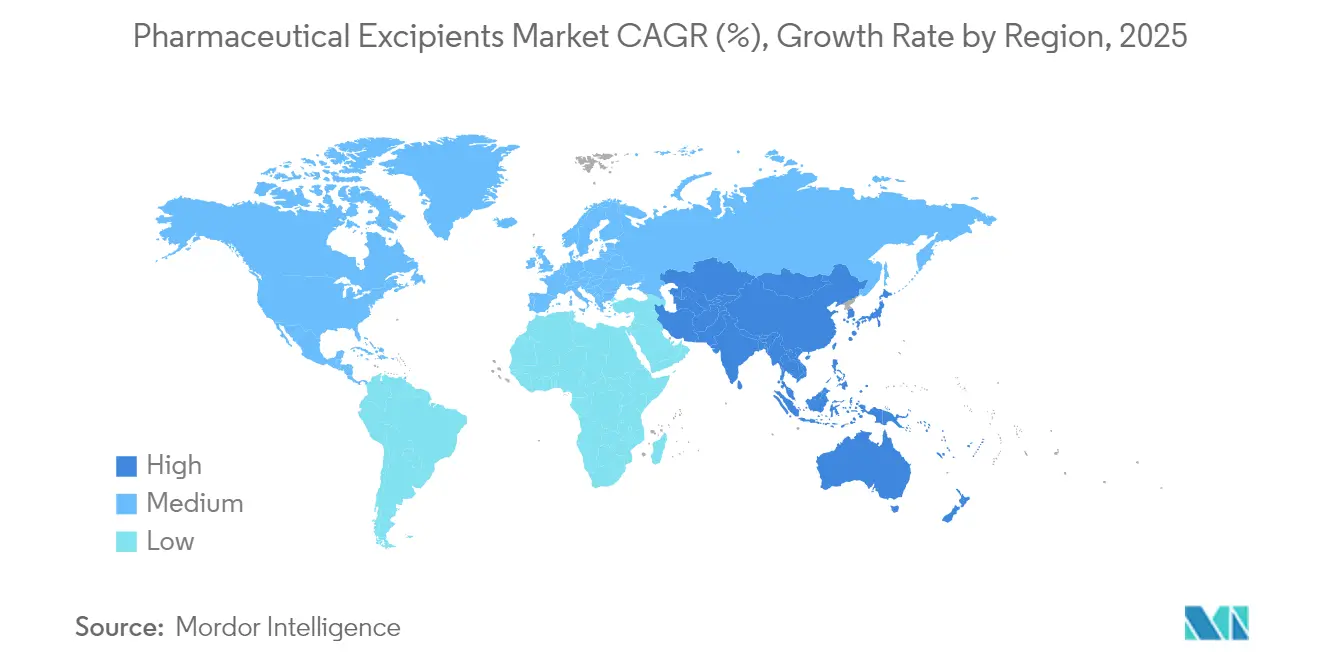
North America maintained 36.88% share of the pharmaceutical excipients market in 2025, boosted by a dense cluster of innovators, rigorous regulatory oversight, and early adoption of continuous processing. Suppliers capture premium margins on parenteral-grade polysorbates, cyclodextrins, and tailored celluloses used in biologics. Despite leadership, manufacturers face logistics vulnerabilities highlighted by recent supply shocks, prompting contingency sourcing initiatives.
Asia-Pacific is forecast to log a 6.18% CAGR through 2031, spearheaded by India’s formulation outsourcing surge and China’s scale-up of domestic biologic lines. Contract development and manufacturing organizations in Hyderabad and Suzhou secure multinational contracts that mandate local excipient supply under global quality standards. Investments in spray-dried mannitol, HPMC, and poloxamer plants support regional autonomy. Simultaneously, governments direct incentives toward compliance upgrades, closing historical quality gaps.
Europe represents a mature yet innovative territory, pioneering clean-label policies and biodegradable polymer research that ripple through global standards. Regulatory clarity enables swift uptake of plant-derived carriers and non-petrochemical lubricants. Latin America and the Middle East & Africa show incremental demand as national pharmacopeias toughen import regulations, catalyzing local production ventures for starches and calcium phosphates. Currency-risk mitigation and shorter lead times make domestic sourcing attractive, gradually reshaping trade flows.

Regulatory Landscape
Global excipient commercialization continues to be driven by region-specific filings and compendial compliance requirements. In the United States, excipients rely on Type IV Drug Master Files (DMFs), while Canada uses Master Files (Type III) for excipients. In 2025, standard-setting added new compliance touchpoints for both suppliers and users, including the March 2025 revision of NSF/ANSI 363-2024 (GMP for pharmaceutical excipients) and ongoing pharmacopoeial updates that can trigger specification and documentation changes across multi-compendial supply chains.
In 2026, industry guidance and agency positions sharpened expectations around characterization, stability, and complex excipient categories used in advanced dosage forms. The IPEC Federation issued updated 2026 versions of its Stability Guide, Qualification of Excipients guide and checklist, and Composition Guide, supporting more structured supplier qualification and change control. In the EU, EMA guidance for co-processed excipients in solid oral dosage forms reached a legal effective date in August 2026, raising the bar for demonstrating performance and quality attributes for multifunctional blends. ICH work such as the Q3E extractables and leachables draft guideline (endorsed in 2025) also increased scrutiny of materials that contact drug products and manufacturing systems.
Competitive Landscape
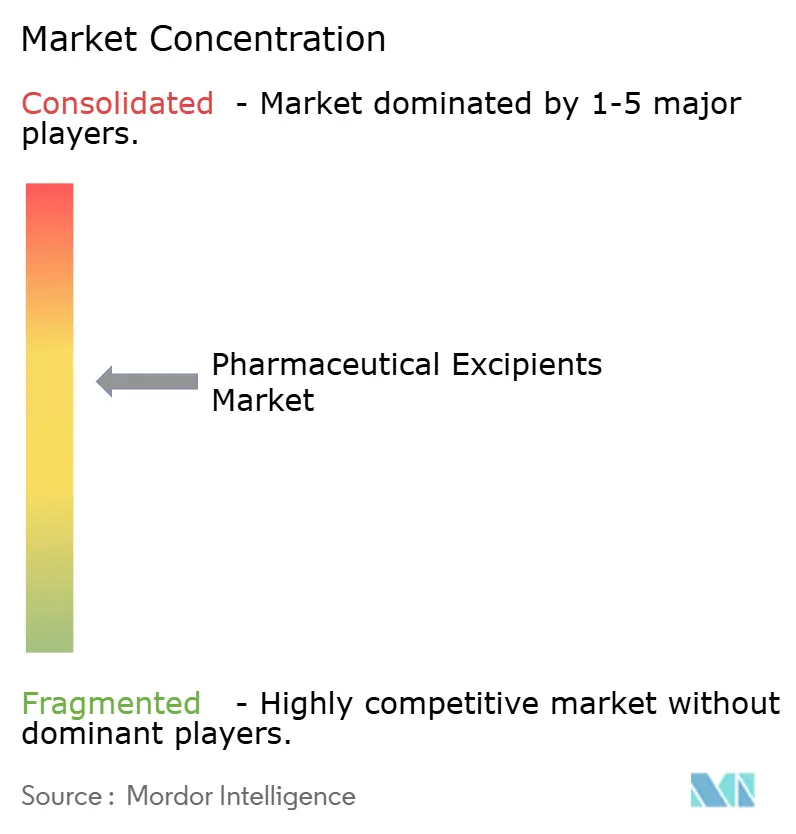
Moderate fragmentation characterizes the pharmaceutical excipients market, with leading multinationals leveraging process expertise, global plants, and broad dossiers to defend share. BASF SE, Ashland Global Holdings, and DuPont de Nemours compete by offering end-to-end technical service portals, accelerated sample shipping, and regional application labs. Their integrated supply chains support quick scale-ups, a vital differentiator as continuous processing shortens commercialization timelines.
Strategic consolidation is redefining competitive contours. Roquette’s USD 2.85 billion purchase of IFF Pharma Solutions in 2024 merged two cellulose and mannitol powerhouses, intensifying rivalry in oral-solids excipients. Meanwhile, BASF’s digital formulation tools ZoomLab and MyProductWorld integrate predictive models that trim formulation cycles for clients, embedding the supplier deeper into development pipelines. Collaboration models also proliferate; Avantor linked with Rubicon Research to co create gastro-retentive platforms that enhance drug residence time in the stomach.
New entrants target specialty niches such as low-endotoxin sugars or marine-based polymers, yet high capital barriers and stringent GMP audits shelter incumbents. Commodity suppliers face margin pressure from agricultural price swings and regulatory demands for traceability. Market participants who combine backward integration with robust quality systems stand to weather volatility better than import-reliant distributors.
Pharmaceutical Excipients Industry Leaders
BASF SE
Ashland Global Holdings Inc.
DuPont de Nemours Inc.
Roquette Frères SA
Evonik Industries AG
- *Disclaimer: Major Players sorted in no particular order

Market Opportunities and Future Outlook
A clear gap is emerging around regionalized, cGMP-grade supply for sensitive excipient classes used in biologics, complex injectables, and enabling technologies (autoinjectors, prefilled systems, and continuous manufacturing). In March 2026, Clariant announced a multi-phase expansion at its Clear Lake, Texas site to add cGMP manufacturing of pharmaceutical-grade polyethylene glycol (PEG) excipients for North and Latin American markets, reflecting the premium placed on dependable local supply for formulation-critical polymers. Alongside this, Asia-based production expansion supports continuity and lead-time reduction, with Shoko starting full-scale commercial production of its pharmaceutical excipient Viscomedi in South Korea in February 2026.
Engineered and co-processed excipients also represent a near-term focus, particularly materials designed to reduce unit operations and work within narrow process windows for direct compression and continuous lines. This aligns with regulators encouraging modern manufacturing approaches and with customer goals for faster tech transfer. On the specialty side, validated, pharma-ready lipid and solubilizing excipients are drawing attention as products target bioavailability and stability constraints, supported by Gattefosse validating strategic ingredients at its Lufkin, Texas facility in July 2026, including pharmaceutical excipients such as Peceol, Compritol 888, and Geleol Mono and Diglycerides NF. At the same time, tighter contaminant control expectations, including ethylene glycol and diethylene glycol monitoring, and EU excipient labelling requirements continue to create demand for suppliers that can deliver multi-compendial documentation, low-impurity profiles, and robust traceability across plant-based and synthetic portfolios.
Recent Industry Developments
- April 2026: Ashland expanded its worldwide distribution agreement with Wacker Chemie AG, naming Wacker as the sole channel partner for certain product lines. The change strengthens supply continuity and reach for excipient and specialty ingredient customers across regions, while simplifying go-to-market execution through a single global route.
- October 2025: Ashland introduced Vialose sucrose for parenteral formulations, positioned for low endotoxin performance (below 0.2 EU/g) and aligned to multiple pharmacopoeial monographs (NF, EP, JP, BP, and ChP). This supports biopharma and injectable developers seeking high-purity carbohydrate excipients with a clearer compliance and qualification package.
- October 2024: Lotte Fine Chemical signed a USD 740 million, 10-year distribution agreement with Colorcon for pharmaceutical cellulose products. The long-duration arrangement reinforced availability and channel scale for core oral-solid excipients, tightening competitive dynamics in celluloses used for direct compression and controlled-release formulations.


Research Methodology Framework and Report Scope
Market Definition and Coverage
This market covers pharmacologically inactive substances that are added to drug formulations to support processing, stability, and delivery of the active ingredient. We capture the value at the excipient sales level across major dosage forms.
Scope exclusions: We exclude active pharmaceutical ingredients, packaging materials, and finished-dose medicine revenues from this sizing.
Segmentation Overview
- By Product
- Organic Chemicals
- Carbohydrates
- Petrochemicals
- Oleochemicals
- Proteins
- Other Organic Chemicals
- Inorganic Chemicals
- Halites
- Metal Oxides
- Silicates
- Other Inorganic Chemicals
- Organic Chemicals
- By Functionality
- Fillers & Diluents
- Binders
- Suspension and Viscosity Agents
- Coatings (Film & Enteric)
- Flavoring Agents
- Disintegrants
- Colorants
- Preservatives
- Other Functionalities
- By Formulation
- Oral Solid Dosage Forms
- Parenteral Formulations
- Topical & Transdermal
- Pulmonary/Inhalation
- Ophthalmic
- Others (Sublingual, Buccal, etc.)
- By Source
- Plant-based
- Animal-based
- Synthetic
- Mineral-based
- Marine-based
- Geography
- North America
- United States
- Canada
- Mexico
- Europe
- Germany
- United Kingdom
- France
- Italy
- Spain
- Rest of Europe
- Asia-Pacific
- China
- Japan
- India
- Australia
- South Korea
- Rest of Asia-Pacific
- Middle East & Africa
- GCC
- South Africa
- Rest of Middle East & Africa
- South America
- Brazil
- Argentina
- Rest of South America
- North America
Data Sources, Market Sizing, and Validation
Desk Research
Desk research was used to build the base demand picture for excipients and to set guardrails for regional splits and usage intensity by dosage form. We relied on public sources such as the US FDA database and guidance documents, the European Medicines Agency publication pages, the WHO medicine quality resources, and national statistics portals that publish pharma manufacturing indicators and trade data.
We also reviewed manufacturer annual reports, investor decks, and trusted industry press to understand capacity additions, product launches, and sourcing shifts that can change volumes and pricing. In addition, we used a paid subscription for company financials and news, plus a patent database to sanity-check innovation activity around formulation aids and polymer systems. This list is not exhaustive, and additional public and paid sources were used to gather data, cross-check assumptions, and clarify open questions during the research process.
Primary Interviews and Surveys
Primary interviews and surveys helped us test what we saw in public data, especially around excipient usage rates per dosage form, the share of specialty versus commodity grades, and typical pricing moves by region. We spoke with a mix of raw-material suppliers, excipient manufacturers, distributors, and formulation and procurement stakeholders across APAC, EMEA, and the Americas, so the model could be corrected where desk signals were weak, lagging, or conflicting.
Distribution of primary research fieldwork respondents
| Company type | Respondent position | Region |
|---|---|---|
| Top tier: 33% | CXOs: 17% | APAC: 45% |
| Mid tier: 50% | Functional/Unit leaders: 34% | EMEA: 29% |
| Smaller Players: 17% | Managers: 49% | Americas: 26% |
Market-Sizing & Forecasting
Sizing starts from a top-down build where pharma manufacturing output and trade flows are translated into an excipient consumption pool using formulation-level intensity factors, then value is derived through blended pricing by excipient class and grade. We then corroborate results with selective bottom-up approximations, including sampled supplier revenue splits, distributor channel checks, and volume times ASP sanity checks for high-volume functionality groups, which helped us adjust totals where gaps were found.
Key inputs used in the model include the mix shift between oral solids and other dosage forms, the growth pace of generics versus specialty drugs, the adoption of controlled-release and polymer-based processing aids, regional manufacturing relocation patterns, and commodity feedstock cost pass-through that affects pricing. For forecasting, we used scenario analysis supported by a light multivariate regression layer, linking demand growth to pharma output indicators and dosage-form mix, while pricing is guided by expected cost and grade-mix changes shared by primary respondents. Where country-level data was thin, we applied nearby-market proxies first and then pressure-tested those assumptions through interviews before finalizing the roll-up.
Data Validation & Update Cycle
To validate outputs, we triangulated modeled totals against independent signals like pharma production direction, import and export movements for key excipient groups, and the implied excipient-to-drug manufacturing ratio by region. If a country or functionality line showed an outlier jump, we rechecked assumptions, then completed a second-pass review and, when needed, re-contacted selected respondents to confirm whether the change reflected real volume shifts or timing effects.
Before sign-off, the work goes through multi-step analyst reviews to confirm arithmetic integrity, consistent currency treatment, and that the growth logic matches the stated drivers. Reports are refreshed annually, and interim updates are made when material events occur, such as major capacity expansions, regulation changes, or sharp input-cost shocks. Right before delivery, a final pass is run so clients receive an updated view aligned to the latest available public information.
Mordor Intelligence's Global Pharmaceutical Excipients Market Size Versus Other Published Estimates
Published market sizes for pharmaceutical excipients often differ even when they describe the same scope, mainly because studies count different revenue points and apply different classifications for what qualifies as an excipient. Differences also show up when one estimate uses older price assumptions, or when regional splits are not rechecked against manufacturing and trade signals.
The table shows a relatively small spread for the 2025 to 2026 base period. In Mordor Intelligence's model, the market is counted at the excipient sales level by functionality and region, rather than being blended with adjacent formulation services or broader drug manufacturing value, which can inflate totals. Other gaps can come from how specialty-grade premiums are applied, whether emerging-market production growth is assumed to be faster than observed, and the currency conversion timing used for multinational revenue.
Benchmark comparison
| Source | Market Size | Gaps in Research Methodology |
|---|---|---|
| Mordor Intelligence | USD 11.53 B (2026) | |
| Global Consultancy A | USD 10.57 B (2025) | Uses a different base year and a longer forecast window, and the estimate appears to apply a lower near-term pricing progression, which can pull the starting value down versus a 2026-forward view. |
| Industry Publisher B | USD 10.03 B (2025) | Reports a 2025 starting point and may rely more on segment-level allocations without rechecking dosage-form mix and regional manufacturing shifts, which can change how fast the demand pool scales into the next year. |
Taken together, the differences are mostly explained by base-year selection, how pricing is carried forward, and what gets kept inside the excipient-only revenue line. By keeping the math tied to clear demand drivers like dosage-form mix and regional production signals, the final number stays traceable and repeatable when the assumptions are updated.


Key Questions Answered in the Report
What is the current size of the pharmaceutical excipients market?
The pharmaceutical excipients market was valued at USD 11.53 billion in 2026, with growth projected at a 7.57% CAGR to 2031.
Why are plant-based excipients gaining share?
Sustainability goals, clean-label requirements, and traceable supply chains have lifted demand for cellulose, alginates, and other renewable excipients, raising plant-based share to 31.76% in 2025.
What is driving demand for multifunctional excipients?
High-potency APIs benefit from cyclodextrin derivatives and co-processed blends that improve solubility and handling while cutting formulation steps, accelerating clinical timelines.
How is continuous manufacturing influencing excipient specifications?
Continuous lines require excipients with consistent flow and thermal profiles; low-viscosity hydroxypropylcellulose and similar polymers enable real-time release and reduce batch variability.
What challenges do excipient suppliers face in meeting parenteral purity standards?
High-purity injectable grades demand multi-stage purification and exhaustive impurity testing, raising production costs by up to 300% over oral grades.
Page last updated on:


 Your data is secure and never sold or shared.


