Stable Isotope Labeled Compounds Market Size and Share
Market Overview
| Study Period | 2020 - 2031 |
|---|---|
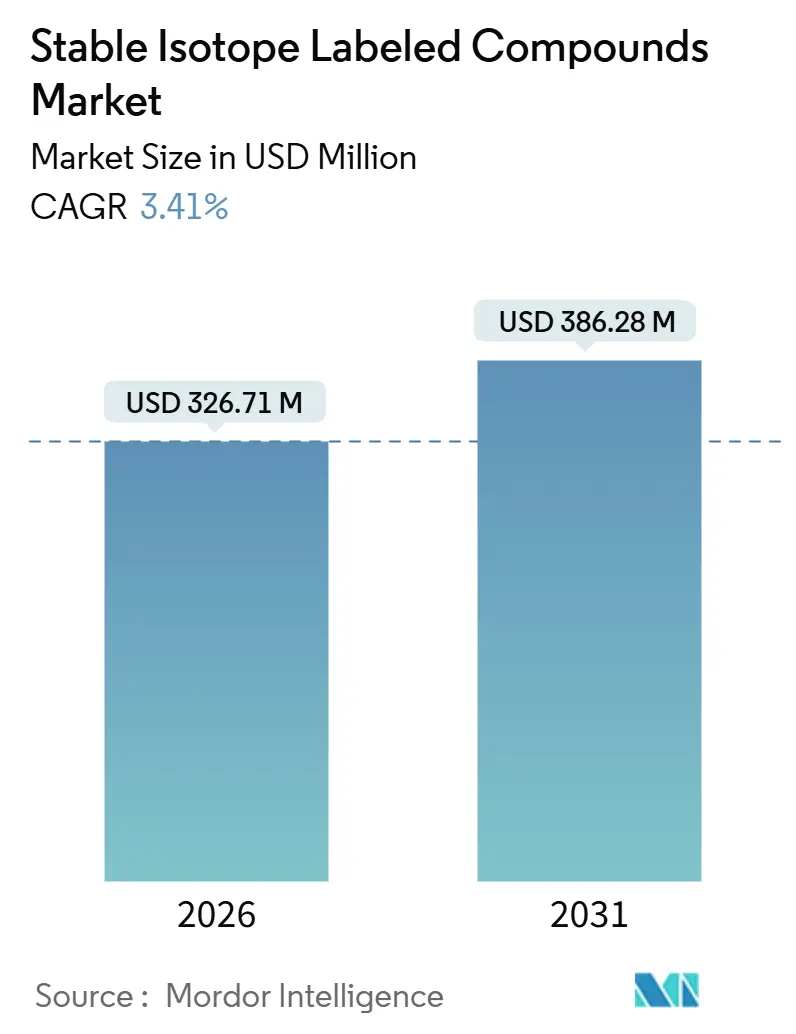
| Market Size (2026) | USD 326.71 Million |
| Market Size (2031) | USD 386.28 Million |
| Growth Rate (2026 - 2031) | 3.41% CAGR |
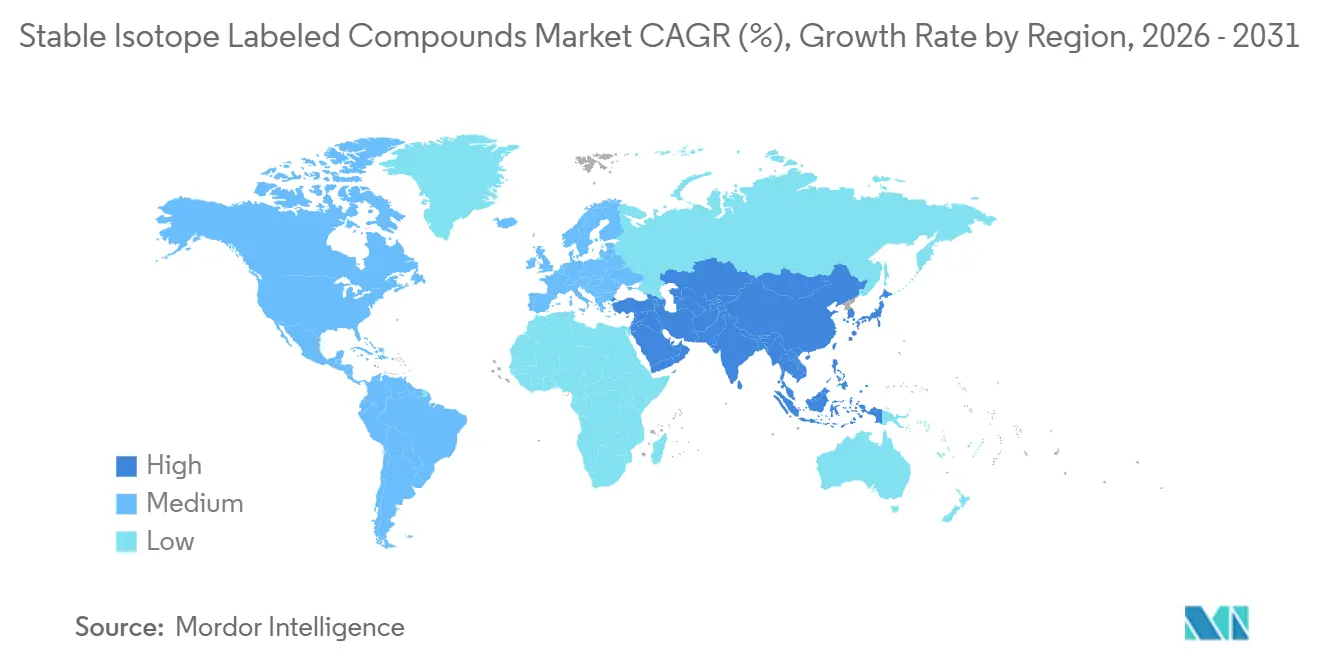
| Fastest Growing Market | Asia Pacific |
| Largest Market | North America |
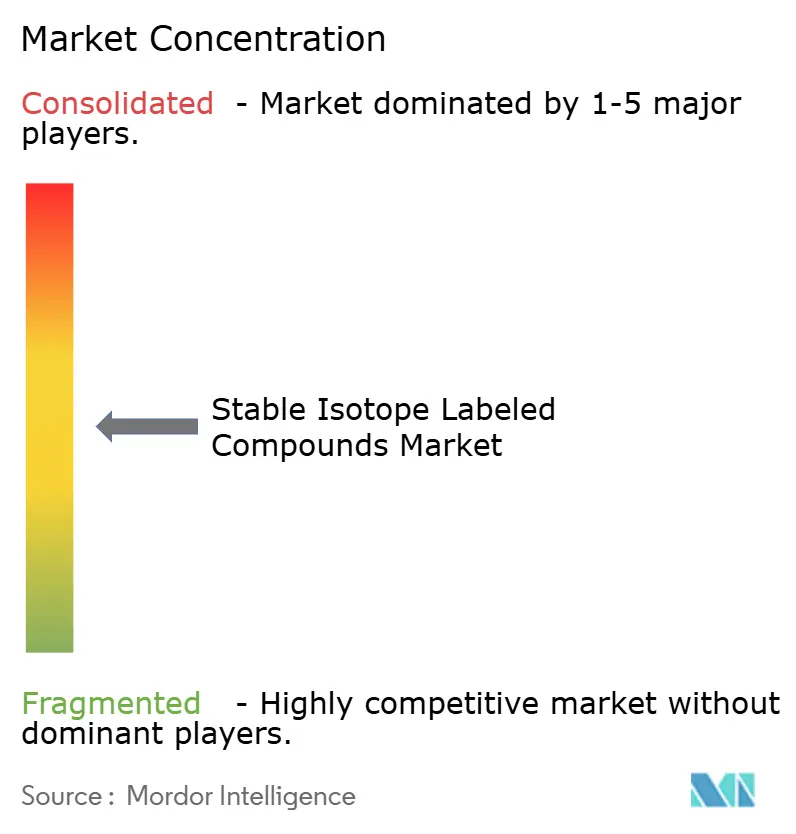
| Market Concentration | Medium |
Major Players *Disclaimer: Major Players sorted in no particular order Image © Mordor Intelligence. Reuse requires attribution under CC BY 4.0. | |
Stable Isotope Labeled Compounds Market Analysis by Mordor Intelligence
The Stable Isotope Labeled Compounds Market size is estimated at USD 326.71 million in 2026, and is expected to reach USD 386.28 million by 2031, at a CAGR of 3.41% during the forecast period (2026-2031).
The continued uptake of isotope-dilution mass spectrometry in drug development workflows, the establishment of fresh domestic enrichment capacity in the United States, and regulatory clarity on microdosing are the primary growth pillars. Pharmaceutical sponsors are outsourcing synthesis to Asian contract laboratories to contain costs, while suppliers face persistent bottlenecks for oxygen-18 water and nitrogen-15 precursors that restrain rapid capacity additions. The U.S. Food and Drug Administration finalized guidance on radiolabeled mass-balance studies in September 2024, reducing uncertainty for early-phase developers that rely on carbon-13 APIs. In parallel, the U.S. Department of Energy brought the Stable Isotope Production and Research Center online at Oak Ridge National Laboratory in 2025, restoring domestic enrichment capability for multiple heavy isotopes. Contract research and manufacturing organizations in China, India, and South Korea are scaling isotope-labeling suites to meet rising offshore demand. Still, export-control rules for dual-use isotopes continue to lengthen lead times and favor established suppliers with robust compliance programs.
Key Report Takeaways
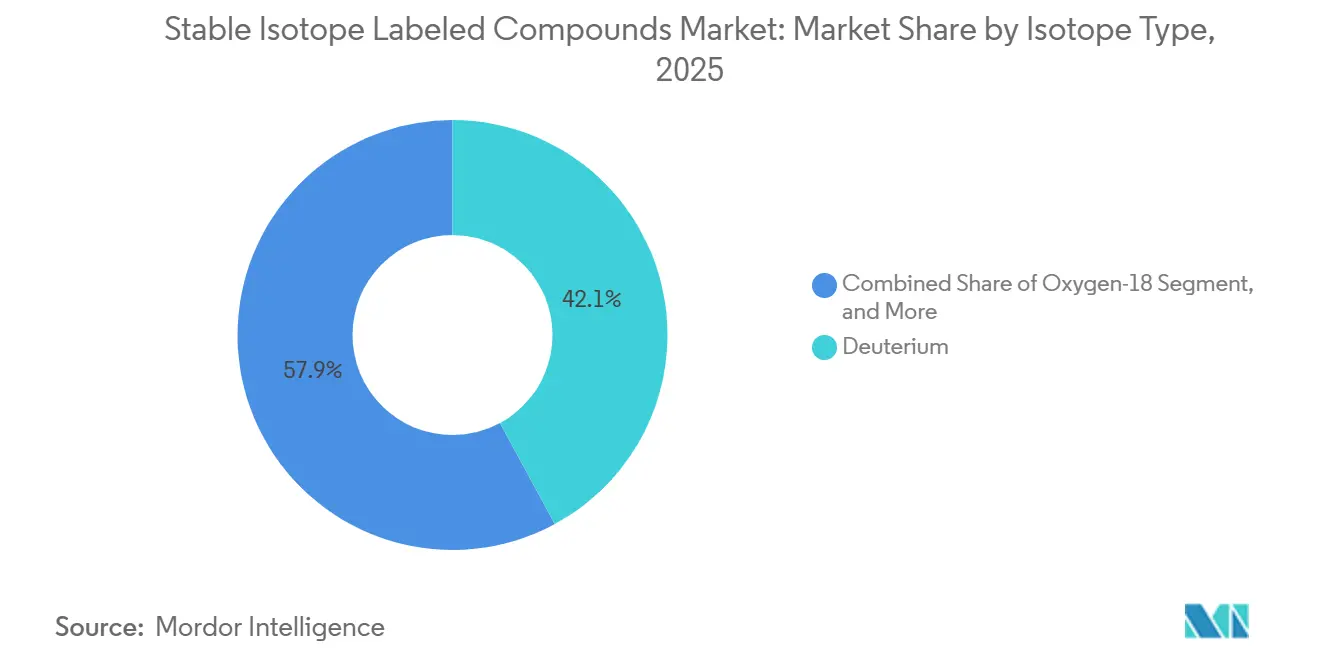
- By isotope type, deuterium compounds led with 42.11% revenue share in 2025; oxygen-18 materials are projected to expand at a 7.02% CAGR through 2031.
- By compound category, amino acids and peptides accounted for a 36.83% share of the stable isotope-labeled compounds market size in 2025. In contrast, active pharmaceutical ingredients are projected to advance at a 7.48% CAGR between 2026 and 2031.
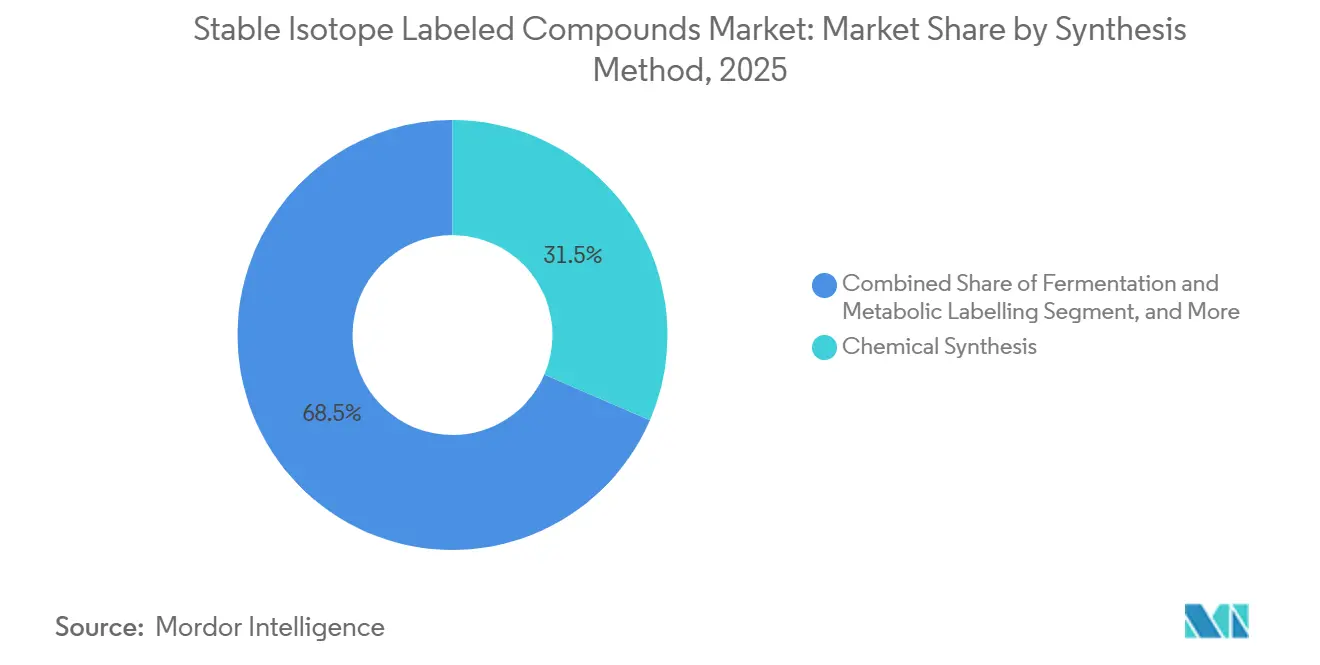
- By synthesis method, chemical synthesis accounted for 31.48% of the 2025 revenue; fermentation and metabolic labeling are forecast to post a 6.13% CAGR through 2031.
- By application, research use captured a 44.64% share in 2025, while clinical diagnostics is expected to expand at an 8.85% CAGR to 2031.
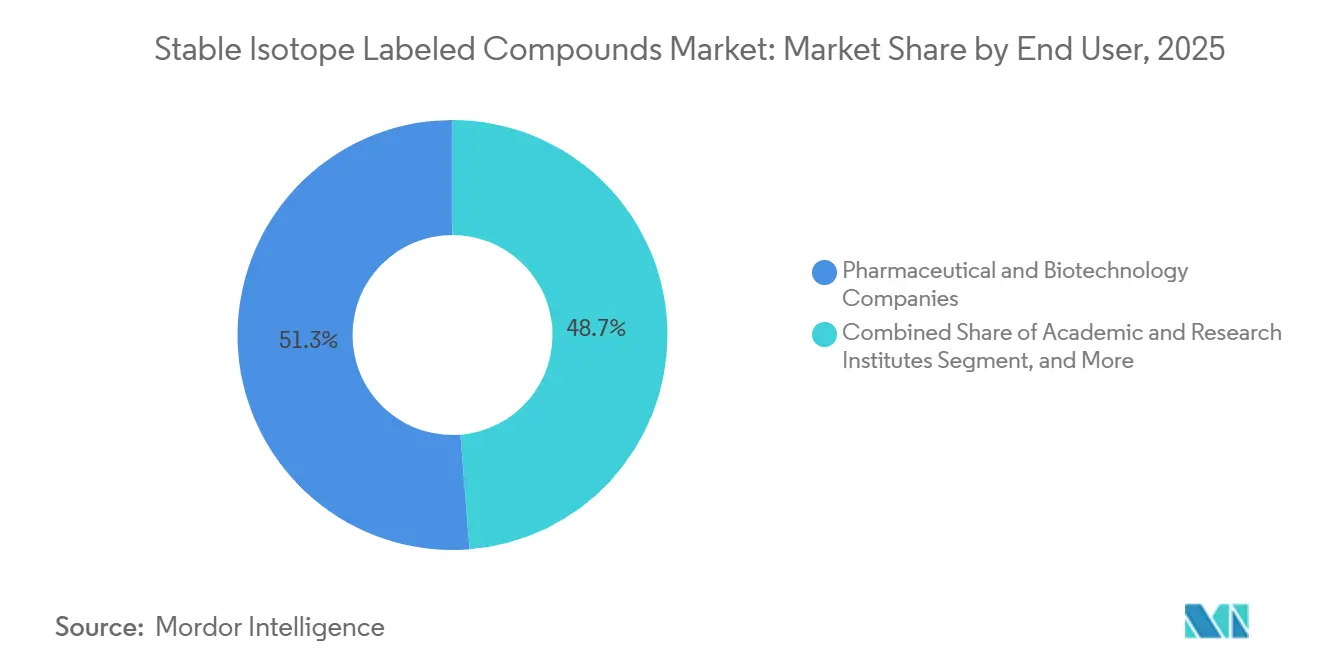
- By end-user, pharmaceutical and biotechnology companies commanded 51.26% share in 2025, whereas contract research and manufacturing organizations are growing at an 8.04% CAGR over the same period.
- By geography, North America retained a 43.38% stable isotope labeled compounds market share in 2025; Asia-Pacific is projected to grow at a 6.04% CAGR through 2031.
Note: Market size and forecast figures in this report are generated using Mordor Intelligence’s proprietary estimation framework, updated with the latest available data and insights as of January 2026.
Global Stable Isotope Labeled Compounds Market Trends and Insights
Drivers Impact Analysis*
| Driver | (~) % Impact on CAGR Forecast | Geographic Relevance | Impact Timeline |
|---|---|---|---|
| Rising Demand for Quantitative Proteomics & Metabolomics | +0.8% | Global, with concentration in North America & Europe | Medium term (2-4 years) |
| Expansion of SIL-based Companion Diagnostics | +0.7% | North America & EU, early adoption in Japan | Medium term (2-4 years) |
| Growing 13C-labelled APIs for Micro-Dosing Regulatory Studies | +0.5% | North America & EU regulatory zones | Short term (≤ 2 years) |
| Heightened Biopharma Outsourcing to Isotope CROs in Asia | +0.6% | APAC core, spill-over to Middle East | Long term (≥ 4 years) |
| Commercialisation of Deep-labeled Reference Standards for PFAS Tracing | +0.4% | North America & EU, expanding to APAC | Medium term (2-4 years) |
| Development of Green, Electro-Enzymatic Isotope-Exchange Synthesis | +0.3% | Global, led by Europe & North America | Long term (≥ 4 years) |
| Source: Mordor Intelligence | |||
Rising Demand for Quantitative Proteomics & Metabolomics
Proteomics and metabolomics laboratories rely on stable isotope-labeled amino acids, peptides, and metabolites to push detection limits below the picomolar range in complex biological matrices. The National Institute of Standards and Technology introduced carbon-13 and nitrogen-15 labeled peptide reference materials in 2024, enabling laboratories to harmonize their calibration protocols.[1]National Institute of Standards and Technology, “Reference Materials for Mass Spectrometry,” nist.gov Academic cores and pharmaceutical discovery groups now require gram-scale supplies of uniformly labeled substrates, steering producers toward fermentation platforms that deliver higher isotopic purity than multi-step chemical routes. Fermentation runs last up to two weeks, constraining throughput when sponsors need custom compounds rapidly. Suppliers are therefore balancing batch-size economics against time-to-delivery commitments, a tension that is shaping capital-investment priorities for 2026 and beyond.
Expansion of SIL-based Companion Diagnostics
Regulators are approving isotope-dilution assays for an expanding roster of targeted therapies, valuing the method’s specificity at low nanogram-per-milliliter biomarker concentrations. The FDA cleared several liquid chromatography mass spectrometry tests for therapeutic drug monitoring in 2025, each anchored by deuterium or carbon-13 internal standards.[2]U.S. Food and Drug Administration, “Mass Balance Studies in Human ADME Trials,” fda.gov Diagnostic laboratories prefer these assays over immunoassays when metabolite interference poses a threat to accuracy. Japan’s Ministry of Health, Labour and Welfare shortened approval timelines for isotope-based in-vitro diagnostics in 2024, accelerating commercialization. Reimbursement reforms in the United States and parts of Europe further strengthen demand, offsetting cost sensitivities in emerging economies.
Growing 13C-Labelled APIs for Micro-Dosing Regulatory Studies
Micro-dosing protocols that administer sub-pharmacological doses of carbon-13 APIs reduce early-stage attrition and animal-use requirements. The FDA’s September 2024 mass-balance guidance explicitly endorses high-resolution LC-MS as an alternative to radiolabels. Roughly 15% of investigational new drug applications filed in North America and Europe during 2025 referenced carbon-13-enriched candidates, a sharp uptick from negligible usage three years earlier. Contract research organizations report lead times of six to nine months for custom carbon-13 synthesis, prompting pharmaceutical sponsors to pre-order labeled precursors during the lead optimization process. This shift is inflating order sizes and stabilizing revenue for isotope suppliers even as headline market growth remains modest.
Heightened Biopharma Outsourcing to Isotope CROs in Asia
Chinese, Indian, and South Korean contract laboratories expanded isotope labeling capacity in 2024 and 2025, attracted by double-digit growth in outsourced synthesis requests. WuXi AppTec added ISO 17034-accredited clean-room suites for peptide labeling, allowing overseas sponsors to save 30% to 40% on high-volume compounds.[3]WuXi AppTec, “Isotope Synthesis Services,” wuxiapptec.com Lower labor expenses offset freight costs; however, North American and European sponsors still reserve proprietary scaffolds for in-house synthesis to avoid intellectual property leakage. The outsourcing wave boosts the contract research and manufacturing organizations segment, which posts the strongest end-user CAGR in the forecast window. Export-control compliance remains a hurdle; shipments of deuterium oxide and nitrogen-15 often require individual licenses, which can add up to 12 weeks to delivery.
Restraints Impact Analysis*
| Restraint | (~) % Impact on CAGR Forecast | Geographic Relevance | Impact Timeline |
|---|---|---|---|
| High Cost & Limited Availability of 18O-Water Feedstock | -0.4% | Global, acute in North America & Europe | Medium term (2-4 years) |
| Complex Export-Control Regulations for Dual-Use Isotopes | -0.3% | Global, most restrictive in North America & EU | Long term (≥ 4 years) |
| Supply-Chain Sensitivity to Enriched Uranium Tails for 15N | -0.3% | Global, concentrated supply in Netherlands & Russia | Medium term (2-4 years) |
| Analytical-Grade Isotope Scarcity for Emerging Ultra-High-Res MS | -0.2% | North America & Europe, emerging in APAC | Short term (≤ 2 years) |
| Source: Mordor Intelligence | |||
High Cost & Limited Availability of 18O-Water Feedstock
Oxygen-18 water sells for more than USD 1,000 per gram at 97% enrichment, and global production capacity remains under 2,000 kilograms per year. Taiyo Nippon Sanso operates a 600-kilogram column in Japan that frequently runs at full tilt. Pharmaceutical and environmental laboratories often ration allocations or shift to deuterium-labeled surrogates when supplies are tight, thereby delaying studies. Building new cryogenic-distillation columns costs above USD 50 million and requires multi-year permitting, discouraging new entrants. Elevated feedstock prices, therefore, cap growth in cost-sensitive applications such as industrial quality control.
Complex Export-Control Regulations for Dual-Use Isotopes
Deuterium oxide, nitrogen-15, and select carbon-13 compounds are listed on the U.S. Commerce Control List and comparable schedules elsewhere, as they can support nuclear or defense activities. Export licenses add eight to 12 weeks to lead times and require extensive end-use documentation that smaller laboratories struggle to provide. Compliance costs favor incumbents with established licensing frameworks, reinforcing market concentration. Sponsors in emerging economies face additional hurdles when local customs authorities request redundant paperwork, which extends clearance times and effectively dampens demand.
*Our forecasts treat driver/restraint impacts as directional, not additive. The impact forecasts reflect baseline growth, mix effects, and variable interactions.
Segment Analysis
By Isotope Type: Deuterium Anchors Revenue, Oxygen-18 Drives Growth
Deuterium compounds generated 42.11% of the 2025 revenue for the stable isotope-labeled compounds market, reflecting their routine use as internal standards in liquid chromatography-mass spectrometry and as solvents for nuclear magnetic resonance spectroscopy. Pharmaceutical laboratories consume kilograms of deuterium-labeled amino acids, peptides, and small molecules annually, benefitting from mature synthesis routes that deliver 98% purity at relatively low cost. Oxygen-18 labeled materials account for a smaller slice but are forecast to expand at a 7.02% CAGR through 2031, driven by the production of positron-emission tomography tracers and environmental tracing of per- and polyfluoroalkyl substances.
Feedstock availability governs the outlook. Deuterium oxide is plentiful, but oxygen-18 water remains supply-constrained, and nitrogen-15 relies on enrichment tails from uranium-processing facilities dominated by Urenco and Russian producers. Cambridge Isotope Laboratories doubled its carbon-13 capacity in October 2024, following the commissioning of the North Star plant, which insulates North American buyers from geopolitical disruptions. Suppliers are exploring membrane-based enrichment for oxygen-18, yet commercial scalability remains elusive.


By Compound Category: Amino Acids Lead, APIs Surge
Amino acids and peptides captured 36.83% of 2025 revenue, reflecting widespread adoption in quantitative proteomics workflows that require uniformly labeled leucine, lysine, and arginine. Fermentation platforms offer incorporation rates above 99%, making them the method of choice for kilogram-scale production. Active pharmaceutical ingredients form the fastest-growing compound category, advancing at a 7.48% CAGR as micro-dosing gains regulatory acceptance. Roughly 15% of investigational new drug applications now specify carbon-13 APIs, catalyzing investment in modular synthesis lines capable of turning around custom molecules in four months.
Metabolites and lipids serve disease-profiling programs, and nitrogen-15 or carbon-13 nucleic acids underpin structural biology and RNA-therapeutics research. Solvents such as deuterated chloroform remain staples in nuclear magnetic resonance, but growth mirrors broader synthetic chemistry activity rather than life sciences innovation.
By Synthesis Method: Chemical Routes Dominate, Fermentation Gains Share
Chemical synthesis accounted for 31.48% of 2025 revenue, prized for its flexibility in positioning heavy isotopes within complex molecules. Catalytic exchange, halogen displacement, and multi-step organic transformations remain indispensable for the synthesis of bespoke scaffolds. Fermentation and metabolic labeling are projected to grow at 6.13% CAGR to 2031, driven by demand for uniformly labeled peptides and nucleotides used in proteomics and structural biology. Enzymatic or exchange methods occupy a niche today but promise greener credentials by cutting solvent waste and energy use, aligning with corporate sustainability goals.
Fermentation cycle times of seven to 14 days restrict throughput; however, ongoing work on continuous bioreactors could potentially compress these timelines. Chemical synthesis will likely retain dominance for oxygen-18 compounds, as biological systems rarely incorporate heavy oxygen efficiently. Cambridge Isotope Laboratories and IsoSciences have filed patents on continuous-flow enzymatic platforms that reduce reaction times from days to hours; however, large-scale Good Manufacturing Practice validation is still pending.
By Application: Research Dominates, Clinical Diagnostics Accelerates
Research applications held 44.64% of 2025 demand, with academic and pharmaceutical groups purchasing standards for pathway mapping and target validation. Clinical diagnostics is the fastest-growing segment at an 8.85% CAGR, buoyed by FDA clearances of isotope-dilution therapeutic-drug monitoring assays. Hospitals appreciate the method’s low interference and coefficient of variation, which is below 5%. Industrial and environmental testing remains relatively small but is poised to benefit from the Environmental Protection Agency’s 2024 update to its analytical methods for fluorinated contaminants.
Reimbursement tailwinds in the United States and Japan strengthen the economic case for isotope-based assays, while European laboratories leverage mutual-recognition agreements to reduce duplicate validations. Academic budgets remain under pressure, yet they are critical for testing emerging applications, such as single-cell proteomics.
By End-User: Pharma Leads, CROs Expand Rapidly
Pharmaceutical and biotechnology companies represented 51.26% of 2025 revenue, relying on stable isotope-labeled compounds for metabolism, bioavailability, and biomarker studies. Outsourcing momentum lifts contract research and manufacturing organizations, which post an 8.04% CAGR as sponsors divest in-house labeling functions. ISO 17034 facilities in China and India now attract routine projects for high-volume compounds, while proprietary molecules and export-controlled isotopes stay within sponsor walls.
Academic and research institutes remain early adopters of novel labeling strategies, although constrained budgets limit volume. Hospitals and diagnostic centers purchase smaller batches but benefit from expanded assay menus reimbursed by insurance payers.
Geography Analysis
North America held 43.38% share of 2025 revenue, anchored by pharmaceutical headquarters, leading mass-spectrometry instrument vendors, and clear regulatory frameworks. The Oak Ridge National Laboratory facility, commissioned in 2025, restored domestic enrichment capabilities for carbon-13, nitrogen-15, and oxygen-18, thereby reducing exposure to Russian and Chinese suppliers. Canada’s National Research Council supplies regional demand, while Mexico adopts isotope-dilution for bioequivalence trials mandated by COFEPRIS. Although sponsors are increasingly outsourcing synthesis to Asia, North America remains the epicenter for method development and standards setting.
Asia-Pacific is projected to grow at a 6.04% CAGR through 2031. WuXi AppTec and other regional CROs expanded isotope-synthesis suites in 2024 and 2025, capturing demand from cost-sensitive sponsors. Japan’s Taiyo Nippon Sanso operates the world’s largest commercial oxygen-18 facility and is evaluating capacity expansions to alleviate chronic shortages. India harmonizes its bioequivalence guidelines with those of the International Council for Harmonisation, stimulating domestic purchases. Export-control approvals remain a bottleneck, but incremental licensing reforms in South Korea and Australia could reduce friction by 2027.
Europe maintained a mid-20s percentage share in 2025, with Germany, the United Kingdom, and France leading the way in consumption. Urenco Stable Isotopes supplies nitrogen-15 from its Dutch plant, feeding proteomics laboratories across the continent. The European Medicines Agency updated bioanalytical guidelines in 2024, aligning with FDA standards and facilitating cross-jurisdiction submissions. The Middle East and Africa, as well as South America, remain smaller markets; however, Gulf Cooperation Council nations invest in mass-spectrometry diagnostics, and Brazilian pharmaceutical hubs apply isotope dilution to meet export market quality requirements.

Competitive Landscape
The stable isotope labeled compounds market features moderate concentration. The top five suppliers, Cambridge Isotope Laboratories, Merck KGaA, Thermo Fisher Scientific, Urenco Stable Isotopes, and Toronto Research Chemicals, account for a significant share of the global revenue. Barriers to entry include capital costs exceeding USD 50 million for enrichment infrastructure and stringent export-control licensing requirements. Smaller firms, such as Alsachim, IsoSciences, and Omicron Biochemicals, differentiate themselves through custom synthesis and technical support rather than price competition.
Cambridge Isotope Laboratories’ North Star carbon-13 line, commissioned in October 2024, doubled capacity and reduced dependence on Russian and Chinese feedstock. Suppliers are racing to patent electro-enzymatic deuteration, a technology that reduces solvent waste and energy use, aligning with pharmaceutical sustainability goals. Oxygen-18 scarcity offers pricing power to producers with distillation columns, while fermentation-based labeling of complex biologics remains a white-space opportunity. Acquisition activity is likely as incumbents seek feedstock security and product-portfolio breadth, a pattern echoed by Merck KGaA’s historical purchases of niche isotope firms.
Stable Isotope Labeled Compounds Industry Leaders
PerkinElmer Inc
Merck KGaA
Cambridge Isotope Laboratories, Inc.
Medical Isotopes, Inc.
Rosatom
- *Disclaimer: Major Players sorted in no particular order

Recent Industry Developments
- June 2025: Thermo Fisher Scientific launched Orbitrap Astral Zoom and Orbitrap Excedion Pro mass spectrometers, delivering 35% faster scan rates for stable isotope studies.
- June 2025: RayzeBio, a Bristol Myers Squibb unit, licensed OncoACP3 from Philochem for USD 350 million upfront to advance ¹⁷⁷Lu and ²²⁵Ac radiopharmaceutical candidates.
- June 2025: ASP Isotopes raised USD 50 million via a 7.5-million-share offering at USD 6.65 to fund high-assay low-enriched uranium and specialty-isotope ventures.
- September 2024: Cambridge Isotope Laboratories commissioned its North Star carbon-13 production facility in Massachusetts, doubling the company's annual enrichment capacity and reducing dependence on overseas feedstock. The facility employs cryogenic distillation to achieve 99% isotopic purity and is expected to serve pharmaceutical sponsors conducting micro-dosing studies and proteomics laboratories requiring uniformly labeled amino acids


Research Methodology Framework and Report Scope
Market Definitions and Key Coverage
Our study defines the stable isotope-labeled compounds market as the sale of chemical reagents in which at least one atom is replaced by a non-radioactive tracer isotope, most commonly 2H, 13C, 15N, or 18O, to enable quantitative tracking in analytical, diagnostic, and life-science workflows. Values capture bulk and custom molecules supplied in solid or liquid form to laboratories, manufacturers, and testing facilities worldwide.
We exclude radioactive isotopes, bulk unlabeled isotope gases, and standalone labeling services that are not accompanied by compound delivery.
Segmentation Overview
- By Isotope Type
- Deuterium
- Carbon-13
- Nitrogen-15
- Oxygen-18
- Others
- By Compound Category
- Amino Acids & Peptides
- Metabolites & Lipids
- Active Pharmaceutical Ingredients
- Nucleic Acids
- Solvents & Reagents
- By Synthesis Method
- Chemical Synthesis
- Fermentation & Metabolic Labelling
- Enzymatic / Exchange
- By Application
- Research (Proteomics, Metabolomics, Flux Analysis)
- Clinical Diagnostics
- Industrial & Environmental Testing
- Other Applications
- By End-User
- Pharmaceutical & Biotechnology Companies
- Academic & Research Institutes
- Hospitals & Diagnostic Centers
- Contract Research & Manufacturing Organisations
- By Geography
- North America
- United States
- Canada
- Mexico
- Europe
- Germany
- United Kingdom
- France
- Italy
- Spain
- Rest of Europe
- Asia-Pacific
- China
- Japan
- India
- Australia
- South Korea
- Rest of Asia-Pacific
- Middle East & Africa
- GCC
- South Africa
- Rest of Middle East & Africa
- South America
- Brazil
- Argentina
- Rest of South America
- North America
Detailed Research Methodology and Data Validation
Primary Research
Our analysts interviewed procurement leads at pharmaceutical and biotech firms, isotope-production engineers, and core-facility managers in North America, Europe, and Asia. These discussions helped us test price-volume assumptions, understand lead-time differentials, and verify emerging diagnostic use cases that secondary data alone could not uncover.
Desk Research
We began by mining open datasets from the U.S. DOE Isotope Program, Eurostat trade codes for isotope-enriched chemicals, and International Atomic Energy Agency production statistics, which together framed global supply ceilings. Grant spending trends from NIH RePORTER, annual FDA IND filings that cite 13C micro-dosing, and PubMed-indexed metabolomics papers revealed demand intensity by region and application. Company 10-Ks, investor decks, and laboratory press releases added price-change and capacity-expansion context. Paid resources such as D&B Hoovers for company revenues and Questel patent analytics clarified competitive positioning and innovation hot spots. The sources named are illustrative; many additional documents informed data collection and validation.
Market-Sizing & Forecasting
We anchor the model with a top-down demand-pool build that links research funding, diagnostic test volumes, and isotope-production output. Supplier roll-ups and sampled ASP x kilogram shipments provide bottom-up checks that refine totals. Key variables include installed high-resolution mass-spectrometer counts, average labeled amino-acid prices, 13C-API clinical-trial numbers, and enrichment-yield trends. A multivariate regression ties these drivers to annual spend, while scenario analysis adjusts for funding shocks or facility outages.
Data Validation & Update Cycle
Our team cross-checks modeled totals against trade data, shipment disclosures, and vendor commentaries, flagging variances above seven percent for re-work. Senior reviewers audit formulas before sign-off. Reports refresh annually, with interim updates triggered by material events so clients always receive the latest view.
Why Mordor's Stable Isotope Labeled Compounds Baseline Stands Reliably Apart
We acknowledge that published market estimates often diverge, and we see gaps arise from scope drift, aging price decks, or limited regional coverage. Mordor's disciplined scope, yearly refresh, and dual-path validation minimize such distortions.
Key gap drivers include some publishers bundling radioactive isotopes, others omitting Asia-Pacific CRO demand, and still others relying on five-year-old average selling prices, all of which inflate or deflate totals relative to our 2025 base.
Benchmark comparison
| Market Size | Anonymized source | Primary gap driver |
|---|---|---|
| USD 315.70 mn (2025) | Mordor Intelligence | - |
| USD 312 mn (2024) | Global Consultancy A | Excludes custom compounds; uses older ASPs |
| USD 291.82 mn (2023) | Trade Journal B | Omits Asia-Pacific CRO demand |
| USD 321.53 mn (2024) | Industry Think-Tank C | Bundles small-volume radioisotope reagents |
The comparison shows that once scope, pricing vintage, and regional coverage are harmonized, Mordor Intelligence delivers the most balanced, transparent baseline, one that decision-makers can trace to clear variables and repeatable steps.


Key Questions Answered in the Report
How large is the stable isotope labeled compounds market in 2026?
It reached USD 326.71 million in 2026 and is projected to climb to USD 386.28 million by 2031.
Which isotope type holds the largest share?
Deuterium compounds led with 42.11% revenue share in 2025.
What is driving demand for carbon-13 APIs?
FDA guidance in 2024 validated micro-dosing protocols that rely on carbon-13, prompting sponsors to specify labeled APIs in more investigational applications.
Why is oxygen-18 supply tight?
Global capacity is under 2,000 kilograms per year, with Taiyo Nippon Sanso operating the largest commercial column, keeping prices above USD 1,000 per gram.
Which region is growing fastest?
Asia-Pacific is forecast to post a 6.04% CAGR through 2031, powered by capacity build-outs in China, India, and South Korea.
Page last updated on:


