Market Overview
| Study Period | 2020 - 2031 |
|---|---|
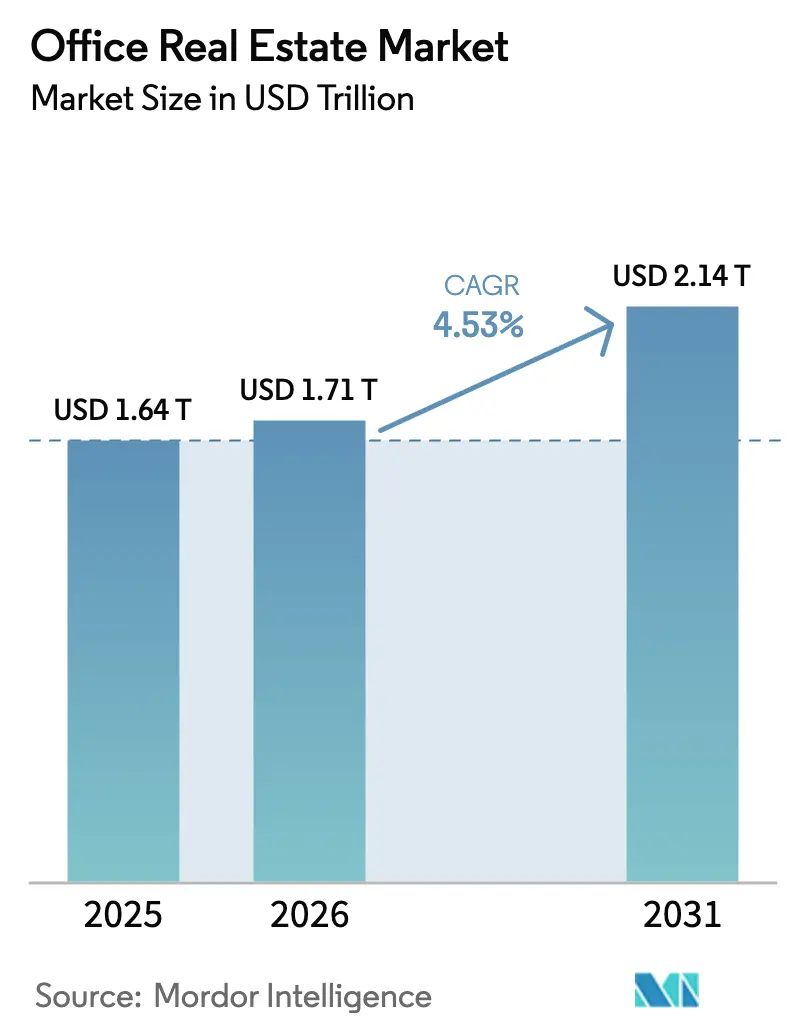
| Market Size (2026) | USD 1.71 Trillion |
| Market Size (2031) | USD 2.14 Trillion |
| Growth Rate (2026 - 2031) | 4.53% CAGR |
| Fastest Growing Market | Asia-Pacific |
| Largest Market | North America |
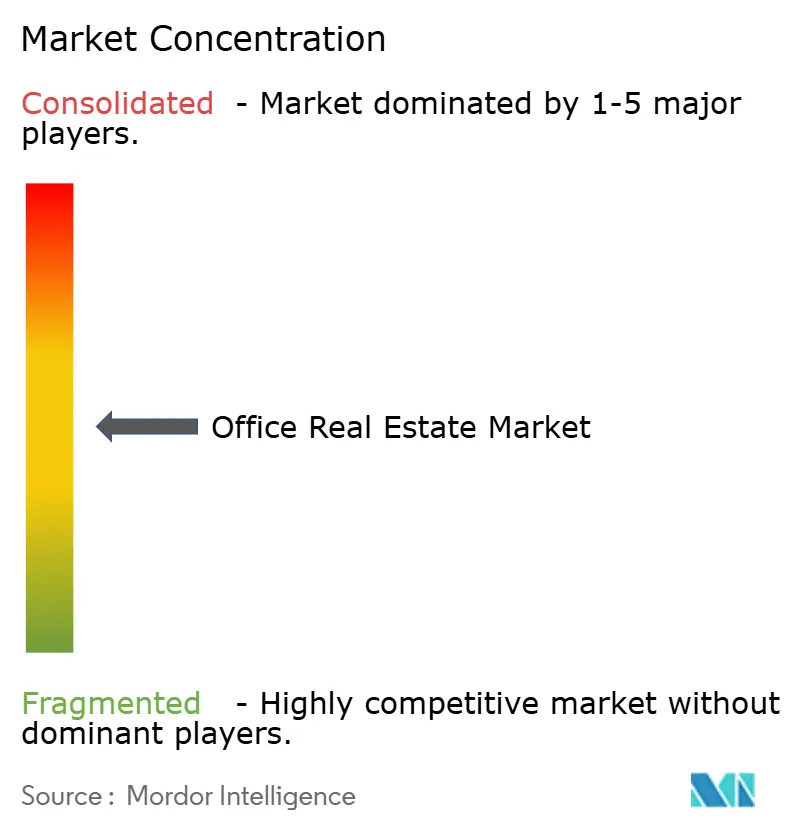
| Market Concentration | Medium |
Major Players *Disclaimer: Major Players sorted in no particular order Image © Mordor Intelligence. Reuse requires attribution under CC BY 4.0. | |
Office Real Estate Market Analysis by Mordor Intelligence
The Office Real Estate Market size is expected to increase from USD 1.64 trillion in 2025 to USD 1.71 trillion in 2026 and reach USD 2.14 trillion by 2031, growing at a CAGR of 4.53% over 2026-2031.
A widening performance gap defines today’s cycle: ESG-certified towers located in AI-centric corridors and in regions with government headquarters mandates are attracting both capital and tenants, while secondary stock faces double-digit vacancy and refinancing stress. Return-to-office rules have stabilized weekday occupancy at roughly three days per employee, yet occupiers now insist on healthier air systems, superior amenities, and green credentials that satisfy Scope-3 reporting. Institutional investors that marked down holdings in 2023 are selectively re-entering, favoring prime assets in gateway cities where LEED or BREEAM labels deliver rent premiums and regulatory headroom. A record-low construction pipeline since 2024 further tightens prime vacancy, giving landlords pricing power for the first time since 2019. At the same time, a USD 929 billion CMBS maturity wall through 2027 is pushing leveraged owners of Class B and C towers toward distressed sales rather than retrofits, deepening the bifurcation.
Key Report Takeaways
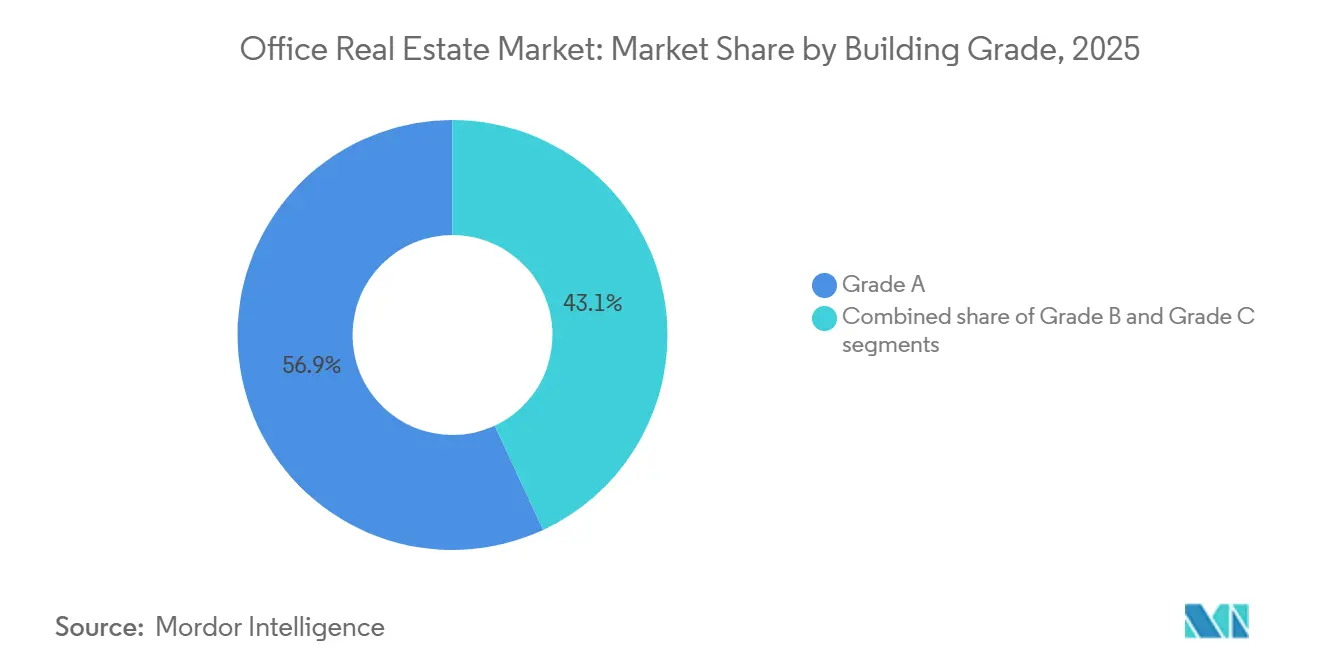
- By building grade, Grade A properties captured 56.94% of the office real estate market share in 2025 and are projected to expand at a 5.27% CAGR through 2031.
- By transaction type, rentals represented 78.64% of 2025 activity, while sales transactions are forecast to log a 5.43% CAGR through 2031.
- By end use, IT & ITES tenants accounted for 25.14% of demand in 2025 and are expected to post a 5.54% CAGR through 2031.
- By geography, North America held 26.84% of the 2025 office real estate market, whereas Asia-Pacific is projected to grow at a 5.95% CAGR through 2031.
Note: Market size and forecast figures in this report are generated using Mordor Intelligence’s proprietary estimation framework, updated with the latest available data and insights as of January 2026.
Global Office Real Estate Market Trends and Insights
Drivers Impact Analysis*
| Drivers | (~) % IMPACT ON CAGR FORECAST | Geographic Relevance | Impact Timeline |
|---|---|---|---|
| Flight-to-quality and mandated returns lift demand for ESG-prime assets | +1.2% | Global gateway cities in North America, Europe, and Asia-Pacific | Medium term (2-4 years) |
| Record-low new construction tightens prime vacancies | +0.9% | North America and core European & Asia-Pacific markets | Short term (≤ 2 years) |
| Easing rates and repricing draw institutions back to core offices | +0.8% | North America and Europe | Medium term (2-4 years) |
| AI and semiconductor corridors spur large-block leasing | +0.7% | Silicon Valley, Austin, Phoenix, Bengaluru, Shenzhen | Long term (≥ 4 years) |
| Scope-3 deadlines accelerate green retrofits | +0.6% | EU, United States, Canada | Long term (≥ 4 years) |
| GCC headquarters mandates add Middle-East trophy demand | +0.5% | Riyadh, Dubai, Abu Dhabi | Short term (≤ 2 years) |
| Source: Mordor Intelligence | |||
Flight-to-Quality and Mandated Returns Lift Demand for ESG-Prime Assets
Mandatory on-site policies at major banks and professional-services firms have steered tenants toward buildings that make commuting worthwhile. Wells of demand concentrate on towers carrying LEED v5, BREEAM v7, or WELL Health-Safety badges that now command 8-12% rent premiums over uncertified peers in New York, London, and Singapore[1]U.S. Green Building Council, “LEED v5: What You Need to Know,” usgbc.org. Landlords racing to capture this premium are investing USD 15–25 per square foot in advanced HVAC, circadian lighting, and touchless access to reduce absenteeism and reinforce brand equity. The trend aligns with corporate Scope-3 reporting rules, making green space a compliance tool rather than a perk. As a result, prime vacancy in core submarkets sits below 10%, while secondary and tertiary assets register vacancies above 20%, confirming a secular flight-to-quality split.
Record-Low New Construction Tightens Prime Vacancies
U.S. office deliveries dropped to 38 million square feet in 2024, the lowest total since 2009, because high financing costs and uncertain leasing halted groundbreaks[2]Bureau of Labor Statistics, “Producer Price Index Nonresidential Construction Q3 2024,” bls.gov. Scarce supply has pushed Class A vacancy below 8% in Manhattan’s Hudson Yards, San Francisco’s Mission Bay, and Seattle’s Denny Triangle, enabling landlords to secure rent escalations that outrun inflation. The shortage is most acute for contiguous blocks of 50,000 square feet or more, space coveted by AI developers and chip designers who require dense power and collaboration zones. Tech giants now pre-lease years in advance; Nvidia reserved a 500,000-square-foot tower in Santa Clara for 2027 occupancy. Such early commitments are feeding a virtuous cycle of higher asking rents and rising stabilized values for the limited cohort of still-pipeline prime projects.
Easing Rates and Repricing Draw Institutions Back to Core Offices
The U.S. Federal Reserve’s 2024 shift from rate hikes to policy stability compressed trophy-office cap rates by 50–75 basis points between mid-2023 and late-2024. BlackRock’s USD 7.3 billion take-private of ElmTree Funds and Rithm Capital’s USD 1.6 billion purchase of Paramount Group illustrate how dry-powder capital is targeting defensive income streams in gateway markets. Improved liquidity also supports CMBS issuance, which climbed 18% year over year to USD 12.3 billion in 2024, allowing investors to lock in cheaper debt for energy-efficient assets. At the same time, deep discounts on under-amenitized towers give opportunistic buyers room to fund upgrades; a Midtown Manhattan building that traded at a 67% discount to its 2019 value underscores the scale of repricing. These converging forces are nudging institutional allocations back toward the office bucket after a multi-year hiatus.
AI and Semiconductor Corridors Spur Large-Block Leasing
Generative-AI labs and semiconductor design hubs have become the single most active source of large-block absorption. OpenAI’s 486,600-square-foot Mission Bay lease, TSMC-linked demand in Phoenix, and Nvidia’s Santa Clara expansion all highlight a requirement for contiguous floors, redundant power, and fiber throughput above conventional specifications. Average Class A rents in Phoenix’s Tempe submarket rose 9% during 2024, mirroring similar premiums in Austin’s Domain and Bengaluru’s Outer Ring Road, as tech occupiers outbid traditional tenants for space. These firms pay for infrastructure rather than skyline views, creating a niche for owners willing to retrofit with liquid-cooled data rooms and micro-grid backup. As AI workloads grow, landlords positioned near talent pools and fabrication clusters look set to capture outsized rental growth into the 2030s.
Restraints Impact Analysis*
| Restraints | (~) % IMPACT ON CAGR FORECAST | Geographic Relevance | Impact Timeline |
|---|---|---|---|
| Structural vacancy in obsolete assets | −0.8% | Legacy submarkets in North America and Europe | Long term (≥ 4 years) |
| 2025-27 refinancing wall raises distress, caps capex | −0.6% | United States, United Kingdom, Germany | Short term (≤ 2 years) |
| Sticky construction and fit-out cost inflation | −0.4% | Global, especially U.S. and core European cities | Medium term (2-4 years) |
| AI-enabled desk-sharing cuts per-employee space | −0.3% | Tech hubs in North America and Asia-Pacific | Medium term (2-4 years) |
| Source: Mordor Intelligence | |||
Structural Vacancy in Obsolete Assets Persists
Class B and C towers lacking modern HVAC, fiber backbones, or 9-foot clear heights endure vacancy rates above 20% in multiple U.S. metros[3]NYC Comptroller, “Potential and Limitations of Office-to-Residential Conversions,” comptroller.nyc.gov. Goldman Sachs calculates that 330 million square feet, 8% of the national supply, is functionally obsolete and headed for adaptive reuse or demolition by 2030. In Europe, Savills warns that 25% of London offices will miss EPC Band B compliance, likely stranding capital and pushing tenants to greener premises. Conversion economics only work when acquisition costs fall below USD 150 per square foot, a hurdle met by fewer than 15% of listings, prolonging vacancy and hitting local tax bases. Until pricing clears or incentives emerge, obsolete stock will drag absorption and dilute the sector’s aggregate performance.
2025-27 Refinancing Wall Raises Distress and Limits Capex
Roughly USD 929 billion of CMBS office debt matures between 2025 and 2027, with 42% tied to properties showing negative cash flow. Delinquency reached 7.67% in November 2024, a post-GFC high. Borrowers face refinancing spreads 200–300 basis points wider than initial coupons, prompting defaults such as Brookfield’s USD 784 million LA towers in 2024. Cash preservation trumps capital upgrades under distress, further diluting competitiveness versus well-capitalized REITs. The resulting sale wave both weighs on near-term values and resets basis costs for opportunistic investors.
*Our forecasts treat driver/restraint impacts as directional, not additive. The impact forecasts reflect baseline growth, mix effects, and variable interactions.
Segment Analysis
By Building Grade: Prime Assets Capture Capital Flight
Grade A towers controlled 56.94% of the office real estate market share in 2025, and this cohort will compound at a 5.27% CAGR through 2031, underscoring an investor and tenant pivot toward energy-efficient, amenity-rich space. The office real estate market size for Grade A stock equated to roughly USD 975 billion in 2026, a figure that captures growing allocations from pension funds and sovereign wealth vehicles. Vacancy gaps prove decisive: Manhattan Class A was 9.8% in late 2024 versus 22.1% for Class C, while similar spreads appeared in London’s West End and Singapore’s Raffles Place.
Capital constraints accelerate divergence. Lenders offer 70% LTV on well-leased Grade A towers but cap leverage at 50% for mid-grade assets, forcing owners of older stock to defer maintenance. European directives that all buildings hit EPC Band B by 2030 compound the pressure. Investors expect a green premium; accordingly, net-zero-ready buildings transacted at cap rates 50–75 basis points firmer than non-compliant peers in 2025. Over the forecast horizon, institutional capital will continue to gravitate toward prime, compressing yields and widening value gaps across grades.


By Transaction Type: Sales Velocity Rises Amid Repricing
Rental contracts accounted for 78.64% of transactions in 2025, reflecting typical multiyear lease structures that underpin landlord cash flow. Yet sales transactions are slated to grow at a 5.43% CAGR as repricing reveals opportunity in both trophy and distressed blocks. The office real estate market size moving through sale trades reached USD 135 billion globally in 2024, a 15% rebound from the prior year as financing reopened for core assets.
Two distinct capital plays drive sales growth. Core buyers like Rithm Capital and BlackRock chase stabilized downtown icons, betting on long-duration leases and ESG alignment. Meanwhile, private equity harvests value from properties that sold at 40–70% discounts to pre-pandemic prices, a trend epitomized by the 2024 trade of 321 West 44th Street at USD 65 million. Debt markets enable both strategies; CMBS issuance climbed to USD 12.3 billion in January-September 2024 as lenders regained confidence in top-tier collateral. With repricing largely flushed through secondary stock, transaction-volume recovery looks sustainable through 2027.
By End User: Technology Tenants Lead Absorption
IT & ITES occupiers represented 25.14% of 2025 demand, while also posting the segment-best 5.54% CAGR to 2031. Silicon Valley, Austin, Phoenix, Bengaluru, and Shenzhen each logged double-digit absorption gains in 2024 on the back of AI chip design and cloud-services rollouts. These tenants need contiguous blocks for GPU clusters and collaborative R&D, making them willing to pre-lease years ahead at rent premiums. BFSI lines, though smaller in share, claw back space as leadership mandates relocate senior managers on-site five days weekly. Deloitte, Accenture, and EY likewise consolidate into fewer but higher-spec hubs that improve knowledge transfer and brand cohesion.
Hybrid motion continues to influence layouts. Many tech firms cut dedicated desks in favor of collaboration zones, yet total leased area expands as functions co-locate near fabrication plants or research universities. Life-sciences administration adds another niche: Boston’s Seaport and San Diego’s Torrey Pines register 15–25% rent premiums for lab-adjacent offices that facilitate cross-discipline teams. Over the forecast horizon, technology’s appetite for resilient, high-power space should anchor absorption, while professional services secure smaller, more flexible footprints inside prime towers.

Geography Analysis
North America held 26.84% of the 2025 office real estate market share, buoyed by prime submarkets such as Manhattan’s Hudson Yards, San Francisco’s Mission Bay, and Seattle’s Denny Triangle, each with Class A vacancy below 8% in late 2024. Canada’s Toronto and Vancouver attract U.S. technology and gaming firms that value immigration-friendly labor pools; Class A absorption in Toronto hit 1.8 million square feet during 2024. Refinancing risk clouds the region, however, as USD 929 billion of CMBS debt approaches maturity, threatening leveraged owners of mid-tier properties with forced sales that widen the quality divide.
The office real estate market in asia-pacific is poised for the fastest 5.95% CAGR through 2031, driven by resilient demand in China’s tier-1 cities, India’s Bengaluru-Mumbai corridor, and Japan’s core wards. Beijing’s CBD and Shanghai’s Lujiazui absorbed 4.2 million square feet in 2024 as foreign enterprises renewed growth plans, while India posted a record 52 million square feet of national absorption, 18 million of which landed in Bengaluru alone. Tokyo’s Grade A vacancy sank to 3.1% in Q3 2024 on the back of corporate consolidations spurred by governance reforms. Australia’s Sydney and Melbourne markets stabilize as hybrid work settles at 2.8 days on-site, with tenants prioritizing buildings sporting NABERS 5-star ratings.
The office real estate market in europe faces twin headwinds of EPC compliance and refinancing hurdles, yet prime districts retain depth. London’s City and West End vacancies eased to 12.8% in late 2024 as banking and legal tenants recommitted to new towers carrying BREEAM Outstanding labels. Germany’s Frankfurt and Munich absorb automotive-linked growth, constrained more by construction-cost inflation than demand. Paris La Défense draws occupiers relocating from inefficient Haussmann buildings, and combined Grade A absorption reached 420,000 square meters in 2024. In the Middle East, Saudi Arabia and the UAE's incentives compress prime vacancy, whereas South America’s São Paulo rebounds modestly as currency volatility eases, lowering vacancy to 14.6% in Q4 2024.


Competitive Landscape
Office real estate market competition remains moderately fragmented: the top-10 global landlords control about 18% of investable stock, leaving the balance with regional REITs, pension funds, and private owners. Strategic consolidation targets quality; Rithm Capital’s USD 1.6 billion buyout of Paramount Group and BlackRock’s USD 7.3 billion ElmTree acquisition capture stabilized downtown icons with long-dated leases. Distressed portfolios change hands at deep discounts, creating scale opportunities for capital-rich buyers who can fund energy retrofits and tenant improvements.
PropTech now underpins competitive advantage in the office real estate market. REITs and private vehicles deploy IoT sensors, predictive maintenance, and analytics platforms such as CBRE’s Adaptive Spaces and JLL’s Building Engines to lower operating costs by 12–18% and provide real-time energy dashboards that satisfy ESG reporting demands. Smaller owners harness flexible-leasing technology to compete on speed and customization, winning start-ups and project-based occupiers seeking 6–24-month terms.
Regulation favors the well-capitalized. The EU’s CSRD and potential SEC climate disclosures increase reporting complexity and retrofit spend, pressuring thinly capitalized landlords to divest non-compliant stock. Meanwhile, sovereign wealth funds and Canadian pensions allocate fresh capital to net-zero-ready towers, pushing up land values in core precincts. Investors able to combine balance-sheet heft with technology integration stand best placed to capture out-sized returns over the next cycle.
Office Real Estate Industry Leaders
CBRE
Jones Lang LaSalle IP, Inc.
Cushman & Wakefield
Colliers
Knight Frank
- *Disclaimer: Major Players sorted in no particular order

Recent Industry Developments
- September 2025: Rithm Capital closed its USD 1.6 billion purchase of Paramount Group, inheriting Class A towers in Manhattan, San Francisco, and Washington D.C. with 85% occupancy and plans to invest USD 120 million in energy retrofits
- July 2025: BlackRock agreed to buy ElmTree Funds’ USD 7.3 billion diversified real estate portfolio, aiming to lift yields by 200–300 basis points via capital upgrades
- May 2025: Saudi Arabia confirmed that 44 multinationals established regional headquarters in Riyadh, leasing 1.2 million square feet under Vision 2030 incentives
- March 2025: JPMorgan Chase mandated five-day office attendance for managing directors worldwide, reinforcing demand for premium space in New York, London, and Hong Kong


Research Methodology Framework and Report Scope
Market Definitions and Key Coverage
Our study defines the office real estate market as the total dollar value of newly built or substantially refurbished multi-tenant buildings and single-tenant offices that are offered for lease or sale across Grade A, B, and C categories. Transactions analyzed include shell-and-core disposals as well as stabilized income-producing assets that change hands during the base year.
Scope exclusions include owner-occupied headquarters, co-working service revenue streams, and stand-alone property-management or brokerage fees, which lie outside our market boundary.
Segmentation Overview
- By Building Grade
- Grade A
- Grade B
- Grade C
- By Transaction Type
- Rental
- Sales
- By End User
- Information Technology (IT & ITES)
- BFSI (Banking, Financial Services and Insurance)
- Business Consulting & Professional Services
- Other Services (Retail, Lifescience, Energy, Legal)
- By Geography
- North America
- United States
- Canada
- Mexico
- South America
- Brazil
- Argentina
- Chile
- Rest of South America
- Europe
- United Kingdom
- Germany
- France
- Italy
- Spain
- Netherlands
- Rest of Europe
- Middle East and Africa
- Saudi Arabia
- United Arab Emirates
- South Africa
- Nigeria
- Rest of Middle East and Africa
- Asia-Pacific
- China
- India
- Japan
- South Korea
- Australia
- Indonesia
- Rest of Asia-Pacific
- North America
Detailed Research Methodology and Data Validation
Primary Research
Mordor analysts interviewed developers, institutional investors, corporate occupiers, and regional planners across North America, Europe, Asia-Pacific, and the Gulf. These conversations validated rent trajectories, pre-commitment ratios, and construction lead times, letting us fine-tune assumptions that pure desk work could not fully surface.
Desk Research
We began with public datasets from bodies such as the World Bank, the International Monetary Fund, and UN-DESA to anchor macro indicators that steer workplace demand. Industry-specific feeds, including MSCI Real Assets transaction logs, U.S. Census building permits, and Eurostat construction output, offered construction and investment signals. Trade associations such as NAIOP and the Royal Institution of Chartered Surveyors supplied vacancy, absorption, and cap-rate benchmarks, which our team cross-checked through Dow Jones Factiva and D&B Hoovers filings to capture developer pipelines and REIT deal flows. These sources are illustrative, not exhaustive; many additional open and proprietary references informed our desk work.
Market-Sizing & Forecasting
A top-down build paired national construction-spend series with average prime office cost per square foot, then adjusted for vacancy and pre-leasing to arrive at occupied value. Selective bottom-up tests, such as Grade A supplier roll-ups and sampled average selling price times volume checks, helped temper over- or under-shoots. Key variables include new gross leasable area completions, net absorption, average prime rent, GDP per capita growth, white-collar employment, and cap-rate shifts. A multivariate regression forecast projects each driver through 2030 and feeds a scenario matrix that covers muted, base, and expansion outlooks.
Data Validation & Update Cycle
Outputs pass a three-layer review: automated anomaly flags, peer review by a second analyst, and a senior sign-off. We revisit models annually or sooner if interest rate shocks, major policy moves, or mergers shift fundamentals, ensuring clients receive the freshest view.
Why Mordor's Office Real Estate Baseline Earns Investor Trust
Published numbers often diverge because providers pick different asset pools, pricing conventions, and refresh points.
Our disciplined scoping and yearly recalibration minimize such noise, so decision-makers can benchmark confidently.
Benchmark comparison
| Market Size | Anonymized source | Primary gap driver |
|---|---|---|
| USD 1.64 trillion (2025) | Mordor Intelligence | - |
| USD 2.10 trillion (2025) | Global Consultancy A | Counts flexible-workspace service revenue as real estate value, inflating totals |
| USD 2.50 trillion (2024) | Industry Data Firm B | Adds land-bank purchases and tenant fit-out spend, but omits resale activity |
| USD 3.40 trillion (2024) | Data Analytics Provider C | Focuses only on professionally managed assets, excluding owner-occupied stock |
Taken together, the comparison shows that Mordor's base year rests on a transparent scope, balanced inputs, and repeatable steps, giving stakeholders a dependable point of departure for strategy.


Key Questions Answered in the Report
How large is the office real estate market in 2026?
The office real estate market size is USD 1.71 trillion in 2026 and is expected to grow at a 4.53% CAGR to 2031.
Which region will expand fastest through 2031?
Asia-Pacific is projected to grow at a 5.95% CAGR, driven by strong absorption in China, India, and Japan.
Why are Grade A towers outperforming other building grades?
Tenants and investors favor ESG-certified, amenity-rich space, giving Grade A assets rent premiums and easier financing.
What is fueling recent office property sales?
Repricing of distressed assets and calmer interest rates have reopened capital markets, attracting institutional and opportunistic buyers.
How does hybrid work influence future space demand?
Desk-sharing supported by occupancy sensors cuts space per employee, but high-growth sectors like AI often offset reductions by leasing collaborative, high-power floors in prime buildings.
Page last updated on:


