Shared Office Spaces Market Size and Share
Market Overview
| Study Period | 2020 - 2031 |
|---|---|
| Market Size (2026) | USD 65.22 Billion |
| Market Size (2031) | USD 112.83 Billion |
| Growth Rate (2026 - 2031) | 11.59% CAGR |
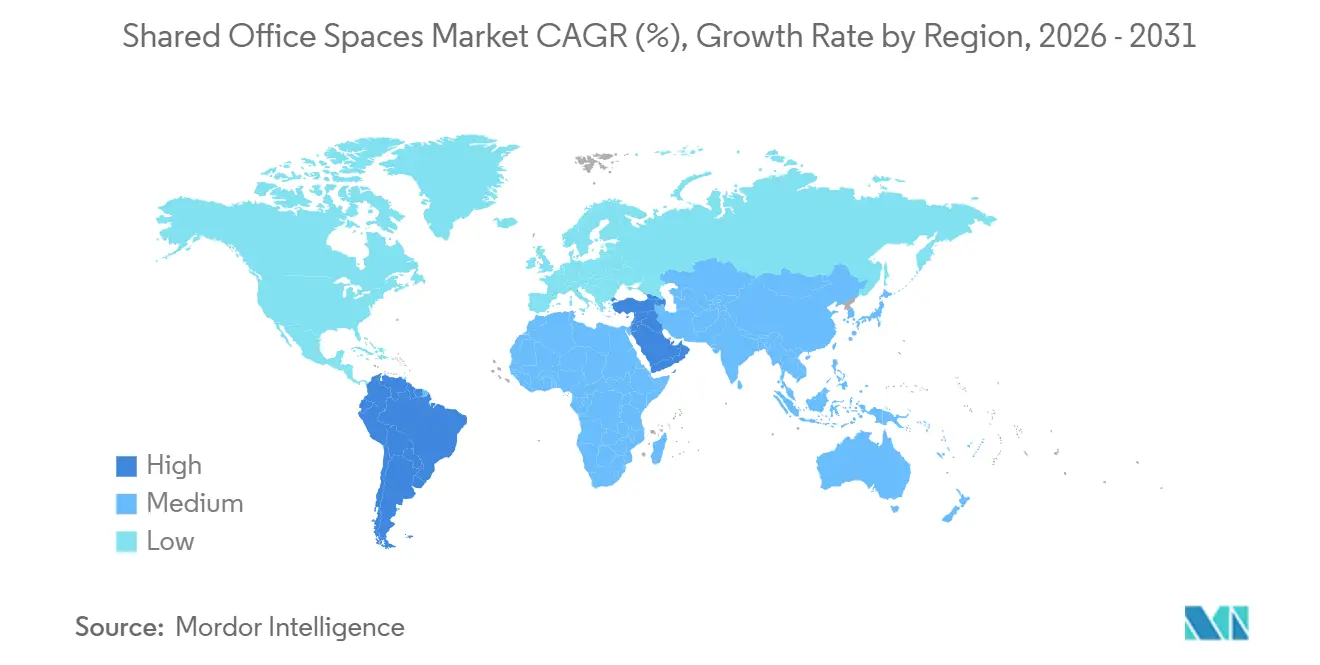
| Fastest Growing Market | South America |
| Largest Market | Asia Pacific |
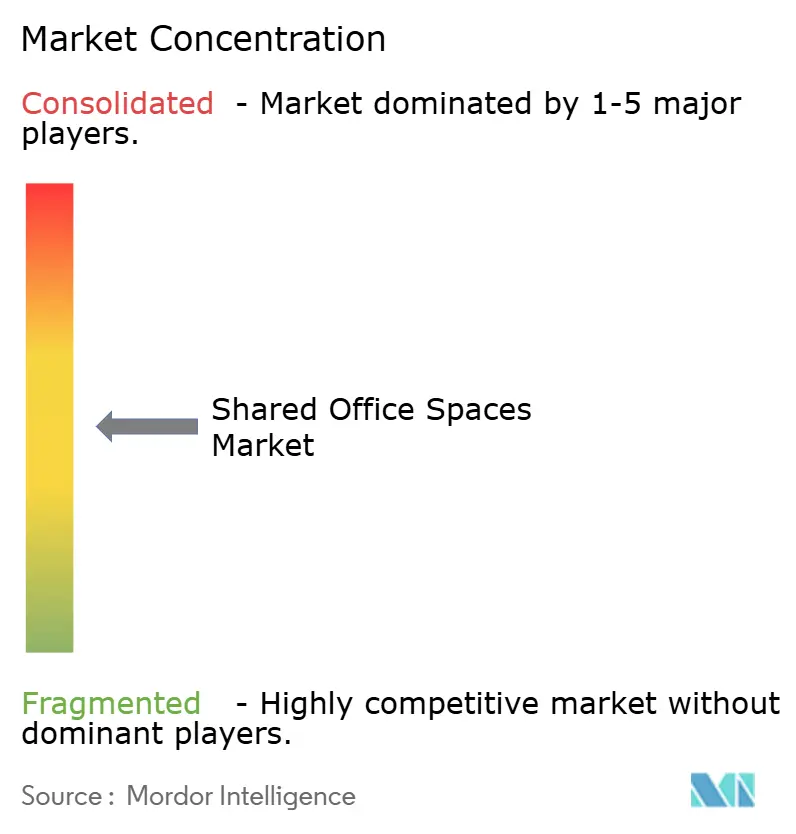
| Market Concentration | Medium |
Major Players *Disclaimer: Major Players sorted in no particular order Image © Mordor Intelligence. Reuse requires attribution under CC BY 4.0. | |
Shared Office Spaces Market Analysis by Mordor Intelligence
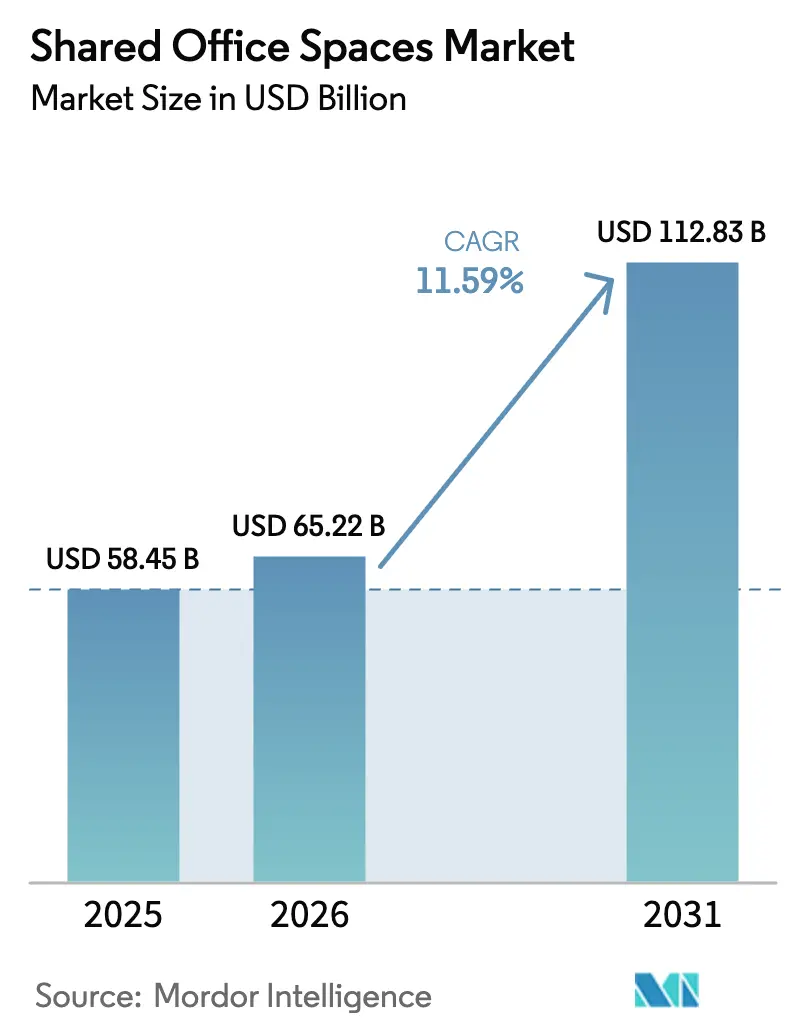
The Shared Office Spaces Market size is projected to expand from USD 58.45 billion in 2025 and USD 65.22 billion in 2026 to USD 112.83 billion by 2031, registering a CAGR of 11.59% between 2026 to 2031.
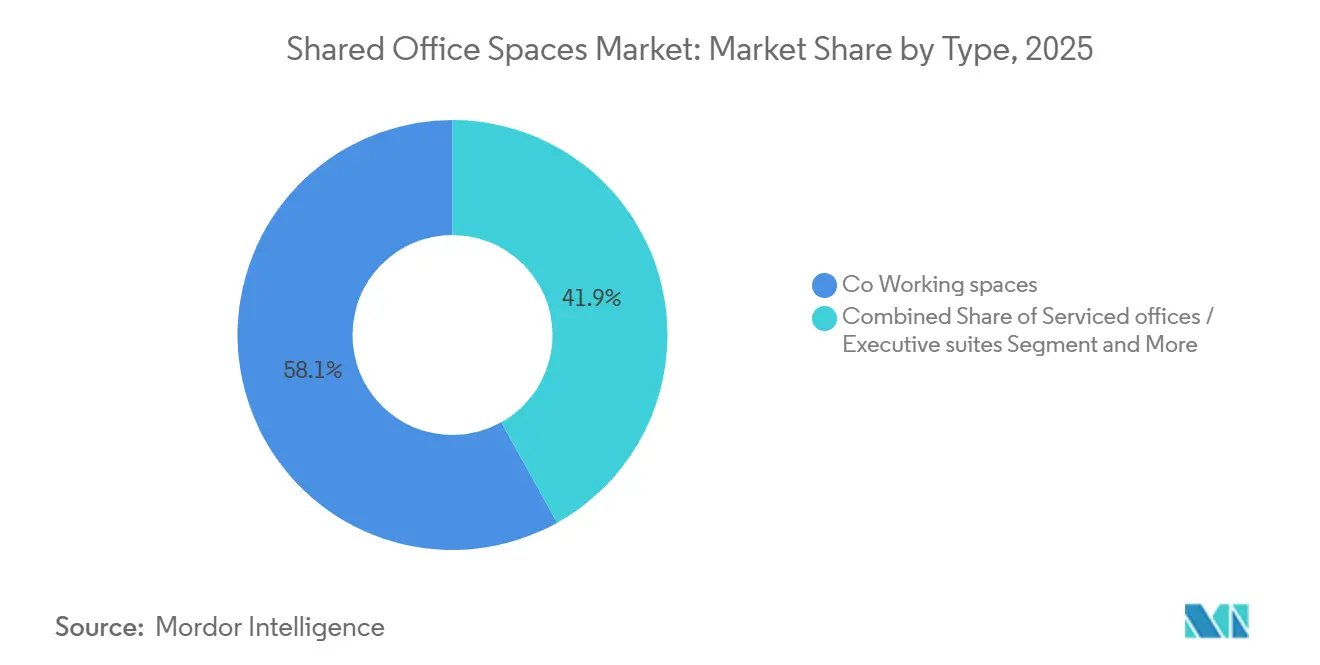
Corporate real-estate strategy is shifting toward capital-light, distributed footprints that align occupancy costs with volatile headcounts, pushing landlords and enterprises to favor turnkey flex centers over fixed long-term leases. Co-working spaces held 58.1% of 2025 revenue, but the virtual and hybrid “Others” segment is expanding fastest as clients package digital addresses and on-demand meeting rooms with limited desk use. Information Technology and IT-enabled Services controlled 35.6% of demand in 2025; however, life sciences, energy, and legal teams are adopting flex models for episodic projects, driving double-digit growth. Asia-Pacific contributed 36.9% of revenue, led by India’s march to 105 million sq ft of stock by 2026 and China’s operator consolidation after sub-lease rule changes. Meanwhile, South America is the high-growth geography, buoyed by WeWork’s 49.9% stake in WeWork Brasil that anchors expansion in São Paulo’s startup belt.
Key Report Takeaways
- By type, co-working spaces led with a 58.1% revenue share in 2025; the Others segment is forecast to expand at a 12.11% CAGR to 2031.
- By sector, Information Technology and IT-enabled Services held 35.6% of 2025 revenue; Other Services are projected to grow at a 12.41% CAGR through 2031.
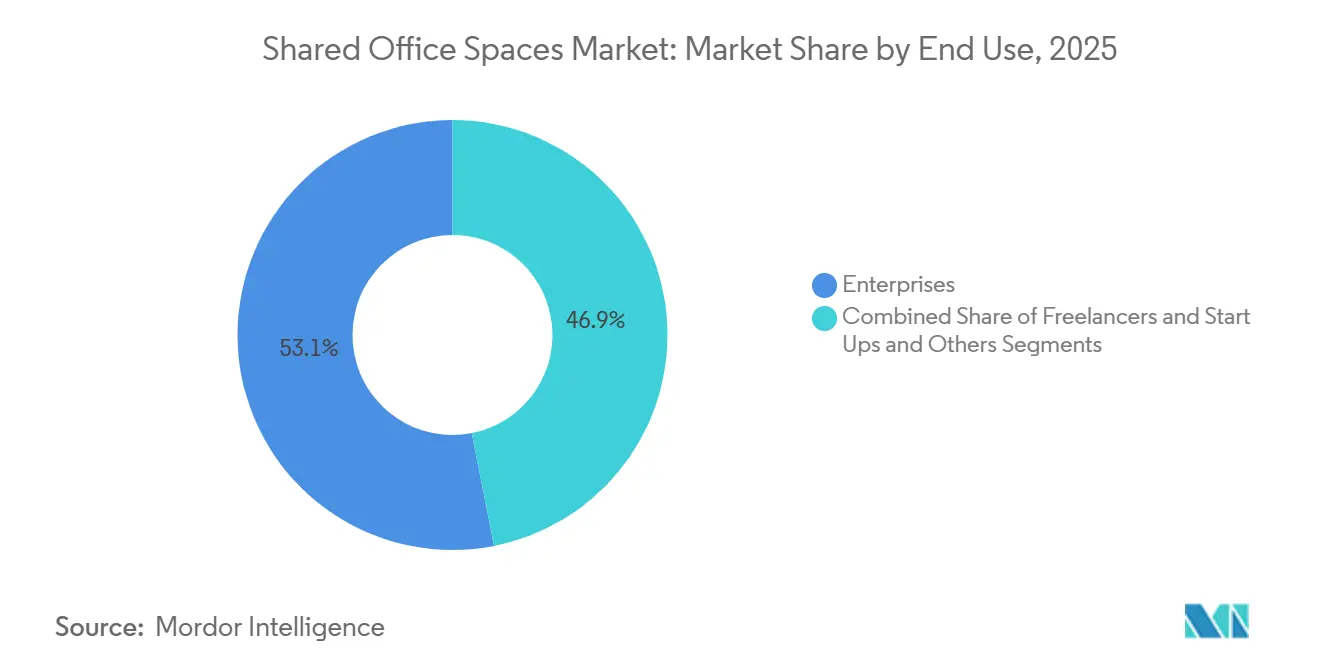
- By end use, enterprises accounted for 53.1% of 2025 demand; start-ups and freelancers are set to advance at a 12.78% CAGR by 2031.
- By region, Asia-Pacific captured 36.9% of 2025 sales; South America is expected to register a 12.98% CAGR over 2026-2031.
Note: Market size and forecast figures in this report are generated using Mordor Intelligence’s proprietary estimation framework, updated with the latest available data and insights as of 2026.
Global Shared Office Spaces Market Trends and Insights
Drivers Impact Analysis*
| Drivers | (~) % IMPACT ON CAGR FORECAST | Geographic Relevance | Impact Timeline |
|---|---|---|---|
| Hybrid work normalization is increasing demand for flexible desks and short-term offices | +3.2% | Global, concentrated in North America, Europe, APAC | Medium term (2-4 years) |
| Enterprise adoption of managed flexible space replacing long-term lease commitments | +2.8% | North America, Europe, APAC hubs | Long term (≥ 4 years) |
| Startup and SME growth preferring plug-and-play offices with low upfront capex | +2.1% | APAC, South America, Middle East | Medium term (2-4 years) |
| Landlords partnering with operators to monetize vacant floors through flex conversion | +1.9% | North America, the UK, Germany, and France | Short term (≤ 2 years) |
| Demand for distributed hub-and-spoke networks supporting multi-city access for teams | +1.6% | Global multinationals | Long term (≥ 4 years) |
| Source: Mordor Intelligence | |||
Hybrid Work Normalization Increasing Demand for Flexible Desks and Short-Term Offices
Hybrid attendance has stabilized at two-to-three days a week, so firms are right-sizing footprints and shifting to memberships that flex monthly without renegotiating leases. Operators have launched tiered passes ranging from hot desks to dedicated suites, converting real estate from fixed to variable costs. Facility-management studies indicate hybrid strategies cut per-employee space needs by up to 50%[1]International Facility Management Association, “Hybrid Work and Space Utilization 2025,” ifma.org. Landlords, therefore, view flex centers as a buffer against vacancy risk and a way to capture premium rents for turnkey convenience. As a result, demand momentum is distributed across major urban cores where hybrid policies have become the norm.
Enterprise Adoption of Managed Flexible Space Replacing Long-Term Lease Commitments
Corporations increasingly outsource office operations, preferring 90-day notice periods over multi-year obligations. CBRE’s USD 400 million acquisition of Industrious in January 2025 shows landlords moving upstream to secure management fees and steady occupancy on owned portfolios. Financial services and consulting firms are front-runners, deploying flex suites for project teams and integration task forces. Managed agreements bundle furniture, connectivity, reception, and hospitality into a single monthly line item, supporting cost predictability. Multinationals piloting regional hubs in Asia and Europe cite the ability to expand or exit quickly as decisive.
Startup and SME Growth Preferring Plug-and-Play Offices with Low Upfront Capex
Early-stage firms conserve capital by choosing co-working suites that slash fit-out timelines to under two weeks. Indian operators Awfis and Smartworks have filed for IPOs expected to raise a combined USD 1.08 billion in 2026 to fuel stock beyond Tier-1 cities[2]Awfis Space Solutions, “IPO Filing Draft Prospectus 2024,” awfis.com . Plug-and-play space removes the need for hefty deposits that traditional landlords demand, making flexible centers a gateway to formal corporate addresses for thousands of young companies. Added community events, mentorship, and investor pitch days, embedding these tenets, elevating retention even when venture funding cycles soften.
Landlords Partnering with Operators to Monetize Vacant Floors Through Flex Conversion
Building owners burdened with elevated vacancy are dedicating 10-20% of leasable area to coworking. IWG’s February 2026 purchase of Design Offices, adding roughly 50 German sites, exemplifies capital-light collaborations where landlords shoulder build-out costs in exchange for revenue sharing. Such deals stabilize occupancy, diversify rent rolls, and attract smaller tenants who value proximity to shared amenities. Owners also hedge default risk because cash flow stems from hundreds of short-term members instead of a single lessee, protecting income during downturns.
Restraints Impact Analysis*
| Restraints | (~) % IMPACT ON CAGR FORECAST | Geographic Relevance | Impact Timeline |
|---|---|---|---|
| High fit-out and operating costs are pressuring profitability at lower occupancy levels | -1.8% | Global, high-cost CBDs | Short term (≤ 2 years) |
| Demand sensitivity to economic slowdowns, reducing desk utilization, and renewals | -1.3% | Global, cyclical sectors | Medium term (2-4 years) |
| Intense competition and price discounting in major CBD and secondary micro markets | -0.9% | Global, oversupplied metros | Short term (≤ 2 years) |
| Source: Mordor Intelligence | |||
High Fit-Out and Operating Costs Pressuring Profitability at Lower Occupancy Levels
Operators invest USD 50–150 per square foot to deliver turnkey interiors, pushing breakeven thresholds to 70-80% occupancy. WeWork’s 2023 bankruptcy highlighted the fragility of master-lease models when utilization dips under that bar. Premium CBD rents amplify margin stress, while cleaning, energy, and hospitality can add 30% to overhead. IWG counters through a 95% franchise or management-agreement portfolio that shifts build-out spend to landlords but also caps upside in constrained markets. Many players are turning to IoT sensors and dynamic pricing to optimize desk yield and hold margins.
Demand Sensitivity to Economic Slowdowns: Reducing Desk Utilization and Renewals
Short-term leases magnify churn when funding tightens or hiring freezes. Singapore’s 2024 flexible-space take-up slumped to 45,000 sq ft, a five-year low, as banking stresses led multinationals to pause real estate moves[3]JTC Corporation, “Singapore Flexible Workspace Market 2024,” jtc.gov.sg . Operators often cut desk rates 15-20% to shore up occupancy, eroding revenue per seat even while rent obligations remain. Venture-backed tenants are particularly volatile, with downsizing waves mirroring capital-market cycles. To cushion swings, operators are diversifying clientele and launching longer commitment tiers that trade discounts for term security.
*Our forecasts treat driver/restraint impacts as directional, not additive. The impact forecasts reflect baseline growth, mix effects, and variable interactions.
Segment Analysis
By Type: Virtual-Hybrid Models Gain Momentum
The co-working format dominated 2025 with 58.1% of the shared office spaces market share, driven by freelancers and small teams seeking community and collaboration. Yet the “Others” bucket hybrid passes, and virtual offices will pace the field at 12.11% CAGR to 2031, reflecting demand for business addresses, mail handling, and occasional meeting rooms without permanent desks. This structure lets users trim costs by up to 70% compared with conventional leases while retaining a professional presence. Operators such as Yardi, which acquired booking platforms Deskpass and Hubble in January 2025, are building marketplaces that route mobile workers to available rooms in real time.
Hybrid solutions sit at the intersection of digital identity and on-demand space. Regulatory acceptance of virtual addresses is uneven, coaxing providers to bundle compliance support for multinational clients managing cross-border registrations. Serviced offices remain a premium niche for law firms and advisers needing confidentiality, often layering biometric access, soundproof suites, and encrypted Wi-Fi that comply with ISO 41001 facility-management standards. As landlords add amenity-rich floors, traditional co-working margins are under pressure, steering operators toward tech-enabled differentiation and broader service menus.


By Sector: Diversification Beyond IT Services
Information Technology and IT-enabled Services own 35.6% of current revenue, yet Other Services, life sciences, energy, legal, and retail will compound at 12.41% through 2031, narrowing the gap. Biotech startups, for instance, rent lab-ready coworking that avoids USD 1 million-plus capital outlays for ventilation, cold storage, and compliance fittings. Energy companies deploy mobile project offices near wind-farm builds or drilling campaigns, relocating pods as work migrates and sidestepping stranded leases. Legal practices split back-office staff into lower-cost suburbs while retaining central-city client suites, cutting rental spend by up to 50%.
Banking, insurance, and financial trading desks also use communal spaces for deal teams and interim merger units, but tighter data-privacy regulations modulate their pace of adoption. Retail brands experiment with showroom-coworking hybrids where designers, buyers, and clients convene around sample lines. As sectors diversify, operators embed specialized infrastructure, wet labs, secure VPNs, or high-footfall event zones to attract and retain niche tenants, supporting incremental revenue streams.
By End Use: Start-Ups and Freelancers Accelerate
Enterprises supplied 53.1% of 2025 demand, yet start-ups and freelancers will clock the fastest 12.78% CAGR to 2031 as venture capitalists favor lean, flexible cost structures. Plug-and-play suites let founders move in within two weeks versus the six-to-nine-month fit-out cycle of traditional spaces. India exemplifies momentum: Awfis and Smartworks collectively target over USD 840 million via IPOs to add capacity beyond Tier-1 metros. For independents, curated networking, skills workshops, and community-building events replace the isolation of home offices, while fractional executives use day passes to maintain professional client-ready settings.
Corporate users are not standing still; many negotiate campus-within-a-building deals, reserving branded, access-controlled floors that mirror headquarters culture but sit on managed agreements. Such arrangements secure steady utilisation for operators while giving large employers room to fine-tune occupancy in line with evolving hybrid-policy ratios. The co-location of start-ups and enterprises also seeds innovation and partnership pipelines, adding intangible value that bolsters stickiness across tenant types.
Geography Analysis
Asia-Pacific commanded 36.9% of 2025 revenue, powered by India’s march toward 105 million sq ft of flex stock and China’s operator consolidation under tightened sub-lease rules. Japan’s gradual cultural pivot to hybrid work is lifting Tokyo and Osaka demand, while Australia’s Sydney and Melbourne corridors see robust take-up from professional-services and technology firms. South America is the fastest-growing pocket with a projected 12.98% CAGR; WeWork’s 49.9% stake in WeWork Brazil provides capital and brand heft to serve São Paulo’s startup scene amid currency swings. Mexico benefits from near-shoring manufacturing projects that need temporary management offices, boosting occupancy in Monterrey and Mexico City.
North America remains a heavyweight with 7,748 U.S. coworking sites recorded in Q2 2025, despite a 1% net footprint trim as unprofitable suburban centers closed. Canada’s tech clusters in Toronto and Vancouver are adding demand, and landlords are converting excess space to flex on 10-year-old towers where lease rolls are softening. Europe is shifting from early-stage growth to maturation; IWG’s February 2026 takeover of Design Offices injects 50 German locations focused on repurposing corporate campuses, while the UK leads continental uptake despite slower post-Brexit leasing. France, Spain, and Italy report steady gains as landlords weave revenue-share flex into building refreshes, aiming to combat lingering vacancy on older stock. Emerging plays in the UAE and Saudi Arabia align coworking rollouts with Vision 2030 diversification pushes, attracting foreign entrepreneurs through startup visas and subsidy programs that include discounted flex memberships.

Competitive Landscape
Competition is moderate and influenced by differing risk models. IWG operates 3,751 centers across 120 countries through a franchise and management-agreement strategy, which keeps assets off its balance sheet and enables rapid expansion. By contrast, WeWork’s legacy master-lease inventory led to its 2023 bankruptcy; the firm has since jettisoned over 100 loss-making sites and reoriented toward management deals while anchoring growth via its Brazilian joint venture. CBRE’s USD 400 million swoop on Industrious gives the brokerage heft in flex operations and a captive pipeline of landlord clients seeking turnkey offerings.
Technology is the next battleground. Yardi’s January 2025 purchase of Deskpass and Hubble folds frictionless booking marketplaces into a broader PropTech stack, threatening to disintermediate traditional operators by connecting end users directly with vacant inventory. Operators are layering IoT sensors, AI-based occupancy analytics, and app-controlled access to raise service levels and optimize desk yield. Sustainability credentials have become table stakes: LEED or WELL certifications and low-carbon fit-outs win corporate mandates driven by ESG scorecards. Meanwhile, pricing sparring is fiercest in global CBDs, where desk rates fall 15-20% to sustain occupancy as average employee attendance settles below three days a week.
White-space growth hinges on secondary cities and landlord partnerships. Players such as JustCo and Convene are moving into Kuala Lumpur, Manila, and Boston, respectively, tailoring premium hospitality and event programming to local demand. IPO-bound Indian operators are banking on Tier-2 city expansion supported by government startup hubs and 5G rollout. Market entry barriers remain low, yet brand strength, technology adoption, and landlord alliances determine survival as capital costs rise and profitability overtakes blitz-scale strategies.
Shared Office Spaces Industry Leaders
IWG plc (Regus, Spaces, Signature, HQ)
WeWork Inc.
Industrious
CBRE Group – Hana/Flex
Servcorp
- *Disclaimer: Major Players sorted in no particular order

Recent Industry Developments
- February 2026: IWG plc acquired Design Offices, adding ≈50 German locations and accelerating its capital-light European build-out.
- February 2025: WeWork Inc. bought a 49.9% stake in WeWork Brasil, deepening its presence in South America’s largest economy.
- January 2025: CBRE Group purchased Industrious for USD 400 million, integrating flex management into its brokerage platform.
- January 2025: Yardi Systems acquired Deskpass and Hubble to extend its PropTech booking ecosystem.


Global Shared Office Spaces Market Report Scope
Shared office space or coworking space is an arrangements in which workers for different companies share an office space. It allows cost savings and convenience using common infrastructures, such as equipment, utilities and receptionist and custodial services, and in some cases refreshments and parcel acceptance services. It is attractive to independent contractors, independent scientists, remote workers, digital nomads, and people who travel frequently.
The Global Shared Office Spaces Market Report is Segmented by Type (Co-Working Space, Serviced Offices/Executive Suites, Others), by Sector (IT & ITES, BFSI, Business Consulting & Professional Service, Other Services), by End Use (Freelancers, Enterprises, Start-Ups & Others), and by Geography (North America, South America, Europe, Middle East and Africa, Asia-Pacific). Market Forecasts are Provided in Terms of Value (USD).
| Co-Working Space |
| Serviced Offices / Executive Suites |
| Others (Hybrid, Virtual Office) |
| Information Technology (IT & ITES) |
| BFSI |
| Business Consulting & Professional Service |
| Other Services (Retail, Life-Sciences, Energy, Legal) |
| Freelancers |
| Enterprises |
| Start-ups & Others |
| North America | United States |
| Canada | |
| Mexico | |
| South America | Brazil |
| Rest of South America | |
| Europe | United Kingdom |
| Germany | |
| France | |
| Italy | |
| Spain | |
| Rest of Europe | |
| Middle East and Africa | Saudi Arabia |
| United Arab Emirates | |
| Rest of Middle East and Africa | |
| Asia-Pacific | China |
| India | |
| Japan | |
| South Korea | |
| Australia | |
| Indonesia | |
| Rest of Asia-Pacific |
| By Type | Co-Working Space | |
| Serviced Offices / Executive Suites | ||
| Others (Hybrid, Virtual Office) | ||
| By Sector | Information Technology (IT & ITES) | |
| BFSI | ||
| Business Consulting & Professional Service | ||
| Other Services (Retail, Life-Sciences, Energy, Legal) | ||
| By End Use | Freelancers | |
| Enterprises | ||
| Start-ups & Others | ||
| By Geography | North America | United States |
| Canada | ||
| Mexico | ||
| South America | Brazil | |
| Rest of South America | ||
| Europe | United Kingdom | |
| Germany | ||
| France | ||
| Italy | ||
| Spain | ||
| Rest of Europe | ||
| Middle East and Africa | Saudi Arabia | |
| United Arab Emirates | ||
| Rest of Middle East and Africa | ||
| Asia-Pacific | China | |
| India | ||
| Japan | ||
| South Korea | ||
| Australia | ||
| Indonesia | ||
| Rest of Asia-Pacific | ||


Key Questions Answered in the Report
What is the projected value of the shared office spaces market by 2031?
The market is forecast to reach USD 112.83 billion by 2031, expanding at an 11.59% CAGR from 2026 to 2031.
Which segment currently holds the largest revenue share?
Co-working spaces led with 58.1% of global revenue in 2025.
Which geography is expected to grow fastest through 2031?
South America, propelled by Brazil’s flex-space adoption, is projected to clock a 12.98% CAGR.
Why are enterprises shifting to managed flexible space?
Managed agreements let corporations avoid multiyear lease liabilities, outsource facility services, and scale space up or down on 90-day notice.
How are landlords responding to elevated vacancy?
Many convert 10-20% of leasable floors into coworking through revenue-share partnerships that offset fit-out costs and boost occupancy stability.
What strategic moves are reshaping competition?
Key deals include CBRE’s USD 400 million purchase of Industrious, IWG’s acquisition of Design Offices, and WeWork’s investment in its Brazilian joint venture.
Page last updated on:


