Market Overview
| Study Period | 2020 - 2031 |
|---|---|
| Forecast Data Period | 2026 - 2031 |
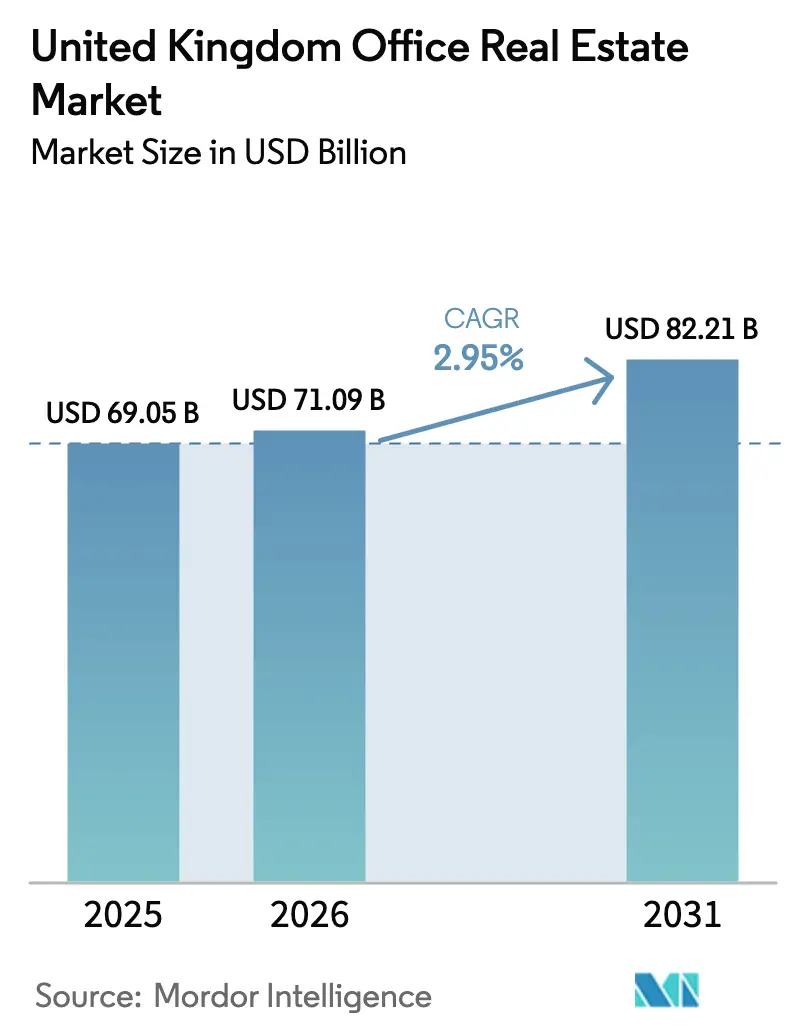
| Base Year Market Size (2025) | USD 69.05 Billion |
| Market Size (2026) | USD 71.09 Billion |
| Market Size (2031) | USD 82.21 Billion |
| Growth Rate (2026 - 2031) | 2.95% CAGR |
| Market Concentration | Medium |
Major Players *Disclaimer: Major Players sorted in no particular order Image © Mordor Intelligence. Reuse requires attribution under CC BY 4.0. | |
United Kingdom Office Real Estate Market Analysis by Mordor Intelligence
United Kingdom Office Real Estate Market size in 2026 is estimated at USD 71.09 billion, growing from 2025 value of USD 69.05 billion with 2031 projections showing USD 82.21 billion, growing at 2.95% CAGR over 2026-2031. Growth is steady rather than rapid because hybrid work has settled into a long-term pattern and tenants now focus on energy-efficient, high-specification offices. Survey work by the Office for National Statistics showed that 28% of working adults used a hybrid schedule in autumn 2024, with adoption highest among over-30s, parents and professional staff[1]Tim Vizard, “Hybrid Working in Great Britain, Autumn 2024,” Office for National Statistics, ons.gov.uk. These figures highlight the sector’s ability to expand even as economic conditions and working practices evolve.
Key Report Takeaways
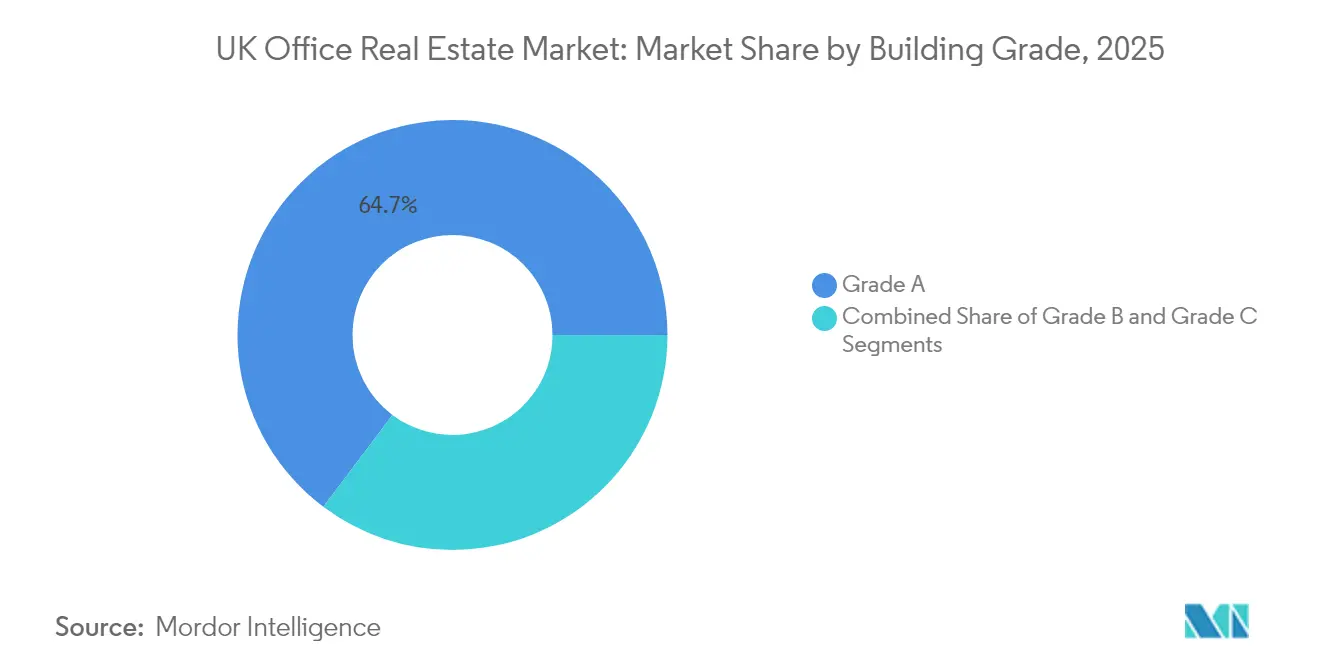
- By building grade, Grade A assets led with 64.74% of the UK office real estate market share in 2025, and this segment is forecast to post a 3.28% CAGR to 2031.
- By transaction type, rental deals accounted for 67.65% of the UK office real estate market in 2025, while sales transactions are projected to advance at a 3.45% CAGR through 2031.
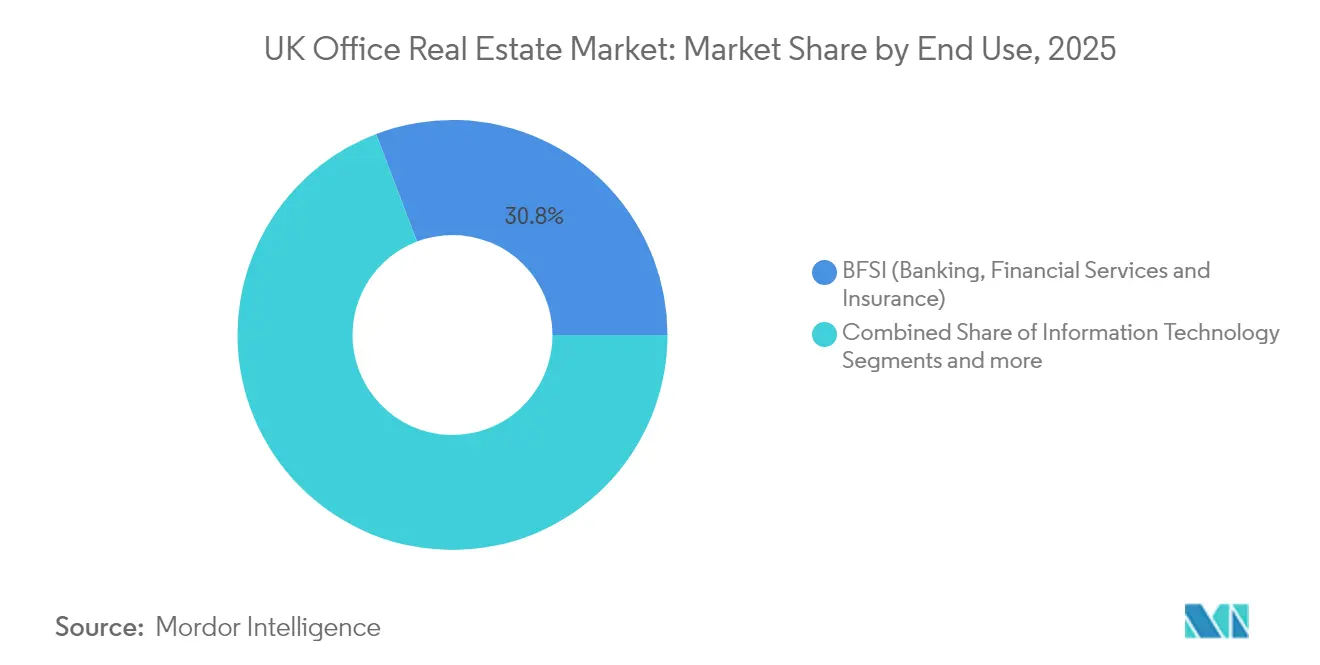
- By end use, the BFSI (Banking, Financial Services and Insurance) segment held 30.78% of the UK office real estate market in 2025; the Information Technology (IT & ITES) segment is expected to expand at a 3.83% CAGR to 2031.
- By country, England captured 80.92% of the UK office real estate market during 2025, whereas Scotland is forecast to grow the fastest at a 4.05% CAGR through 2031.
Note: Market size and forecast figures in this report are generated using Mordor Intelligence’s proprietary estimation framework, updated with the latest available data and insights as of 2026.
United Kingdom Office Real Estate Market Trends and Insights
Drivers Impact Analysis*
| Driver | (~) % Impact on CAGR Forecast | Geographic Relevance | Impact Timeline |
|---|---|---|---|
| Renewed demand for high-quality space | +0.8% | England, Scotland, Wales | Medium term (2-4 years) |
| Sustainability regulations lifting efficient stock | +0.6% | UK-wide | Long term (≥4 years) |
| Adaptive reuse adding supply | +0.4% | England, Scotland | Medium term (2-4 years) |
| Expansion of flexible workspace | +0.5% | England, Scotland, Wales | Short term (≤2 years) |
| Regional growth through government investment | +0.7% | Scotland, Wales, Northern Ireland | Long term (≥4 years) |
| Source: Mordor Intelligence | |||
Renewed Demand for High-Quality Office Space in a Hybrid Work Environment
Mandatory office days have prompted firms to pay for buildings that reward the commute. A peer-reviewed study in Nature found that hybrid arrangements cut employee turnover by one-third without hurting output, with the largest advantages for non-managers, women and staff facing long journeys. ONS data confirm the tilt toward knowledge industries, where 42% of information and communication employees and 42% of professional, scientific and technical workers now follow hybrid models. People with university degrees are 10 times more likely to work this way than those without qualifications, pushing firms to treat the office as a talent platform rather than a fixed cost. Buildings that offer strong digital infrastructure, wellness features and ESG credentials therefore command premium rents.
Sustainability Regulations Driving Demand for Energy-Efficient Buildings
Minimum Energy Efficiency Standards are splitting the market. In Q1 2025, 466,000 Energy Performance Certificates were filed in England and Wales and 84% of new properties scored an A or B rating, underscoring the pace of transition. Academic work shows that certified “green” offices lease faster and sell at higher prices than non-certified stock, with LEED buildings enjoying clear valuation gains. Research also links stronger sustainability disclosure with better operating income and higher enterprise value, encouraging owners to upgrade rather than accept “brown” discounts.
Adaptive Reuse of Commercial Spaces Supporting Office Supply Growth
Construction output in Q4 2024 rose only 0.5%, and maintenance work fell, leaving a gap that retrofit projects can fill. Academic work shows that adaptive reuse delivers lower embodied-carbon footprints than new builds while still meeting modern office needs. Government programmes such as the USD 512 million town-centre regeneration fund and USD 307.2 million housing package support these projects, while updated planning rules encourage brown-field conversion.
Expansion of Flexible Workspace Models in Emerging Markets
Hybrid work is no longer a metropolitan phenomenon. Investment-Zone funding worth USD 409.6 million for Welsh growth corridors is helping operators add capacity beyond London. Studies in organisational psychology highlight that hybrid schedules improve retention without hurting productivity, reinforcing occupier appetite for scalable solutions. Transport pledges of USD 19.97 billion are cutting journey times and letting corporations locate project teams in regional hubs [3]House of Commons Library, “Transport Connectivity Funding Commitments,” UK Parliament, hansard.parliament.uk.
Restraints Impact Analysis*
| Restraint | (~) % Impact on CAGR Forecast | Geographic Relevance | Impact Timeline |
|---|---|---|---|
| Cost pressures impacting development viability | −0.4% | England, Scotland, Wales | Short term (≤2 years) |
| Compliance challenges for aging stock | −0.3% | UK-wide | Medium term (2-4 years) |
| Weakened public-sector leasing | −0.2% | UK-wide | Medium term (2-4 years) |
| Source: Mordor Intelligence | |||
Cost Pressures Impacting Development Viability
Inflation in labour and materials joins higher financing costs to push speculative development to a 13-year low, leaving only 1.5 million square feet under construction in regional cities. Developers now require larger pre-lets to de-risk projects, and prime regional yields have risen to 6.75%. Smaller sponsors without institutional backing are ceding ground, enabling well-capitalized firms to acquire stalled schemes at discounts. Until cost curves normalise, the imbalance favours existing landlords and constrains total output.
Compliance Challenges for Aging Office Stock
With 54% of regional buildings at risk of breaching 2028 MEES thresholds, landlords must choose between retrofitting at USD 144-343 per square foot or exiting the sector. RICS surveys reveal widespread repurposing, and lower-grade buildings in secondary locations face the starkest rent erosion. The UK office real estate market is therefore polarising, intensifying competition for compliant space and pressuring owners of obsolete assets.
*Our forecasts treat driver/restraint impacts as directional, not additive. The impact forecasts reflect baseline growth, mix effects, and variable interactions.
Segment Analysis
By Building Grade: Premium Assets Command Market Leadership
Grade A offices held a commanding 64.74% of UK office real estate market share in 2025. Demand for these high-spec assets is projected to rise at a 3.28% CAGR through 2031 as firms embed hybrid work and ESG goals into portfolio strategy. Energy-certified buildings typically match or exceed conventional stock on net operating income and total return while trading at tighter cap rates. Government statistics show 84% of new English offices achieved an A or B energy rating in Q1 2025, confirming the rapid shift toward high-performance inventory.
Grade B space now faces material obsolescence risk: owners must fund mechanical upgrades or reposition assets entirely. Grade C buildings carry the heaviest burden; many require full retrofit or repurposing. A meta-review found that sustainability certifications deliver average sales premiums of 9.54% and rent premiums of 12.10%, with the office segment showing the greatest price sensitivity. As smart-building controls and wellness amenities move from novelty to baseline expectation, the gulf between premium and secondary stock will keep widening.


By Transaction Type: Rental Flexibility Dominates Market Activity
Rental transactions captured 67.65% of the UK office real estate market during 2025, underscoring tenant preference for agility amid macro uncertainty. Flexible office operators have democratized access to prime addresses through membership models, and management agreements now represent 41% of operator-landlord deals. Corporates favour short lease cycles, often three to five years, that align with evolution in headcount policies. This dynamic places pricing power in the hands of landlords with high-spec stock, who can demand premium rents without conceding long commitments.
Sales activity, while smaller, shows a projected 3.45% CAGR to 2031, outpacing rental gains, as interest-rate stability invites long-duration capital. Institutional investors deployed USD 800 million in Q1 2025, chasing yield gaps vs. continental Europe. Prime regional yields near 6.75% present compelling spreads over gilts, especially for buyers that can underwrite sustainability upgrades. Technologies such as digital twins are enhancing due diligence by enabling investors to quantify operational savings from planned retrofits, improving underwriting precision in the UK office real estate market.
By End Use: BFSI Leadership Challenged by Technology Growth
The BFSI (Banking, Financial Services and Insurance) cohort held 30.78% of 2025 demand, reflecting space-intensive trading floors and compliance functions that retain a strong in-office component. Large institutions such as Lloyds signed headline leases of 282,000 square feet, reinforcing the sector’s appetite for Grade A space. BFSI tenants typically favor landmark locations with robust transport links, ensuring continued core district relevance within the UK office real estate market.
Technology occupiers deliver the fastest trajectory at a 3.83% CAGR, fuelled by AI talent clustering and data-center adjacency needs. Leeds has emerged as a magnet, hosting more than 3,000 tech firms that leverage lower occupational costs relative to London Savills. Professional-services firms maintain steady requirements tied to advisory mandates triggered by regulatory change, while sectors such as life-sciences add episodic surges, particularly where lab-enabled office hybrids are feasible. This demand mosaic encourages landlords to design spaces with flexibility in mechanical systems, so single footprints can support multiple operational profiles over lease lifecycles.
Geography Analysis
England commanded 80.92% of 2025 activity, supported by London’s financial services cluster and headquarters density. The Bank of England cut its policy rate to 4.25% in May 2025, easing borrowing costs and supporting deal flow even as it watches inflation at 2.6%.Central and local agencies are spending USD 19.97 billion on city-region transport, a policy expected to unlock new office nodes and housing supply. Yet with construction output edging up only 0.5% in Q4 2024, vacancy rates in prime stock remain tight. Corporations are therefore adding regional back-office hubs that keep talent near London but lower total occupancy costs.
Scotland is the fastest-growing geography, set to expand at a 4.05% CAGR through 2031. Funding rounds include USD 25.6 million for Dundee Waterfront offices and refurbishments. Flexible-work uptake mirrors the broader UK pattern, and the country’s renewable-energy edge helps multinationals satisfy ESG mandates. Lower wages and rental bases relative to London further improve Scotland’s appeal for financial services and tech firms that need skilled labour.
Wales and Northern Ireland occupy smaller shares but benefit from USD 409.6 million Investment-Zone incentives and robust digital-connectivity upgrades. Hybrid policies allow firms to tap regional talent without daily London commutes, encouraging a multi-hub footprint that protects business continuity and cost efficiency.
Competitive Landscape
The UK office real estate market displays moderate concentration, the five largest advisory and brokerage houses—CBRE, JLL, Savills, Knight Frank, and Cushman & Wakefield—together control a little over 60% of transaction and management mandates. They use scale to secure Grade A leasing instructions and capital-markets deals, but must now couple those strengths with ESG and workspace-strategy services to defend their share. Each has rolled out analytics suites that track utilisation, energy intensity, and wellness metrics in near-real time.
Investment in PropTech is the main strategic theme. The majors are partnering with or acquiring start-ups that supply smart-building operating systems, occupancy sensors, and carbon-footprint dashboards. These tools let the firms deliver outcome-based contracts rather than traditional fee-for-service work, and they help landlords safeguard income as MEES deadlines loom. At the same time, regional specialists use local market knowledge and slimmer fee structures to win mid-cap instructions that the global brands can overlook.
Capital markets activity is increasingly selective. Core plus and value-add buyers focus on assets that can achieve rapid EPC uplifts and meet corporate net-zero targets. Private-equity funds have started to assemble retrofit platforms aimed at re-rating Grade B stock, while sovereign wealth vehicles concentrate on fully let, best-in-class assets. This divergence in risk appetite, combined with tightening debt costs, keeps pricing discipline high and underpins the market’s moderate concentration profile.
United Kingdom Office Real Estate Industry Leaders
CBRE
Jones Lang LaSalle IP, Inc.
Savills
Knight Frank
Cushman & Wakefield
- *Disclaimer: Major Players sorted in no particular order

Recent Industry Developments
- May 2025: Cushman & Wakefield reported that only 5.91 million square feet of Grade A London offices remain under construction and available, against Q1 2025 leasing of 2.13 million square feet across 125 deals.
- April 2025: SEGRO completed a Tritax EuroBox acquisition for USD 706.56 million, boosting its portfolio value to USD 22.78 billion.
- March 2025: Landsec disclosed annual rent of USD 392.96 million with 97.2% occupancy and plans to pivot toward residential-led developments.
- January 2025: BNY Mellon signed a 197,000 square foot lease in Manchester, the largest regional office transaction in four years.


Research Methodology Framework and Report Scope
Market Definitions and Key Coverage
Our study defines the United Kingdom office real-estate market as the total capital value of purpose-built, multi-tenant and single-tenant office buildings traded or held for income within England, Scotland, Wales, and Northern Ireland. It covers standing stock and space under construction that will secure an office use on completion.
Scope exclusion: co-working memberships, serviced office operator revenue, and mixed-use towers in which office space is a minority share are out of scope.
Segmentation Overview
- By Building Grade
- Grade A
- Grade B
- Grade C
- By Transaction Type
- Rental
- Sales
- By End Use
- Information Technology (IT & ITES)
- BFSI
- Business Consulting & Professional Services
- Other Services (Retail,Lifesciences, Energy, Legal)
- By Country
- England
- London
- Rest of England
- Scotland
- Wales
- Northern Ireland
- England
Detailed Research Methodology and Data Validation
Primary Research
Interviews with asset managers, leasing heads, facilities directors, and local planning officers across London, the South East, and the eight main regional cities help us validate achievable net initial yields, refurbishment cost inflation, and lease incentives. Short surveys with occupiers in finance, tech, and the public sector uncover space-per-employee norms that anchor our demand pool.
Desk Research
Mordor analysts begin with public datasets from the Office for National Statistics, HM Land Registry, the Valuation Office Agency, and the UK Green Building Council to size the built floorplate and track EPC migration. We enrich those baselines with transaction bulletins and rent monitors from trade bodies such as the British Property Federation, the Investment Property Forum, and the Royal Institution of Chartered Surveyors. Annual reports, 10-K filings, bond prospectuses, and REIT fact-sheets clarify ownership splits, typical cap rates, and refurbishment budgets. To cross-check vacancy and pipeline signals, we access D&B Hoovers for developer financials and Dow Jones Factiva for deal flow.
These sources illustrate our approach but are not exhaustive; dozens more feeds support data sanity checks and narrative framing.
Market-Sizing & Forecasting
A top-down stock and value model converts VOA floor area into capital value by applying city-level prime and secondary yield bands, then adjusts for vacancy, refurbishment pipeline, and grade mix. Bottom-up cross-checks sampled developer roll-ups and average rent per square foot times take-up flag outliers before totals are finalized. Key variables include hybrid attendance ratios, EPC-driven obsolescence rates, grade A refurbishment costs, Bank of England base rate paths, and regional GDP. Forecasts employ multivariate regression blended with scenario analysis; yield compression, capex cycles, and employment growth drive the regression, while scenarios test macro shocks. Gaps in the bottom-up rolls are filled by applying mean regional cap rate differentials to known sales.
Data Validation & Update Cycle
Outputs pass three-layer review: analyst, senior reviewer, and domain head. Automated variance dashboards highlight swing factors, prompting re-contact with sources when a metric shifts beyond two standard deviations. The file refreshes annually, with ad hoc updates after material policy or rate moves, ensuring clients receive a current view.
Why Mordor's United Kingdom Office Real Estate Baseline Figures Stand Taller
Published values differ because firms pick dissimilar asset baskets, yield assumptions, and update speeds.
By anchoring on verified stock counts, grade clarity, and an annual refresh cadence, we limit scope creep and stale inputs that inflate or deflate totals elsewhere.
Benchmark comparison
| Market Size | Anonymized source | Primary gap driver |
|---|---|---|
| USD 69.05 B (2025) | Mordor Intelligence | - |
| USD 148.64 B (2024) | Regional Consultancy A | Includes business parks, serviced offices, and flexible workspace revenues; applies lease multiple uplift without isolating physical stock |
| GBP 149.67 B (2025) | Global Data Firm B | Bundles retail and logistics assets under "commercial," uses GDP-linked uplift and omits grade differentiation |
These contrasts show that Mordor's narrower, transparent scope and dual-track modelling yield a dependable baseline that decision-makers can replicate and audit with limited effort.


Key Questions Answered in the Report
What is the current value of the UK office real estate market?
The UK office real estate market is valued at USD 71.09 billion in 2026, reflecting steady recovery from pandemic disruptions.
How fast will the market grow over the next five years?
The market is forecast to expand at a 2.95% CAGR between 2026 and 2031, reaching USD 82.21 billion by the end of the period.
Which building grade holds the largest market share?
Grade A offices dominated with 64.74% of the UK office real estate market share in 2025 owing to corporate flight-to-quality preferences.
Which geographic area is expected to grow the fastest?
Scotland shows the quickest outlook with a projected 4.05% CAGR, supported by over USD 2.18 billion in infrastructure commitments.
Why are flexible workspace models important for landlords?
Flexible leases meet tenant demands for agility and, by attracting a wider occupier base, help landlords keep vacancy low even when corporate space strategies fluctuate.
What is the biggest compliance challenge facing owners?
Meeting Minimum Energy Efficiency Standards by 2028 poses cost-intensive retrofit requirements that can run up to USD 343 per square foot for non-compliant buildings.
Page last updated on:


