Market Overview
| Study Period | 2020 - 2031 |
|---|---|
| Forecast Data Period | 2026 - 2031 |
| Base Year Market Size (2025) | USD 4.99 Billion |
| Market Size (2026) | USD 5.38 Billion |
| Market Size (2031) | USD 7.79 Billion |
| Growth Rate (2026 - 2031) | 7.72% CAGR |
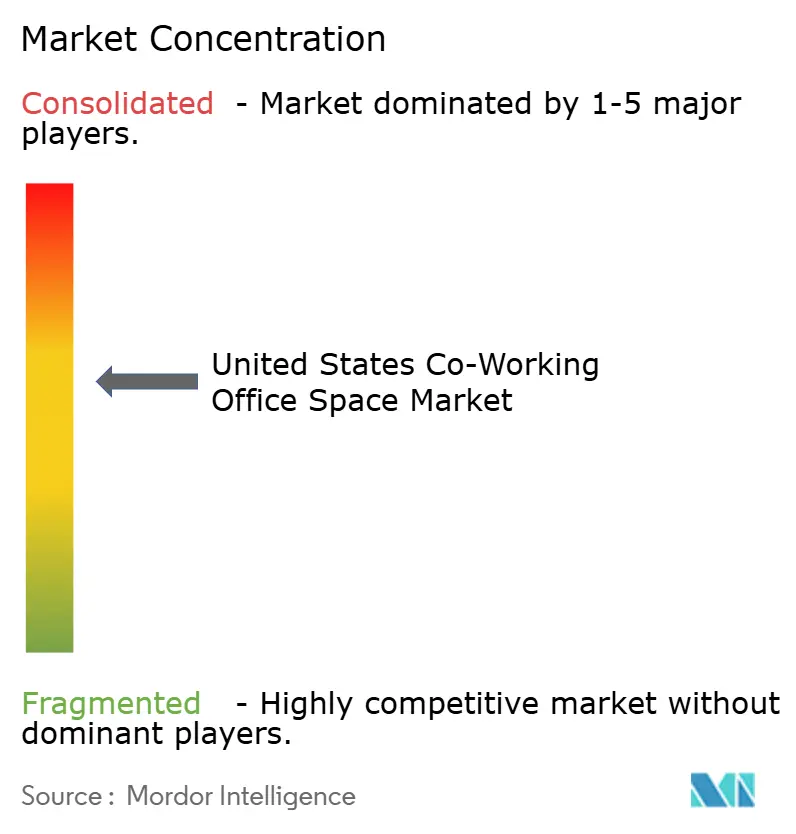
| Market Concentration | Medium |
Major Players *Disclaimer: Major Players sorted in no particular order Image © Mordor Intelligence. Reuse requires attribution under CC BY 4.0. | |

United States Coworking Office Space Market Analysis by Mordor Intelligence
The United States Coworking Office Space Market size in 2026 is estimated at USD 5.38 billion, growing from 2025 value of USD 4.99 billion with 2031 projections showing USD 7.79 billion, growing at 7.72% CAGR over 2026-2031. Sustained adoption of hybrid work strategies, portfolio-right-sizing by corporations, and the accelerated renewal of urban hubs have combined to lift demand across both primary and secondary cities. Enterprise occupiers are treating coworking offices as a core portfolio tool that enables rapid headcount swings, market testing and project-based deployments without capital expenditure commitments[1]CBRE Research Team, “2024-25 US Office Occupier Sentiment Survey,” CBRE, cbre.com. Simultaneously, technology-enabled revenue-sharing agreements with landlords have lowered entry barriers for operators, creating fertile ground for asset-light expansion. The freelancer and independent-contractor population continues to expand, intensifying out-of-cycle demand even when corporate leasing slows. Premium-grade space maintains pricing power in gateway cities, yet suburban submarkets are now registering faster net absorption as hybrid workers seek shorter commutes and employers pursue cost arbitrage.
Key Report Takeaways
- By user, enterprises led with 30.60% revenue share in 2025; start-ups and others are forecast to grow at a 8.9% CAGR to 2031.
- By office type, Grade A captured 61.30% of US coworking workspace market share in 2025, while Grade B is projected to advance at an 10.64% CAGR through 2031.
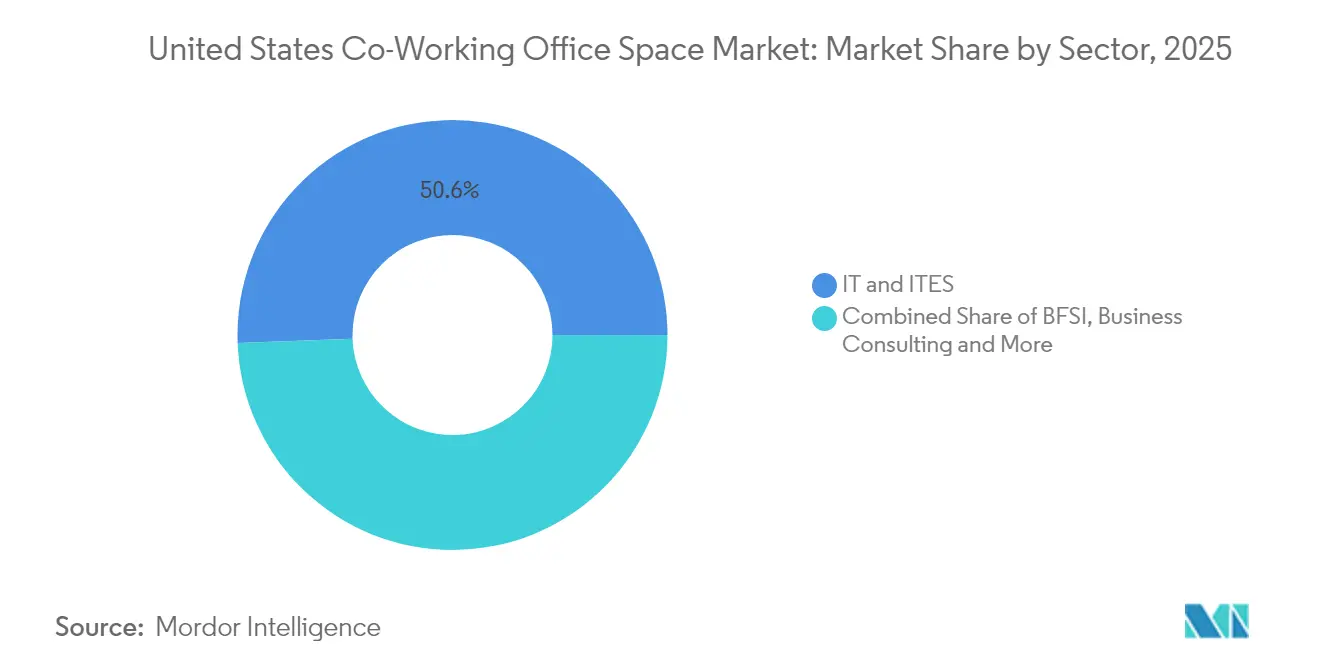
- By sector, IT/ITES commanded 50.60% share of the US coworking workspace market size in 2025; business consulting and professional services is expanding at a 9.3% CAGR to 2031.
- By region, the Northeast held 33.70% share in 2025; the South is set to post the fastest 8.95% CAGR through 2031.
- Three operators—IWG, WeWork and Industrious—collectively accounted for 41.50% share in 2025, underscoring an increasingly consolidated landscape.
Note: Market size and forecast figures in this report are generated using Mordor Intelligence’s proprietary estimation framework, updated with the latest available data and insights as of 2026.
United States Coworking Office Space Market Trends and Insights
Drivers Impact Analysis*
| Driver | (~) % Impact on CAGR Forecast | Geographic Relevance | Impact Timeline |
|---|---|---|---|
| Proliferation of hybrid & remote work models | +2.1% | Global, with concentration in major metropolitan areas | Medium term (2-4 years) |
| Surge in startup & freelancer population | +1.8% | National, with early gains in tech hubs and secondary cities | Long term (≥ 4 years) |
| Corporate drive to cut long-term lease liabilities | +1.5% | Northeast & West Coast primarily, expanding nationally | Medium term (2-4 years) |
| Suburban demand for flexible spaces | +1.2% | South & Midwest leading, national expansion | Long term (≥ 4 years) |
| Landlord-operator revenue-sharing agreements | +0.9% | National, with urban core concentration | Short term (≤ 2 years) |
| Data-driven occupancy analytics & dynamic pricing | +0.7% | Major markets initially, scaling to secondary cities | Medium term (2-4 years) |
| Source: Mordor Intelligence | |||
Suburban Demand for Coworking Spaces
As commuting patterns evolve, a widening envelope of suburban submarkets is drawing both individuals and corporates. Regus projects that decentralised coworking could generate 1.635 million jobs and USD 197 billion in annual gross value add by 2029. Operators are re-purposing retail boxes, fitness centres and municipal libraries, enabling 15-minute-city lifestyles while achieving higher margin spreads than CBD locations given lower rents and fit-out costs.
Proliferation of Hybrid & Remote Work Models
Ninety-two percent of corporate real-estate leaders surveyed in 2024 confirmed that permanent hybrid attendance policies are already in force, with the three-days-in-office rhythm emerging as the dominant pattern. Companies consequently require only around two-thirds of their pre-pandemic desk count, yet must guarantee capacity during episodic surges for client meetings, trainings or sprints, making the US coworking workspace market an attractive elasticity valve. Financial-services employers—where 98% of staff want continued remote options—have become early movers, procuring on-demand suites to sustain collaboration without locking in 10- to 15-year leases. Cushman & Wakefield notes occupancy-cost savings topping 5% when coworking replaces overflow swing space, validating the economic case [2]Cushman & Wakefield Advisory, “Cost-Savings Potential of Flex Integration,” Cushman & Wakefield, cushmanwakefield.com.
Surge in Start-Up & Independent Workforce
A rapid expansion of the independent workforce is reshaping baseline demand for agile offices. Government labour data show freelancers now represent a meaningfully larger share of total employment than before the pandemic, and the segment continues to outpace overall payroll job creation. Thousands of newly formed start-ups also rely on short-term licences to manage burn rates and to pivot quickly during product-market-fit cycles. This demographic shift lifts mid-week utilisation in many centres, especially in secondary technology corridors where venture funding has been most active. Coworking-workspace operators respond with smaller-footprint private studios, day-pass bundles and digital booking tools that match the irregular schedules common across the gig economy.
Corporate Drive to Cut Long-Term Lease Liabilities
Portfolio managers are recasting real-estate strategies to contain fixed costs while still accommodating selective growth. A 2024 CBRE pulse survey found that although 38% of large occupiers plan to add space in the next two years, 49% prefer materially shorter lease terms to avoid pandemic-era lock-in risks. Firms now mix core headquarters with subscription-based flex nodes that can be upsized or released on 30- to 90-day cycles, allowing them to test new markets, absorb project teams and manage temporary head-count spikes without capital expenditure. JLL research reports that 56% of organisations are formalising hybrid-work policies, driving the redesign of portfolios around utilisation analytics rather than head-count forecasts. The result is a structural tailwind for coworking-workspace demand because variable-term products transfer real-estate risk from the occupier’s balance sheet to the operator while preserving operational agility.
Restraints Impact Analysis*
| Restraint | (~) % Impact on CAGR Forecast | Geographic Relevance | Impact Timeline |
|---|---|---|---|
| Economic volatility impacting occupancy levels | -1.4% | National, with urban cores most vulnerable | Short term (≤ 2 years) |
| Profitability challenges & operator consolidation | -1.1% | National, affecting smaller operators disproportionately | Medium term (2-4 years) |
| Rising construction / retrofit costs for Class-A flex | -0.8% | Major metropolitan areas, particularly West Coast | Medium term (2-4 years) |
| Municipal zoning limits on adaptive conversions | -0.5% | Urban cores with restrictive zoning, notably Northeast cities | Long term (≥ 4 years) |
| Source: Mordor Intelligence | |||
Economic Volatility Impacting Occupancy Levels
Commercial Edge recorded a 60% year-on-year drop in US office transaction volume in 2023 to USD 34 billion, reflecting broad investor caution. When sentiment weakens, corporates often unwind flex seats before down-sizing owned premises, creating rapid revenue pressure for operators. WeWork’s post-bankruptcy restructuring underscores sensitivity to macro cycles, as variable-revenue models amplify downside risk during demand shocks. Higher interest rates further squeeze expansion plans by elevating fit-out financing costs, forcing many providers to delay new openings.
Profitability Challenges & Operator Consolidation
Persistent rent arbitrage dependency means operators must sustain high occupancy to break even. Forbes analysis revealed that fewer than one-third of US coworking centres generated positive free cash flow in 2024[3]Forbes Real Estate Council, “Why Coworking Margins Remain Elusive,” Forbes, forbes.com. Larger platforms are responding with M&A: CBRE’s USD 400 million acquisition of Industrious created a hybrid property-services division that can cross-sell asset management, building experience and data analytics at scale. Sub-scale independents lacking technology and procurement leverage are likely to exit or adopt franchise models, accelerating market shake-out.
*Our forecasts treat driver/restraint impacts as directional, not additive. The impact forecasts reflect baseline growth, mix effects, and variable interactions.
Segment Analysis
By User: Enterprises Underpin Market Scale
Enterprises controlled 30.60% of 2025 revenue, cementing their influence over pricing and amenity standards in the US coworking workspace market. Many Fortune 1000 companies dedicate more than 10% of their footprints to coworking solutions, a share expected to climb to 58% within two years as hybrid programmes mature. The biggest corporates negotiate multi-city passes that allow staff to tap a nationwide footprint, ensuring location parity for project teams. Internal data-driven seat-management tools interface with operator APIs to release blocks of unused desks daily, boosting utilisation. This institutional behaviour provides recurring revenue that stabilises the overall US coworking workspace market against short-term start-up churn.
Start-ups and other emerging users represent the fastest-growing cohort with a 8.9% CAGR forecast to 2031, energising local communities in Austin, Miami and Raleigh. Lower entry barriers permit founders to iterate without a long-term rent burden, while remote-first digital agencies co-locate periodically for sprint cycles. Airlines, travel networks and even universities now bundle on-demand passes, broadening exposure and embedding the brand of the US coworking workspace market in unconventional channels.


By Office Type: Premium Grade Retains Pricing Power
Grade A space held 61.30% of US coworking workspace market share in 2025 as corporates prioritised best-in-class buildings with high ventilation, wellness accreditations and collaborative floor plates. Average Class A rents rose 3.1% despite elevated vacancy elsewhere, confirming a flight-to-quality trend. Operators in trophy towers differentiate through hospitality-level services and proprietary experience apps that aggregate booking, community events and ESG reporting. These premium centres anchor brand perception and allow providers to cascade design standards down portfolio tiers.
Grade B locations, while less central, are set to register an 10.64% CAGR through 2031, outperforming headline growth for the broader US coworking workspace market. Adaptive reuse of obsolete suburban offices and retail centres into coworking suites reduces capex relative to ground-up development. Tenants who value fit-out efficiency over prestige accept moderate design specifications in exchange for 20-30% rent discounts. Incremental upgrades—such as modular phone booths, smart-access control and LED retrofits—help operators capture rent premiums without undertaking full-scale deep retrofits.
By Sector: Technology Leads, Services Accelerate
Technology and IT-enabled services constituted 50.60% of 2025 demand, reinforcing their long-standing affinity with agile space that mirrors product-development sprints. High-velocity venture funding cycles, frequent team resizing and distributed engineering squads create natural alignment with short-term licensing rather than long-term leases, which explains the sector’s weight within the US coworking workspace market. Advanced occupiers deploy occupancy-analytics dashboards tied to code-deployment calendars to adjust seat allocations in near real time.
Business consulting and professional-services firms are on course for a 9.3% CAGR, reflecting the growing independent consultant community and large advisory houses pivoting to hybrid service delivery. Coworking space offers client-facing meeting rooms and touchdown points near courthouse districts, financial centres or life-science corridors, enhancing service responsiveness. BFSI adoption remains steady as banks accommodate employee flexibility and maintain downtown visibility, while legal, retail and energy applications present steady incremental gains.
By Region: Northeast Dominates, South Surges
The Northeast retained 33.70% share of US coworking workspace market size in 2025 on the back of New York and Boston’s premium unit economics—the average workstation price in Manhattan exceeds USD 900 per month, 30% above national norms. Dense clusters of investment managers, law firms and media groups sustain weekday utilisation even as total leased footprints shrink. Forward booking data show rising demand for short-cycle meeting rooms to host investor days and quarterly off-sites, thereby reinforcing revenue per available desk.
The South is projected to accelerate at a 8.95% CAGR, outpacing all other regions as cost-sensitive corporates and start-ups converge on Atlanta, Dallas and Tampa. Lower wages, pro-business legislation and access to talent from regional universities underpin relocation momentum. Suburban nodes within Sunbelt metros now act as testbeds for drive-to-desk coworking, a format that reduces commute times and yields lower carbon footprints compared with CBD travel patterns. This structural shift is lifting the baseline capacity utilisation for operators that pivot early.
Geography Analysis
The Northeast’s commanding 33.70% revenue hold is undergirded by scarce Class A inventory and elevated face rents, compelling firms to substitute long-term leases with pay-as-you-go suites in iconic buildings. Banking, legal and media tenants exploit these locations to stage periodic collaboration bursts while maintaining head-office prestige; 98% of financial-services employees still expect hybrid options, a figure that cements coworking space as a strategic necessity. Limited supply ensures that operators can maintain premium day-rate pricing while pushing occupancy analytics that fine-tune inventory release windows.
The South’s 8.95% projected CAGR represents the fastest regional expansion inside the US coworking workspace market. Corporate relocations from high-tax states funnel consistent headcount into coworking inventory, while venture-debt availability fuels start-up formation. Operators such as TailoredSpace have pre-leased retail anchors and office parks for conversion, taking advantage of lower fit-out costs and ample parking. Large corporate tenants eye satellite offices that allow distributed employees to converge without incurring cross-state travel cost.
Midwest and West regions present stable mid-single-digit growth profiles. The Midwest benefits from suburban roll-outs of fitness-integrated coworking models that monetise underutilised mall space. Western markets, while still premium-priced, have absorbed some vacancy through tech downsizing, yet Amazon’s 141,000-square-foot flex lease in Santa Clara illustrates continued big-tech appetite for variable-term space even amid cost optimisation cycles.
Competitive Landscape
The US coworking workspace market remains moderately fragmented, but the consolidation drumbeat grows louder. CBRE’s USD 400 million purchase of Industrious in January 2025 created the largest hybrid property-services unit in the country, melding building operations, tenant experience and on-demand space into a single profit centre. IWG continues its hub-and-spoke expansion, focusing on suburban centres that capture commuting-time savings. WeWork, recovering post-reorganisation, has pivoted to an affiliate model with Vast Coworking Group, expanding reach to 75 additional locations without capex.
Technology deployment differentiates scale players: Arm’s IoT-based Space Analytics platform informs predictive cleaning schedules, energy controls and dynamic pricing, collectively raising EBITDA margins by up to 300 basis points at pilot centres. Smaller independents lack the data architecture to replicate such efficiencies and therefore rely on niche positioning—ranging from creative studios to biotech wet-labs—to defend share.
Landlord relationships increasingly revolve around management contracts rather than fixed-rent leases. CoworkIntel data indicate that 70% of centres still operate under traditional leases, but the revenue-share cohort is expanding fastest as building owners seek co-retention upside. Asset-light structures curb operator capital expenditure while giving landlords a slice of the upside during bull cycles. Strategic alliances with airlines, hotel chains and prop-tech firms further widen demand funnels and embed the US coworking workspace market inside adjacent service ecosystems.
United States Coworking Office Space Industry Leaders
Regus
WeWork
Spaces
Industrious Office
Office Evolution
- *Disclaimer: Major Players sorted in no particular order

Recent Industry Developments
- January 2025: CBRE Group acquired Industrious National Management Company for USD 400 million, forming the Building Operations & Experience segment.
- January 2025: CBRE established its global financial headquarters at Lever House, taking 64,350 square feet operated by Industrious.
- December 2024: Amazon executed one of Manhattan’s largest 2024 leases inside a WeWork facility, underscoring blue-chip appetite for flex inventory.
- December 2024: Regus acquired a former WeWork site in Miami Beach, continuing post-restructuring asset reallocation.


United States Coworking Office Space Market Report Scope
A coworking office space is an arrangement in which workers of different companies share an office space, allowing cost savings and convenience through the use of common infrastructures, such as equipment, utilities, reception and custodial services, and refreshments and parcel acceptance services. The US coworking office space market is segmented by end user, type, and application. The report offers market size and forecast in value (USD billion) for all the above segments.
By User
| Freelancers |
| Enterprises |
| Start Ups and Others |
By Office Type
| Grade A |
| Grade B |
| Grade C |
By Sector
| Information Technology (IT and ITES) |
| BFSI (Banking, Financial Services and Insurance) |
| Business Consulting & Professional Service |
| Other Services (Retail, Lifesciences, Energy, Legal Services) |
By Region
| Northeast |
| Midwest |
| Southeast |
| West |
| Southwest |
| By User | Freelancers |
| Enterprises | |
| Start Ups and Others | |
| By Office Type | Grade A |
| Grade B | |
| Grade C | |
| By Sector | Information Technology (IT and ITES) |
| BFSI (Banking, Financial Services and Insurance) | |
| Business Consulting & Professional Service | |
| Other Services (Retail, Lifesciences, Energy, Legal Services) | |
| By Region | Northeast |
| Midwest | |
| Southeast | |
| West | |
| Southwest |


Key Questions Answered in the Report
How large is the US Co Working Office Space market in 2026?
The US Co Working Office Space market size stands at USD 5.38 billion in 2026 and is forecast to grow to USD 7.79 billion by 2031 at an 7.72% CAGR.
Which user group accounts for the largest share of US Co Working Office Space demand?
Enterprises lead with 30.60% share, reflecting deep corporate integration of coworking offices for hybrid work support.
Which region is expanding fastest?
The South is the pace-setter, expected to record a 8.95% CAGR through 2031 owing to cost advantages and vibrant start-up ecosystems.
What office type commands the highest share?
Grade A facilities dominate with 61.30% of US coworking workspace market share, buoyed by flight-to-quality preferences.
How are operators addressing profitability challenges?
Leading providers are shifting toward revenue-share contracts, deploying space-analytics technology and engaging in strategic M&A to gain scale and reduce capital intensity.
What is driving suburban coworking growth?
Hybrid commuting patterns, lower real-estate costs and the 15-minute-city concept are steering both employers and independents toward suburban coworking space options, boosting utilisation and operator margins.
Page last updated on:


