
Credit Cards Market Size and Share
Credit Cards Market Analysis by Mordor Intelligence
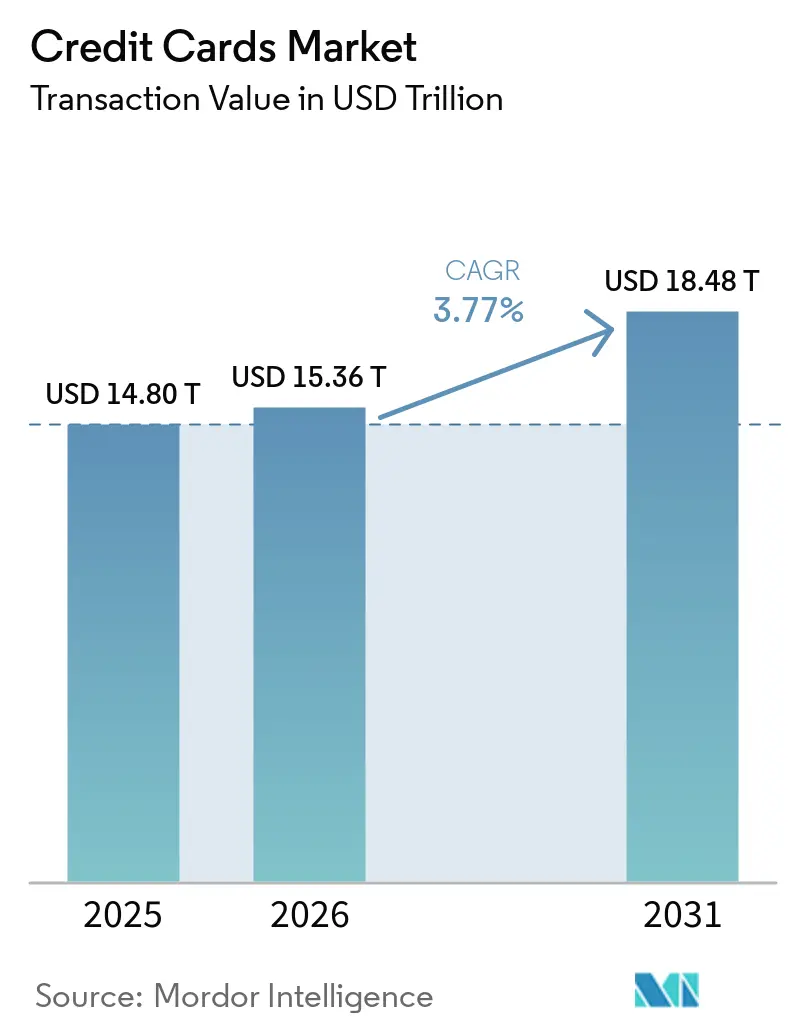
The credit cards market size is estimated at USD 15.36 trillion in 2026 and is projected to be USD 15.94 trillion in 2027, reaching USD 19.33 trillion by 2032, growing at a CAGR of 3.93% from 2027 to 2032.
Contactless acceptance and stored credentials extend the payment occasions a credit relationship can serve, including routine spending in Singapore. Digital commercial cards add a proposition that links payment administration with borrowing capacity for business buyers. Incumbents are broadening premium and co-branded portfolios, increasing the specificity a challenger needs to offer a useful alternative. Fee limits and tighter credit terms temper the commercial benefit of wider acceptance, making continuing purchase use and sustainable lending central to a viable card proposition.
Key Report Takeaways
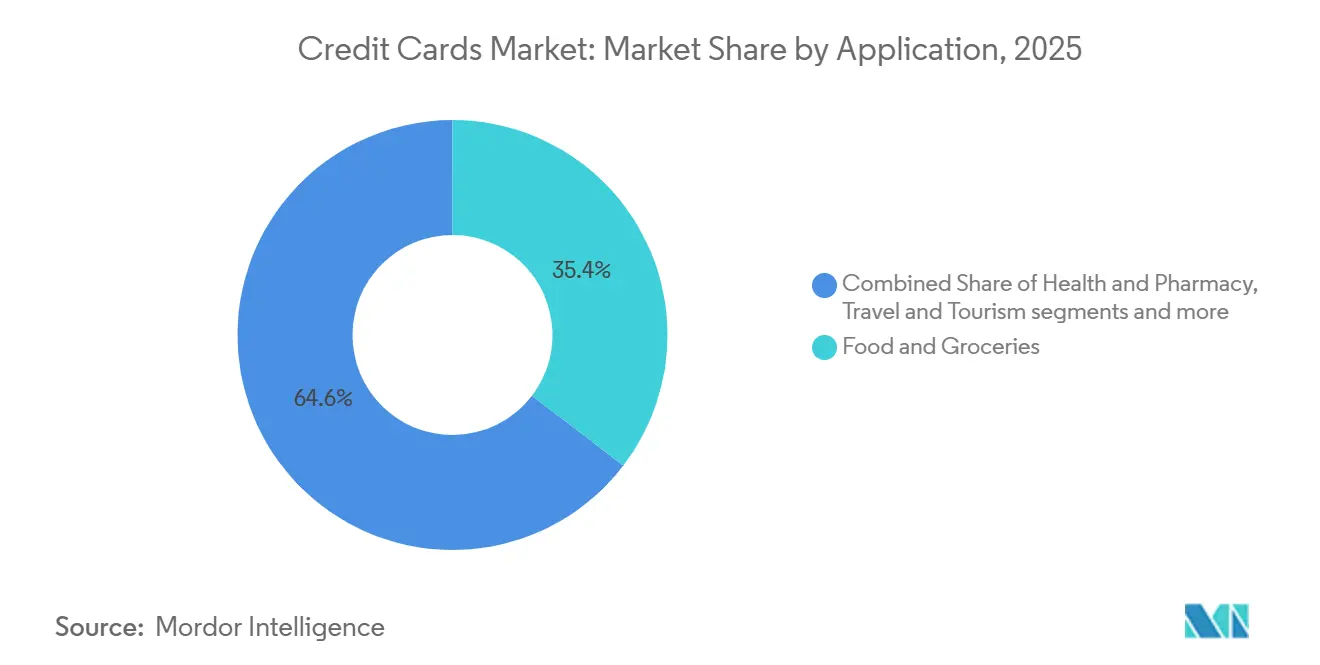
- By application, food and groceries held a 35.18% credit cards market share in 2026, while travel and tourism is forecast to grow fastest at a CAGR of 6.25% from 2027 to 2032.
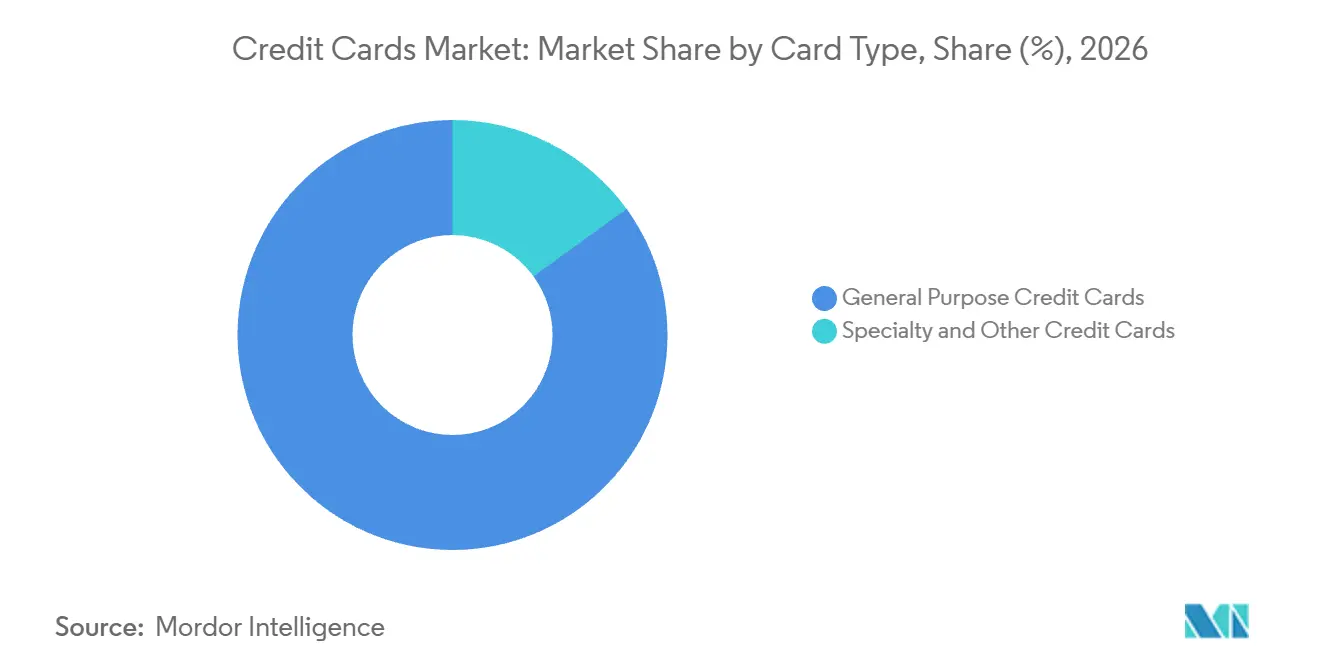
- General-purpose credit cards led the card-type breakdown with an 84.98% share of the credit cards market size in 2026, while specialty and other credit cards are forecast to expand fastest at a CAGR of 4.5% from 2027 to 2032.
- Among card formats, physical cards held an 89.83% share in 2026, with digital cards forecast to grow fastest at a CAGR of 6.95% from 2027 to 2032.
- By provider, Visa’s 52.08% share in 2026 led the category, while other providers are forecast to grow fastest at a CAGR of 5.2% from 2027 to 2032.
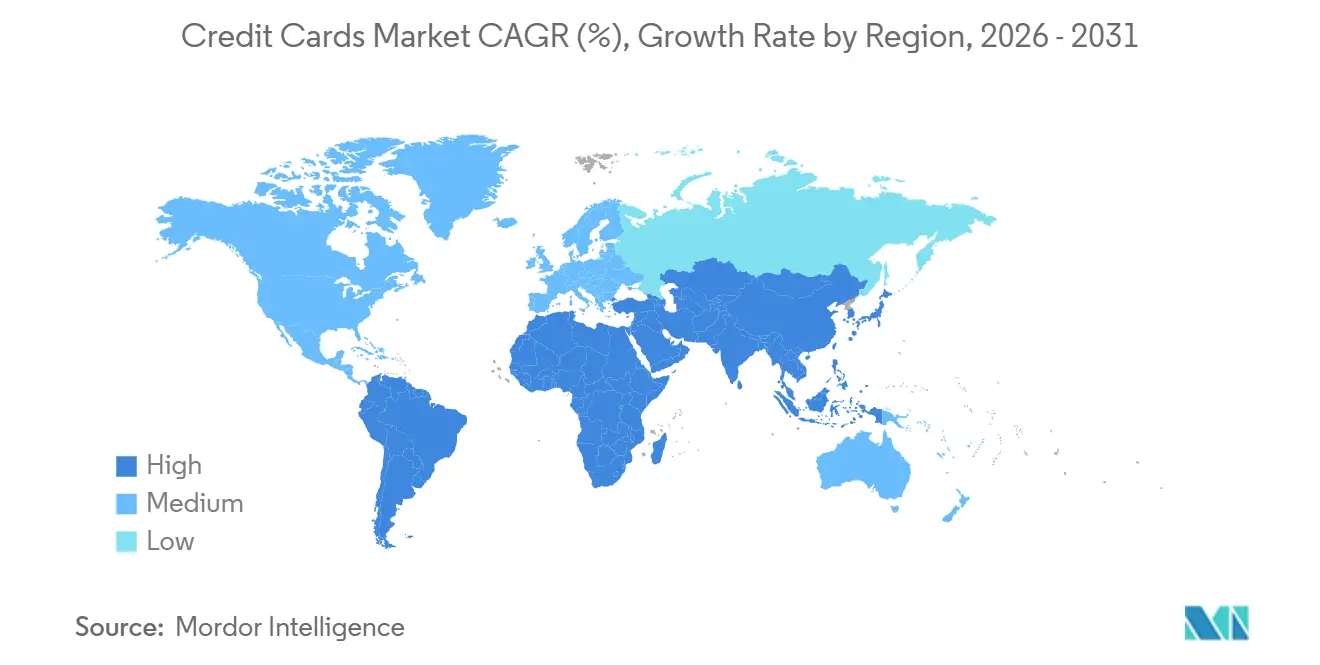
- Geographically, North America led with a 45.54% share in 2026, and Asia-Pacific is forecast to be the fastest-growing geography at a CAGR of 4.42% from 2027 to 2032.
Note: Market numbers in this report are based on Mordor Intelligence's proprietary estimation framework, which combines nine months of actuals with Q4 projections for base year 2026.
Market Trends and Insights
Drivers Impact Analysis of Credit Cards Market*
| Driver | (~) % Impact on CAGR Forecast | Geographic Relevance | Impact Timeline |
|---|---|---|---|
| Contactless ubiquity lifts card-present spend (tap-to-pay penetration, transit, retail) | +1.2% | United States and Singapore | Short term (≤ 2 years) |
| Network tokenization and passkeys raise approval rates, cut CNP fraud | +1.3% | Europe and Asia-Pacific excluding Bangladesh, Bhutan, India and Nepal | Short term (≤ 2 years) |
| Card-funded wallets and subscriptions expand card-on-file volumes | +1.1% | United States and Europe outside Russia | Medium term (2-4 years) |
| Cross-border e-commerce and travel recovery support high-yield transactions | +1% | North America, Europe and Asia-Pacific | Short term (≤ 2 years) |
| Installments-on-card (issuer/network BNPL) recaptures pay-later volumes | +0.6% | Qatar | Medium term (2-4 years) |
| SoftPOS/Tap to Pay on iPhone expands SMB acceptance in cash-heavy niches | +0.4% | Estonia, Latvia, Lithuania, Monaco and Norway | Medium term (2-4 years) |
| Source: Mordor Intelligence | |||
Contactless ubiquity lifts card-present spend (tap-to-pay penetration, transit, retail)
Transit acceptance can turn a payment card into a fare credential without a separate stored-value balance. Visa said tap-to-pay penetration had crossed 80% of its network’s domestic face-to-face transactions worldwide in fiscal Q1 2026, across card products. From May 15, 2025, Singapore’s Land Transport Authority enabled commuters to tap eligible American Express cards for public transport fares.[1] Eligible products included credit, charge, debit and prepaid cards issued by American Express or its partners worldwide. Commuters could pay without preregistering cards or topping up a separate travel card, with charges posted like retail transactions. With tap accounting for most domestic face-to-face Visa transactions in fiscal Q1 2026, transit acceptance connects that established payment method to routine commuting for eligible cardholders.
Network tokenization and passkeys raise approval rates, cut CNP fraud
Online merchants benefit when secure credentials can reach an authorization decision without unnecessary rejection at checkout. VisaNet data showed authorization rates 4.8% higher for tokenized than primary account number credentials in global credit and debit card-not-present transactions during January through December 2025. From April 18, 2026, Visa required issuer support for Payment Passkey transactions, including merchant-led enrollments, in Europe and its Asia-Pacific region excluding Bangladesh, Bhutan, India and Nepal. Issuers must not systematically decline these requests, subject to transaction-by-transaction evaluation. Together, credential protection and issuer support can help merchants convert an existing purchase attempt into an authorized card payment.
Card-funded wallets and subscriptions expand card-on-file volumes
Recurring bills make the stored payment relationship commercially relevant beyond a single online purchase. KUBRA’s American Express-sponsored 2025 survey found that 59% of respondents identified subscriptions such as streaming among bills most frequently paid with credit cards. The online survey randomly sampled 1,028 U.S. adults over 18 who identified as responsible for bills and mortgage payments. In September 2025, card-on-file and wallet-button checkout together represented 84% of Visa-processed approved card-not-present e-commerce transactions across card products, excluding Russia, China and Visa Direct in Peru. Card-on-file covered tokenized and non-tokenized credentials. The issuer’s competitive opportunity is to retain the stored funding credential even when a wallet provides the visible checkout.
Cross-border e-commerce and travel recovery support high-yield transactions
Cross-border purchasing gives issuers a growth route tied to international spending rather than domestic card distribution alone. Visa reported 13% year-over-year growth in constant-dollar cross-border volume in the 3 months ended June 30, 2026. The measure included credit, debit and other Visa-branded form factors, with 12% growth excluding intra-Europe transactions. The constant-dollar basis makes the increase relevant to underlying spending activity rather than exchange-rate translation alone. Cross-border volume growth outpaced the network’s 10% total payments-volume growth on the same constant-dollar basis, making international use the faster-growing part of the network’s volume during the quarter.
Restraints Impact Analysis of Credit Cards Market*
| Restraint | (~) % Impact on CAGR Forecast | Geographic Relevance | Impact Timeline |
|---|---|---|---|
| Interchange caps and network fee regulation compress issuer economics | -0.5% | Australia | Short term (≤ 2 years) |
| Rising delinquencies/charge-offs tighten underwriting and credit lines | -0.7% | United States | Short term (≤ 2 years) |
| Authentication friction (SCA/3DS2.2) depresses e-commerce conversion in some markets | -0.3% | Germany | Medium term (2-4 years) |
| A2A/pay-by-bank displaces cards in bill pay and select verticals | -0.2% | United Kingdom | Long term (≥ 4 years) |
| Source: Mordor Intelligence | |||
Interchange caps and network fee regulation compress issuer economics
Fee regulation can constrain both interchange receipts and the cardholder benefits supported by a card proposition. From October 1, 2026, the Reserve Bank of Australia (RBA) lowered the personal credit-card interchange cap from 0.8% to 0.3% on domestic transactions.[2] Bendigo Bank announced reduced Qantas Points earning on eligible Qantas Platinum Rewards Credit Card purchases from November 23, 2026, citing RBA payment-fee changes. The 20,000-point cap per statement period will remain. The announcement connects fee regulation to the issuer’s choice of purchase incentives, beyond the fee collected on an individual transaction. The commercial cost can therefore extend from the issuer’s fee receipts to the card’s ability to attract eligible purchase spending.
Rising delinquencies/charge-offs tighten underwriting and credit lines
Credit availability can constrain card spending even when payment acceptance presents no obstacle for the household. In Q2 2026, 3 of 45 surveyed U.S. banks reported tightening consumer credit-card approval standards somewhat.[3] Separately, 2 of 45 respondents reported tightening credit limits on new or existing consumer credit-card accounts somewhat. The first restriction narrows access at application, while the second can reduce the headroom available for purchases after approval. These are distinct constraints for issuers seeking transaction growth because acquiring an eligible customer does not itself provide additional borrowing capacity. Where a bank lowers an account limit, the cap binds purchases at every merchant, however widely the card is accepted.
*Our forecasts treat driver/restraint impacts as directional, not additive. The impact forecasts reflect baseline growth, mix effects, and variable interactions.
Credit Cards Market Segment Analysis
By Application:
Grocery Spending and Travel DemandFood and groceries accounted for a 35.18% share of the credit cards market size in 2026, making it the largest segment. Visa reported around 25% higher food-and-grocery spending in Egypt during February 13 to 18, 2026, than during February 7 to 12. Visa Consulting & Analytics built its Retail Spend Monitor from a subset of VisaNet data complemented by survey-based estimates for other payment methods. Such a short seasonal increase illustrates how an established retail application can concentrate payment demand into a narrow calendar window. For card issuers serving Egyptian grocery shoppers, capturing such a short spending surge depends on having usable accounts before the seasonal window opens.
Travel and tourism is forecast to be the fastest-growing segment, with a CAGR of 6.25% from 2027 to 2032. Visa reported increased international visitors’ spending on its premium cards in the UAE in December 2025. Mastercard Economics Institute also found that 5 of the 10 destinations with the strongest 2024-2025 shift toward corporate travel relative to leisure were in Asia-Pacific. Its index combined changes in corporate shares of hotel and restaurant spending and of airline bookings, identifying a changing travel mix. These channels create room for travel-oriented cards that address visitor spending and corporate journeys through different purchase occasions.

By Card Type:
Broad Utility and Partner EconomicsGeneral-purpose credit cards represented an 84.98% credit cards market share in 2026, making them the largest segment. U.S.-issued general-purpose credit cards generated USD 6.512 trillion in purchase volume in 2025, up 6.1% from 2024. Their economic purpose is to put a reusable credit relationship behind purchases across unrelated merchants, allowing several spending needs to be served through one account. That breadth connects the issuer’s lending decision to the overall customer relationship rather than to a single merchant purchase or marketing partnership. Because a general-purpose card can serve unrelated merchants on one network, issuers can differentiate through credit terms and rewards across several spending categories.
Specialty and other credit cards are forecast to be the fastest-growing segment, with a CAGR of 4.5% from 2027 to 2032. ICICI Bank issues its Amazon Pay credit card in association with Amazon and Visa. The card’s user base grew 15% year over year during the opening days of Amazon Great Indian Festival 2026 in India. In the United States, remuneration from Alaska’s co-brand portfolio grew 10% in 2025, fueled by Atmos Rewards and the premium Summit Visa Infinite card. Retail co-brands can reach shoppers during concentrated buying events, while airline programs can connect the card’s economics to a continuing loyalty relationship.
By Card Format:
Physical Continuity and Digital WorkflowsPhysical cards held an 89.83% share in 2026, making them the largest segment. Among Irish residents, 1.62 million physical credit cards were in circulation in December 2025, up 2.21% from December 2024. The growing Irish stock therefore keeps card production and fulfillment relevant to issuer operations. In its February 2026 filing, U.S. issuer Synchrony said its service delivery solutions organization oversaw credit-card personalization, fulfillment and delivery, with Fiserv providing those production services. Outsourcing these activities separates production from issuer oversight, making the specialist supplier relationship part of sustaining physical-card delivery.
Digital cards are forecast to be the fastest-growing segment, with a CAGR of 6.95% from 2027 to 2032. On October 9, 2025, Citizens launched Citizens Edge, a U.S. commercial credit card for growth-stage and middle-market companies, in partnership with Mastercard. The offer combined flexible credit limits, secure virtual-card options and integrated travel and expense management. For business buyers, this combination can connect borrowing capacity with the administration of company payments through the same card proposition.
By Provider:
Network Scale and Distinct Card PropositionsVisa held a 52.08% share in 2026, making it the largest segment. Visa Credit Programs recorded USD 7.47 trillion in worldwide purchase volume in the 12 months ended June 30, 2026, excluding Europe co-badged volume. Financial-institution clients offer Visa-branded credit programs, connecting bank-level product propositions to a shared payment network. That structure allows issuer relationships to complement network-level transaction scale rather than requiring each bank to create an independent payment network. A bank weighing another network must therefore set that network’s distinctive proposition against access to an established flow of card purchases.
Other providers are forecast to be the fastest-growing segment, with a CAGR of 5.2% from 2027 to 2032. JCB, whose business includes credit-card operations and related services, reported 181.9 million cardmembers as of March 2026, including other payment-related products. That customer franchise offers a platform for further card-program development, making customer engagement a competitive asset alongside the network itself. Mastercard made its World Legend consumer credit-card tier available to banks worldwide on July 15, 2025, with dining, entertainment and travel benefits. Provider selection can therefore involve different combinations of an operator’s broader customer franchise and a specific benefits architecture.
Geography Analysis
North America Credit Cards Market
North America held a 45.54% credit cards market share in 2026, making it the largest geography. In Canada, credit cards led payment types by transaction volume in 2025, with 11.6 billion transactions, up 7% year over year. Visa reported USD 3.58 trillion in U.S. credit-program purchase volume for the 12 months ended June 30, 2026, up 8.9% from the preceding 12 months, based on network processing and financial-institution client reports. Canada’s high transaction count makes processing scale central, while the U.S. Visa purchase flow shows the dollar value that credit programs carry in the region.
Asia-Pacific Credit Cards Market
Asia-Pacific is forecast to be the fastest-growing geography, with a CAGR of 4.42% from 2027 to 2032. India’s provisional domestic credit-card payment volume rose from 486.2 million transactions in July 2025 to 605.3 million in July 2026. The RBI series counts domestic financial transactions only, so the rise reflects card use inside India rather than overseas travel. A proposition built around usable domestic credit can therefore address that flow directly, while an offer dependent solely on overseas travel would serve a narrower payment purpose.
In South America, Itaú Unibanco reported higher credit-card transaction volume in its card-issuing activities in 2025 than in 2024. Europe’s issuer activity included Germany-based Hanseatic Bank, whose 2025 credit-card product turnover rose 11.4% to EUR 3.33 billion (USD 3.76 billion). In the Middle East and Africa, South African banks processed 950.365 million credit-card purchases in 2025. Itaú linked higher issuing revenues to transaction volume, while Hanseatic’s exclusively credit-enabled cards make lending capability integral to its German specialist model. Central Bank of the UAE subsidiary Al Etihad Payments announced in February 2025 that the UAE’s domestic Jaywan scheme infrastructure was ready for activation, with credit-card variants planned for ATM, point-of-sale and ecommerce use.
Mordor Intelligence provides coverage of the credit cards market across other key regional markets, including Europe, each with their regulatory frameworks and demand patterns. Detailed country-level analysis extends to Japan, Hong Kong, Israel, and Canada incorporating local coverage and market participation, as required.
Regulatory Framework and Outlook
This comparison examines selected jurisdictions from the perspective of licensed consumer credit-card issuers. The operating question is how much freedom an issuer retains to grant credit, maintain customer relationships and earn from account use. Ongoing monitoring and financing-charge obligations can affect a card proposition as well as the work needed to administer it.
Regulatory Table of Credit Cards Market
| Decision factor | United States | Brazil | United Kingdom | India | United Arab Emirates |
|---|---|---|---|---|---|
| Primary authority | Consumer Financial Protection Bureau (CFPB) | Conselho Monetário Nacional (CMN) and Banco Central do Brasil | Financial Conduct Authority | Reserve Bank of India | Central Bank of the UAE |
| Key instruments or direction | Regulation Z, 12 CFR 1026.51, for open-end, non-home-secured consumer credit; additional requirements for applicants under 21 | Law 14,690, Article 28; annual self-regulatory charge-limit submissions for revolving and installment card balances in open or closed arrangements | CONC 6.7.3AR monitoring duties; April 2026 promotion-simplification proposal retaining Consumer Duty | Network-choice directions exclude own-authorized-network issuers; customer-choice duty also exempts issuers with 1 million or fewer active cards | Consumer Protection Standards, clauses 2.1.3.20 and 7.1.5.14 |
| Commercial effect | Consider income or assets and current obligations before opening accounts or increasing limits; maintain reasonable written policies | Submit reasoned annual financing-charge limits for CMN approval through Banco Central do Brasil | Monitor repayment and relevant information; act appropriately on signs of actual or possible financial difficulty | Covered issuers cannot accept restrictive network agreements; offer eligible new customers network choice and may offer existing cardholders choice at next renewal | Explain balance costs; no interest or finance fees when the new statement balance is paid in full by the due date, excluding cash advances |
| Current policy attractiveness | Medium | Medium | Medium | High | Medium |
| Future direction of policy attractiveness | No change | Hardening | No change | No change | No change |
| Source: Mordor Intelligence | |||||
The U.S. Medium and No change judgments balance ability-to-pay duties with the CFPB’s January 2026 deregulatory agenda. Brazil’s Medium rating and Hardening direction reflect annual charge-limit submissions and the broader September 25, 2026, provisional responsible-credit mandate, under congressional review on October 20, 2026. The United Kingdom’s Medium and No change judgments reflect card-monitoring duties, while the April 2026 promotion-simplification proposal would retain Consumer Duty obligations. India’s High rating reflects issuer choice among networks, and the UAE’s Medium rating reflects balance-cost protections, with No change directions anchored in their network-choice and consumer-protection frameworks.
Value Chain Stages
This comparison follows credit-card issuance, merchant processing and network execution, separating each participant’s activity from its earnings. In the typical U.S. credit-card fee flow, the merchant’s bank or acquirer pays interchange to the issuer, while processors or acquirers receive fees for services including transaction routing. Visa’s broader card-transaction model places authorization, clearing and settlement between consumers, issuing and acquiring institutions, and sellers. These distinctions matter because a single purchase can support several service relationships without making the network the lender.
Value Chain Analysis Table of Credit Cards Market
| Primary activity | Key participants | Value capture | Bottleneck | Resilience response |
|---|---|---|---|---|
| Credit-card issuance and account relationship | U.S. card issuers such as JPMorgan Chase and Wells Fargo & Co. | Issuer interchange receipts from the merchant’s acquirer | Credit provision must fit the account’s repayment capacity | Align account limits with repayment assessment |
| Merchant processing and acquiring | Processors such as Global Payments; integrated merchant acquirers such as American Express | Processor or acquirer fees for routing and related services | Transaction exceptions can interrupt merchant payment administration | Maintain exception handling and chargeback-resolution capacity |
| Network authorization, clearing and settlement | Payment networks such as Visa | May earn service, data-processing, international-transaction or other revenue on Visa-branded transactions | Coordination between issuing, acquiring and merchant endpoints | Monitor transaction handoffs and reconcile settlement records |
| Source: Mordor Intelligence | ||||
Supplier earnings consequently depend on different capabilities, from credit provision to exception handling and network coordination. Global Payments’ processing work includes chargeback resolution, giving back-office service a role alongside the initial authorization. In Visa’s model, the acquirer pays the seller the purchase amount less the merchant discount, connecting transaction execution to merchant settlement.
Competitive Landscape
Competition has a concentrated network layer and a broader set of issuing franchises, making business model as relevant as scale. Wells Fargo & Co., JPMorgan Chase, Citigroup, American Express and Bank of America compete through established card businesses. Wells Fargo’s 2025 credit-card revenue grew 8%, with USD 186 billion in purchase volume and USD 52.9 billion in average loan balances. American Express combined card-issuing and network activities across credit and charge products and reported USD 455.8 billion in Q2 2026 billed business, up 9% year over year. That mix gives issuers different ways to support cardholder relationships, with lending scale and an integrated transaction franchise offering distinct competitive bases.
Portfolio breadth gives incumbents a way to contest several cardholder needs before a challenger can establish a narrow specialty. JPMorgan Chase’s 2025 actions included refreshing Sapphire Reserve, United and Southwest cards and launching Sapphire Reserve for Business. Citi announced Strata Elite for premium travel and dining on July 28, 2025, and launched a mid-tier travel rewards credit card with American Airlines and Mastercard on October 19, 2025. Citi’s premium and mid-tier introductions put different travel-rewards tiers within one issuer’s portfolio, making a rival’s choice of benefit level as relevant as its choice of airline partner.
Credit-card competition also depends on risk-adjusted margin, measured as revenue after interest expense and net charge-offs relative to average loans. Bank of America reported USD 377.8 billion in 2025 credit-card purchase volume across its Consumer Banking and Global Wealth and Investment Management consumer portfolios. Its card risk-adjusted margin increased 8 basis points in 2025, primarily from higher net interest margin and lower net charge-offs, partly offset by lower fee income. Higher purchase volumes can enlarge a franchise, but credit losses and fee compression determine how much of that activity supports sustainable issuer earnings. Where regulators cap interchange, as Australia has for domestic consumer credit cards, an issuer’s margin rests more on credit performance than on fee income.
Credit Cards Industry Leaders
-
Wells Fargo & Co.
-
JPMorgan Chase
-
Citigroup
-
American Express
-
Bank of America
- *Disclaimer: Major Players sorted in no particular order

Credit Cards Market Companies Covered in this Report
- Visa
- Mastercard
- American Express
- Discover
- China UnionPay
- JPMorgan Chase
- Citigroup
- Bank of America
- Capital One
- Barclays
- HSBC
- Wells Fargo & Co.
- ICBC
- HDFC Bank
- SBI Cards and Payment Services
- Rakuten Card
- Nubank
- Itaú Unibanco
- Banco Santander
- Emirates NBD
Key Opportunities for Market Participants
This comparison considers retail-linked distribution, selective first-card access and broader general-purpose card use among U.S. shoppers. Synchrony launched a general-purpose and private-label credit-card program with OnePay at Walmart in September 2025, acting as issuer while Mastercard provided the general-purpose network. The companion private-label card was restricted to Walmart purchases. In 2025, 46% of U.S. adults with family income below USD 25,000 had a credit card, compared with 97% of those with family income of USD 100,000 or more.
Market Opportunities Table of Credit Cards Market
| Opportunity | Why now | Buyer / lead segment | Recommended play | Main barrier | Likely beneficiaries |
|---|---|---|---|---|---|
| Retail-fintech distribution for general-purpose cards | An issuer-fintech-retailer model became operational in 2025 | Retail shoppers seeking a general-purpose payment relationship | Develop programs with additional retail and fintech partners | Securing distribution partnerships and a useful card proposition | Card issuers, fintech partners and general-purpose networks |
| Selective first-card access | The 2025 ownership gap identifies a potential audience alongside the retail distribution model | Creditworthy applicants in lower-income U.S. households | Match initial credit limits and terms to assessed repayment capacity | Establishing individual eligibility and affordability | Issuers able to assess and serve first-card applicants |
| Broader use beyond the retail checkout | The 2025 program paired a general-purpose option with retailer-linked distribution | Applicants for retail-linked general-purpose cards | Design and explain benefits useful across merchants | Creating continuing value beyond one retailer | General-purpose issuers and their network partners |
| Source: Mordor Intelligence | |||||
The lower-ownership group is a potential audience for carefully assessed applications and card terms matched to repayment capacity. Retail-linked distribution can make that proposition accessible through an identifiable shopping relationship. A general-purpose card relationship must remain useful beyond the partner’s checkout to turn retail distribution into continuing purchase activity.
Recent Industry Developments in Credit Cards Market
- Oct 2026: Chase and IHG Hotels & Resorts announced the IHG One Rewards Premier Select credit card and updates to 3 existing IHG One Rewards cards in the United States.
- Sep 2026: Citi launched Citi Commerce Media, a platform connecting brands with U.S. credit-card customers through Citi’s digital ecosystem.
- Aug 2026: American Airlines, Citi and Mastercard announced enhanced premium travel and lifestyle benefits for the Citi / AAdvantage Executive World Legend Mastercard in the United States.
Credit Cards Market Report Scope and Research Methodology
Market Definition and Coverage
The Credit cards market measures annual purchase value charged to revolving credit cards used by consumer and commercial cardholders worldwide. It covers purchases settled through open-loop credit card networks, including physical cards and digital credentials.
Scope exclusions: Private-label store cards, charge cards without a revolving credit facility, debit cards, prepaid cards, account-to-account payments, issuer interest and fees, and network, acquirer, or processor fees are excluded.
Segments Covered in This Report
- By Application
- Food & Groceries
- Health & Pharmacy
- Restaurants & Bars
- Consumer Electronics
- Media & Entertainment
- Travel & Tourism
- Other Applications
- By Card Type
- General Purpose Credit Cards
- Specialty & Other Credit Cards
- By Card Format
- Physical
- Digital
- By Provider
- Visa
- Mastercard
- Other Providers
- By Geography
- North America
- United States
- Canada
- Mexico
- South America
- Brazil
- Peru
- Chile
- Argentina
- Rest of South America
- Europe
- United Kingdom
- Germany
- France
- Spain
- Italy
- BENELUX
- NORDICS
- Rest of Europe
- Asia-Pacific
- India
- China
- Japan
- Australia
- South Korea
- South-East Asia
- Rest of Asia-Pacific
- Middle East and Africa
- United Arab Emirates
- Saudi Arabia
- South Africa
- Nigeria
- Rest of Middle East and Africa
- North America
Data Sources, Market Sizing, and Validation
Desk Research
Public statistics such as the Federal Reserve Payments Study, European Central Bank payments statistics, BIS payment statistics and the World Bank Global Findex survey support country-level checks of card activity, payment trends, transaction values and counts, and adoption patterns. The Federal Reserve provides transaction counts and values for United States card activity, the European Central Bank publishes card-payment values and use by period, BIS statistics define cross-country retail payment indicators, and Global Findex tracks card use and digital payment behavior across economies, providing context for adoption and geographic differences.
Issuer and network filings, annual reports, investor materials, and reputable financial press can supplement public payment statistics with purchase activity, account trends, credit conditions, and program changes, with each measure checked against its stated population and basis. These named sources are illustrative rather than exhaustive, and further sources inform collection, validation and clarification.
Primary Interviews and Surveys
When secondary evidence leaves questions about purchase activity, product coverage, or regional differences, interviews or structured surveys with card issuers, network and payment operations leaders, and merchant category specialists can test its interpretation. When analysts identify missing or conflicting inputs, they can use respondent feedback to check key assumptions and reconcile those gaps against public transaction data, company disclosures, and independent market indicators.
Distribution of primary research fieldwork respondents
| Company type | Respondent position | Region |
|---|---|---|
| Top tier: 35% | CXOs: 20% | APAC: 40% |
| Mid tier: 45% | Functional/Unit leaders: 35% | EMEA: 32% |
| Smaller Players: 20% | Managers: 45% | Americas: 28% |
Market-Sizing & Forecasting
Using published payment totals, card-network and issuer purchase activity, and country-level indicators, analysts can construct a global top-down estimate of annual eligible card purchase value, then selectively check it with issuer or network purchase-volume roll-ups and sampled transaction counts multiplied by average purchase amounts. When analysts assess active card use, card-payment frequency, average transaction value, consumer and commercial credit access, and merchant spending patterns, these indicators help establish the level and direction of purchase activity, while geography, card type, card format, provider, and merchant application shares can then be derived from consistent payment and company disclosures, with each purchase counted once across classification axes. Scenario analysis can project these indicators through the forecast period, with primary-research respondents checking the plausibility of variable-level paths and analysts reconciling incomplete country or segment inputs against adjacent periods, comparable markets, and published network or issuer totals.
Data Validation & Update Cycle
Analysts triangulate issuer and network disclosures with independent payment statistics, consumer-use surveys, and regulatory or economic indicators, checking that each series matches the market boundary, geography, unit, and year. Unusual movements or differences between sources are traced to definitions, coverage, timing, or data revisions before sign-off, with analysts reviewing reconciliations and re-contacting relevant respondents when an input remains unclear or a material discrepancy persists. The data and assumptions are refreshed annually, revisited between cycles when a material market or regulatory event occurs, and reviewed in a fresh pre-delivery pass.
Mordor Intelligence's Global Credit Cards Market Size Measured Against Other Published Estimates
Published estimates can differ in the transactions and products they count and the inputs used to model demand. The Credit cards market measures annual purchase value charged to revolving credit cards used by consumer and commercial cardholders worldwide.
Key Gap Drivers include the study's defined coverage and market-specific modeling choices. When analysts assess active card use, card-payment frequency, average transaction value, consumer and commercial credit access, and merchant spending patterns, these indicators help establish the level and direction of purchase activity, while geography, card type, card format, provider, and merchant application shares can then be derived from consistent payment and company disclosures, with each purchase counted once across classification axes.
Benchmark comparison
| Source | Market Size | Gaps in Research Methodology |
|---|---|---|
| Mordor Intelligence | USD 15.94 T (2027) | |
| Industry Research Firm A | USD 623 B (2025) | At its 2025 base, this estimate is 96.1% below this report's 2027 value of USD 15.94 T, 2 years later. The published total is presented as market revenue, whereas this study counts the full purchase amount charged to eligible cards. |
| Industry Research Firm B | USD 733 B (2025) | At its 2025 base, this estimate is 95.4% below this report's 2027 value of USD 15.94 T, 2 years later. The page expressly reports revenue, while this study measures eligible purchase value rather than revenue from card-payment activity. |
Mordor Intelligence's analysts triangulate issuer and network disclosures with independent payment statistics, consumer-use surveys, and regulatory or economic indicators, checking that each series matches the market boundary, geography, unit, and year.
Key Questions Answered in the Report
What is the credit cards market size and growth outlook?
The size is projected at USD 15.94 trillion in 2027 and USD 19.33 trillion by 2032, with a CAGR of 3.93% from 2027 to 2032.
How do contactless payments support credit-card use?
Singapore enabled eligible American Express cards for public transport fares from May 15, 2025, adding a routine payment use case.
Which spending application leads credit-card demand?
Food and groceries held the largest application share at 35.18% in 2026.
Which companies are prominent in credit-card competition?
Wells Fargo & Co., JPMorgan Chase, Citigroup, American Express and Bank of America are prominent card businesses.
What constraint affects credit-card issuer economics?
Australia lowered its domestic personal credit-card interchange cap from 0.8% to 0.3% effective October 1, 2026, narrowing the fee stream supporting issuer propositions.
Which region leads credit-card activity and which grows fastest?
North America led with a 45.54% share in 2026, and Asia-Pacific is forecast to grow fastest at a CAGR of 4.42% from 2027 to 2032.