Alternative Credit Scoring Market Size and Share
Market Overview
| Study Period | 2020 - 2031 |
|---|---|
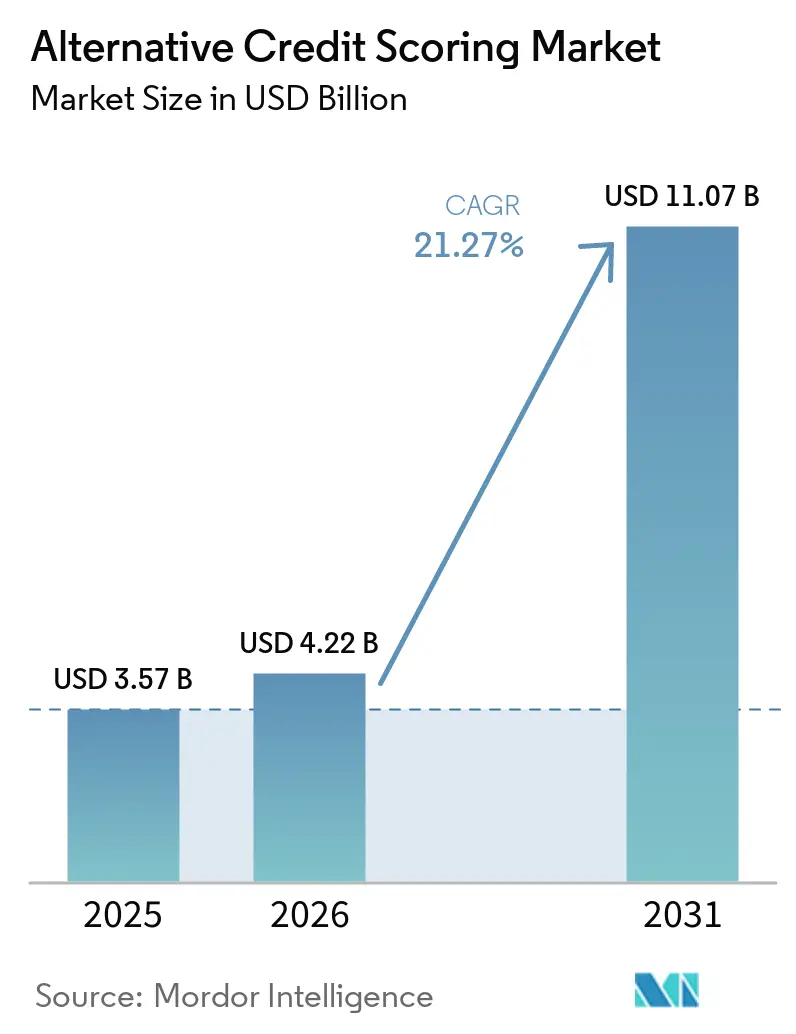
| Market Size (2026) | USD 4.22 Billion |
| Market Size (2031) | USD 11.07 Billion |
| Growth Rate (2026 - 2031) | 21.27% CAGR |
| Fastest Growing Market | Asia-Pacific |
| Largest Market | North America |
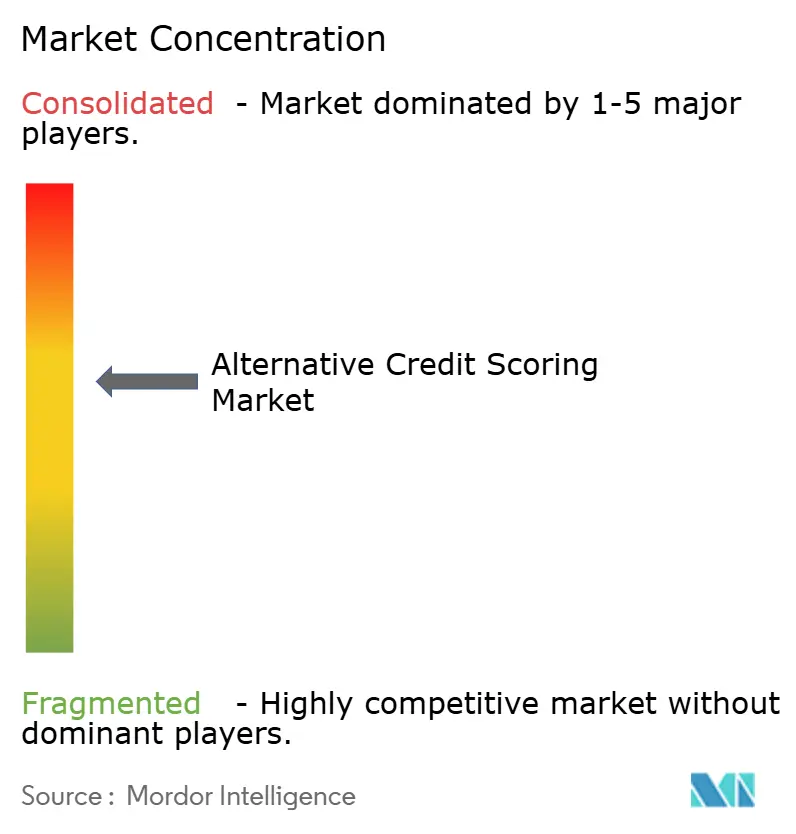
| Market Concentration | Medium |
Major Players *Disclaimer: Major Players sorted in no particular order Image © Mordor Intelligence. Reuse requires attribution under CC BY 4.0. | |
Alternative Credit Scoring Market Analysis by Mordor Intelligence
The Alternative Credit Scoring Market size is expected to grow from USD 3.57 billion in 2025 to USD 4.22 billion in 2026 and is forecast to reach USD 11.07 billion by 2031 at 21.27% CAGR over 2026-2031.
The expansion reflects a clear structural gap in traditional credit infrastructure: 32 million United States adults remain credit-invisible or thin-file. At the same time, 3 billion people globally lack adequate credit histories, and MSMEs face a financing gap of USD 5-7 trillion. This keeps the alternative credit-scoring market tied to real unmet credit demand rather than to discretionary technology spending. Growth is also supported by the broader adoption of consent-based cash flow underwriting, which enables lenders to assess repayment capacity using bank transaction data that is already visible, auditable, and easier to integrate into lending decisions. Embedded lending is expanding the addressable base further by enabling commerce platforms and super-apps to convert first-party behavioral signals into underwriting inputs at the point-of-sale, thereby shifting credit decisioning closer to actual transactions. At the same time, the alternative credit scoring market is being shaped by uneven regulation, ongoing consent friction, and the need to retrain models as consumer behavior changes, which gives an advantage to vendors that build explainability and bias controls directly into scoring systems from the start.
Key Report Takeaways
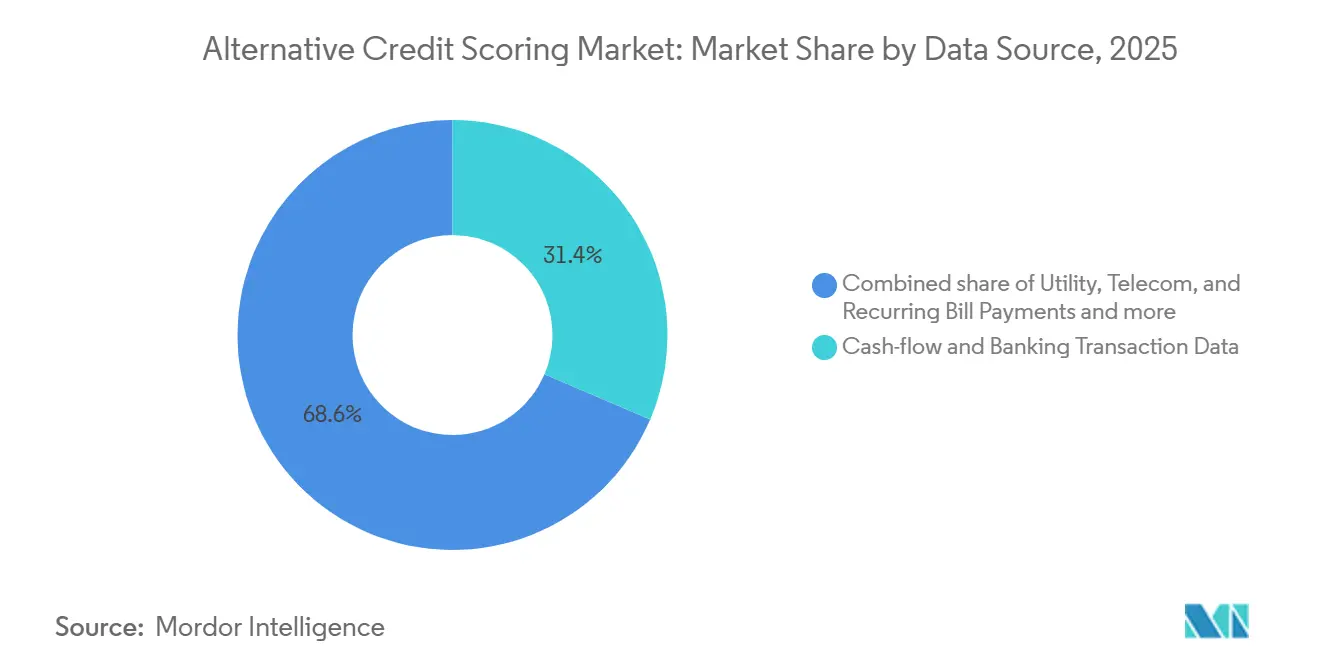
- By data source, cash flow and banking transaction data held 31.42% of the alternative credit scoring market share in 2025, while behavioral, psychometric, and digital footprint data are projected to grow at a 26.78% CAGR through 2031.
- By application, unsecured consumer lending accounted for 37.68% of the alternative credit scoring market share in 2025, while SME/MSME and business lending are forecast to expand at a 25.36% CAGR through 2031.
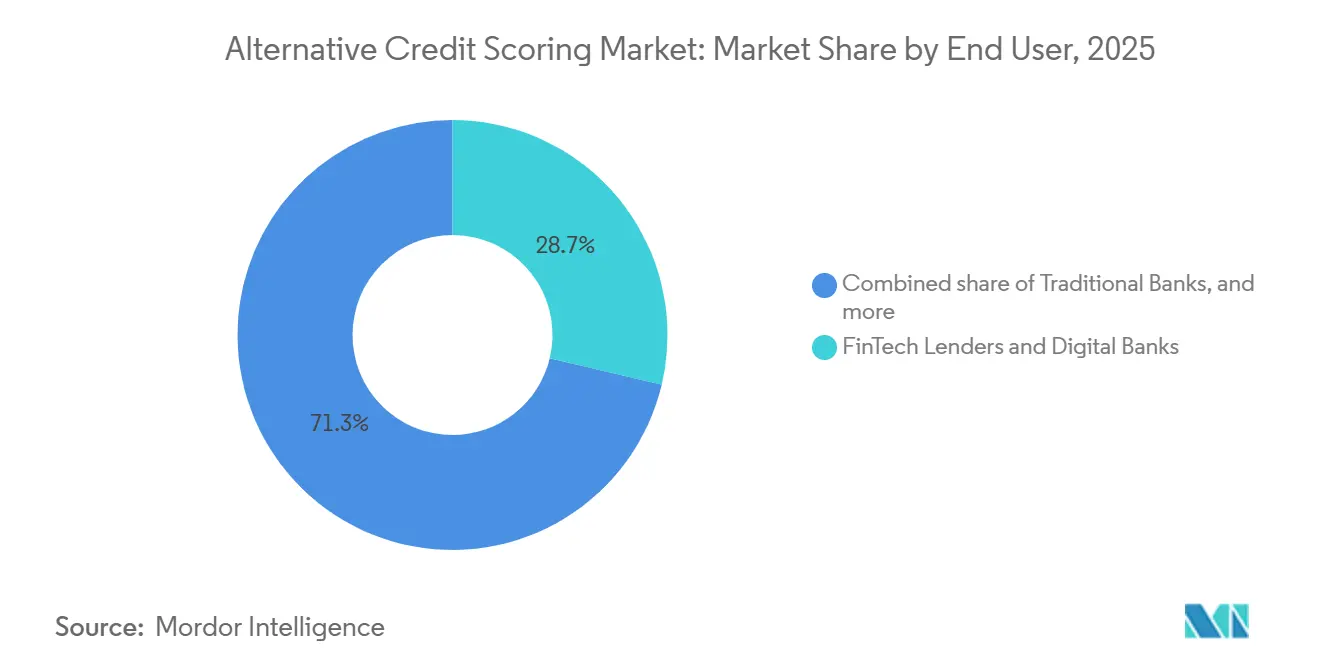
- By end user, FinTech lenders and digital banks held a 28.72% of the alternative credit scoring market share in 2025, while embedded finance and commerce platforms are projected to grow at a 28.02% CAGR through 2031.
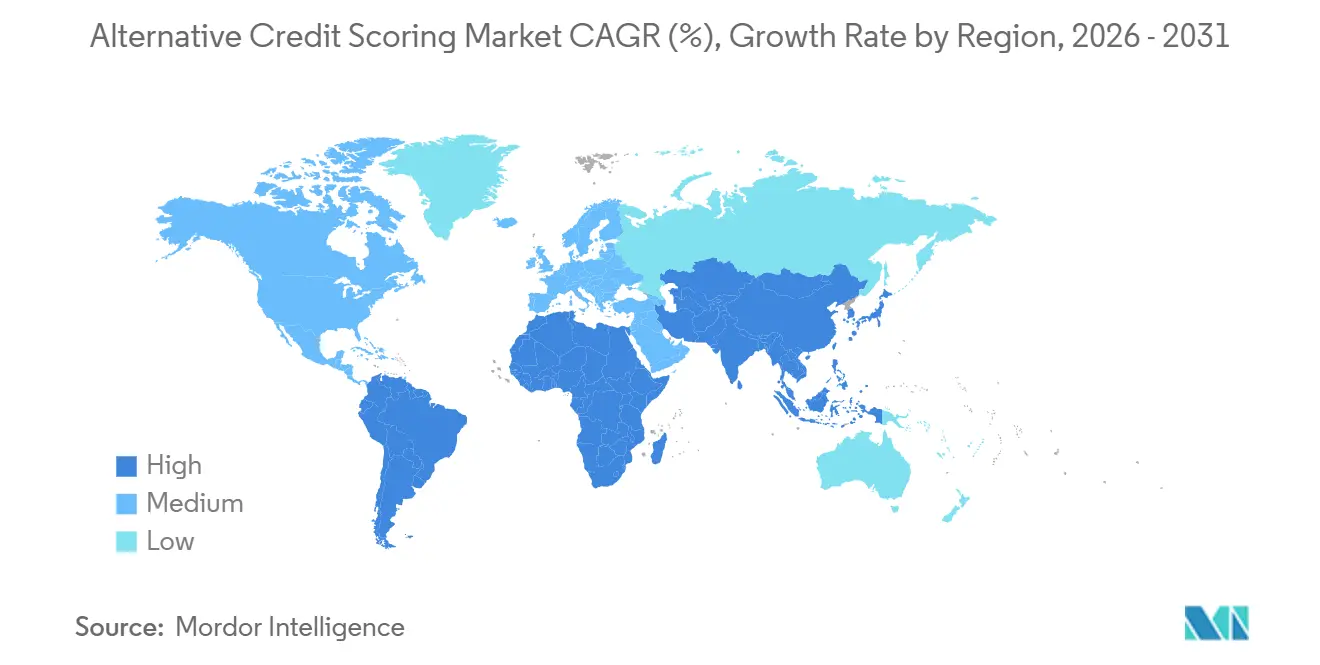
- By geography, North America held a 39.66% of the alternative credit scoring market share in 2025, while Asia-Pacific is projected to grow at a 25.83% CAGR through 2031.
Note: Market size and forecast figures in this report are generated using Mordor Intelligence’s proprietary estimation framework, updated with the latest available data and insights as of January 2026.
Global Alternative Credit Scoring Market Trends and Insights
Drivers Impact Analysis*
| Driver | (~) % Impact on CAGR Forecast | Geographic Relevance | Impact Timeline |
|---|---|---|---|
| Rising Thin-File and Credit-Invisible Borrowers | +4.5% | Global, concentrated in Asia-Pacific, Sub-Saharan Africa, Latin America | Long term (≥ 4 years) |
| Shift Toward Consent-Based Cash Flow Underwriting | +5.0% | North America (near-term), the EU, and Asia-Pacific expanding | Short term (≤ 2 years) |
| Embedded Lending Expansion Across Digital Platforms | +3.8% | Global, accelerated in Asia-Pacific and North America | Medium term (2-4 years) |
| Regulated Demand for Explainable AI in Credit Decisions | +2.4% | EU, North America, spill-over to Asia-Pacific, and Middle East and Africa | Medium term (2-4 years) |
| Open Banking Data Permissioning Improving Score Quality | +2.8% | EU, United Kingdom, Brazil, Australia, India, and growing in North America | Medium term (2-4 years) |
| Cross-Border Credit Portability for Migrants and SMEs | +1.4% | North America and the EU, with early adoption in Southeast Asia and the GCC | Long term (≥ 4 years) |
| Source: Mordor Intelligence | |||
Rising Thin-File and Credit Invisible Borrowers
The Federal Reserve estimated in October 2025 that 32 million United States adults remained either credit invisible or unscored, including 7 million with no credit bureau record and 25 million thin-file consumers with insufficient history for a score[1]FEDERALRESERVE.GOV The Fed - Consumer & Community Context - October 2025. The thin-file group is materially larger than the fully invisible population, which makes it a more meaningful commercial opportunity for lenders using non-bureau data. The IFC reported in May 2026 that 3 billion people globally lacked adequate credit histories and that the MSME financing gap ranged from USD 5 trillion to USD 7 trillion, including USD 1.9 trillion for women-led enterprises. India is moving this issue into policy execution through the Grameen Credit Score framework. At the same time, Credit Information Companies have also sought approval to include utility bill payments to deepen rural coverage. This supports the alternative credit scoring market because many thin-file consumers are already generating dense digital payment trails through wallets, bills, and informal commerce, even when bureau files remain limited.
Shift Toward Consent-Based Cash Flow Underwriting
The CFPB finalized personal financial data rights rules under Section 1033 in October 2024, requiring large United States financial institutions to make consumer-permissioned financial data available through standardized APIs by April 2026. Experian then launched Credit + Cashflow Score in November 2025 and reported predictive accuracy gains of more than 40% versus conventional models across personal loans, bankcards, lines of credit, and mortgages[2]Experian, “Experian Announces First Combined Credit, Cash Flow and Alternative Data Score,” BusinessWire, businesswire.com. PayPal’s selection of Nova Credit’s Cash Atlas platform in September 2025 showed that large payment companies are already using transaction-based underwriting to reach thin-file consumers through direct customer relationships. FICO also partnered with Plaid in November 2025 to deliver the next-generation UltraFICO Score via real-time cash flow connectivity, reducing adoption friction in existing lender workflows. The practical effect is that real-time data aggregators are moving upward in the lending stack. That shift is becoming a major growth engine for the alternative credit scoring market.
Embedded Lending Expansion Across Digital Platforms
Embedded credit embeds loan decisions within non-financial platforms, narrowing the gap between observed customer behavior and credit assessment. Grab Finance rolled out 22 decision workflows across 6 Southeast Asian countries in under 8 months, lifting credit offer eligibility by nearly 50%, demonstrating how in-app commerce and payments data can expand approval pools at scale. Zest AI also reported tripled growth in GenAI and fraud solution adoption in Q1 2026, with deeper integrations across MeridianLink, Fiserv, Origence, and Sync1 Systems, showing that production AI underwriting is spreading beyond pilot programs. In May 2026, Pagaya partnered with Sezzle to embed AI underwriting at the point-of-sale through WebBank, while relying on a network trained on data from more than USD 1 trillion in annual loan applications[3]Pagaya Technologies, “Pagaya Announces New Affiliate Partnership With Experian,” Pagaya Investor Relations, investor.pagaya.com. As a result, the alternative credit scoring market is increasingly influenced by platform operators that own first-party transaction data and do not need to depend on bureau files or standalone scoring vendors.
Regulated Demand for Explainable AI in Credit Decisions
Regulation EU 2024/1689 places AI credit scoring systems in a high-risk category, which raises documentation, monitoring, and deployment obligations for vendors and lenders operating in EU markets. Germany’s SCHUFA responded to court and regulatory pressure by launching a new 2026 scoring model that uses 12 data factors and centers explainability, transparency, influenceability, and fairness in the design[4]LEGAL.PWC.DE The 2026 SCHUFA score reforms and implications for financial services firms - PwC Legal. In the United Kingdom, the Data (Use and Access) Act 2025 established a different automated decision-making framework from the EU position, adding operational complexity for lenders operating across both markets. In practice, lenders using complex models still need clear adverse action explanations, which keeps pressure on model governance even when predictive accuracy improves. This is pushing the alternative credit scoring market toward vendors that embed explainability and auditability into the core architecture rather than treating them as an added compliance layer.
Restraints Impact Analysis*
| Restraint | (~) % Impact on CAGR Forecast | Geographic Relevance | Impact Timeline |
|---|---|---|---|
| Consent Fatigue and Data Permission Drop Off | -1.4% | Global, most acute in Asia-Pacific and the EU | Short term (≤ 2 years) |
| Adverse Action and Explainability Burden on Lenders | -1.1% | EU, North America, spill-over to Asia-Pacific | Medium term (2-4 years) |
| Fragmented Data Rights and Storage Rules by Country | -0.9% | Middle East and Africa, Asia-Pacific, Latin America | Long term (≥ 4 years) |
| Model Drift from Rapidly Changing Consumer Behavior Signals | -0.8% | Global | Medium term (2-4 years) |
| Source: Mordor Intelligence | |||
Consent Fatigue and Data Permission Drop Off
Repeated requests for access to banking, behavioral, and utility data do not scale smoothly with lender demand, especially among lower-income users with weaker digital literacy. This matters because the same borrowers are often the core target group for alternative credit models. The IFC noted that women in some markets rely on shared devices or operate under weak data protection settings, which means standard consent flows can exclude people who are already underserved. In India, the Digital Personal Data Protection Act will introduce enhanced consent management, data rights, and breach notification obligations from May 2027, raising operational requirements for lenders using app-based behavioral data. The result is a self-reinforcing risk for the alternative credit scoring market because lower consent rates can leave models trained on the most digitally engaged borrowers rather than the broader thin-file population.
Adverse Action and Explainability Burden on Lenders
AI-based scoring creates compliance costs that rise with model complexity and with the number of jurisdictions a lender serves. Under Article 72 of the EU AI Act, major updates to high-risk systems can trigger a reassessment, limiting how quickly models can be retrained on new behavioral signals. The United Kingdom’s revised automated decision-making framework under the Data (Use and Access) Act 2025 adds another layer of uncertainty for lenders seeking to use a single scoring architecture across both the United Kingdom and the EU markets. For mid-sized institutions, explainability tools can approach the cost of the scoring stack itself, which can shift procurement toward simpler models with lower incremental lift. This slows deployment in the alternative credit scoring market, even when demand for better risk assessment remains strong.
*Our forecasts treat driver/restraint impacts as directional, not additive. The impact forecasts reflect baseline growth, mix effects, and variable interactions.
Segment Analysis
By Data Source: Cash Flow Leads, Behavioral Signals Set the Pace
Cash flow and banking transaction data accounted for 31.42% share of the market in 2025, making it the largest data source in the alternative credit scoring market. Lenders favor this data because overdraft activity, account tenure, and balance trends map closely to familiar credit concepts such as repayment consistency, file age, and income stability. Plaid’s 2025 launch of Lendscore (LS1) demonstrated the strength of this approach by combining cash flow attributes with network-level signals and delivering up to 25% better predictive performance than traditional scores alone. Utility, telecom, and recurring bill payment data continue to hold a steady supporting role, especially in Sub-Saharan Africa and South Asia, where bank account access still trails mobile and utility usage.
Rental and housing-related data are also gaining a clearer place in the alternative credit scoring industry because FHFA approved VantageScore 4.0 for GSE-backed mortgage originations in 2025, and that model incorporates rental payment history. Behavioral, psychometric, and digital footprint data are the fastest-growing sources, with a projected 26.78% CAGR from 2026 to 2031, and vendors such as CredoLab and LenddoEFL turning device metadata, app activity, and geolocation patterns into score-ready signals. That expansion is moving faster than regulation in many countries, which keeps compliance questions open even as commercial adoption rises. E-commerce and digital commerce data are scaling especially fast in APAC, where Naver SmartStore transaction signals in South Korea and Grab merchant payment data in Southeast Asia are helping lenders move away from bureau-dependent models.


By Application: Unsecured Consumer Lending Anchors Revenue, SME Finance Accelerates
Unsecured consumer lending accounted for 37.68% of the alternative credit scoring market in 2025, maintaining its leading position. The segment benefits from frequent origination, short decision windows, and a high overlap between thin-file consumers and first-time personal loan demand. Upstart’s Q1 2026 results showed 61% year-over-year origination growth and revenue of USD 308 million, above the USD 303.4 million consensus estimate, suggesting commercial-scale prime and near-prime consumer lending rather than narrow inclusion use cases alone. Mortgage and secured housing finance are also moving forward, as VantageScore 4.0 gained FHFA approval and can score 33 million more United States adults than legacy FICO models, while Equifax and TransUnion are pushing adoption with lower mortgage score pricing.
SME/MSME and business lending is the fastest-growing application, with a 25.36% CAGR from 2026 to 2031, supported by evidence that transactional business data can predict creditworthiness as effectively as traditional credit history in many contexts. The World Bank also identified marketplace lenders, e-commerce platforms, and supply chain finance providers as leading institutional models using this approach. Fraud detection, identity verification, and related risk analytics are expanding as lenders add real-time behavioral authentication to digital origination flows. Rental and tenant screening remains small, but it is gaining structural relevance as property platforms increasingly rely on cash flow and payment history data to screen out applicants that standard credit checks would otherwise approve.
By End User: FinTech Lenders Lead, Embedded Platforms Set the Growth Pace
FinTech lenders and digital banks held a 28.72% share in 2025, which made them the largest end-user group in the alternative credit scoring market. Their lead comes from API-first technology stacks, native data infrastructure, and years of training data built from launch rather than added later through system integration. KakaoBank is a strong example because, from January 2023 to September 2025, its proprietary score enabled it to originate KRW 990 billion (USD 717 million) in additional medium-to-low credit loans that traditional bureau models had declined. In Q1 2026, KakaoBank supplied KRW 450 billion (USD 324 million) through that model, and medium-to-low credit loans accounted for 45.6% of new originations, against the bank’s 30% target.
Embedded finance and commerce platforms are the fastest-growing end-user category at 28.02% CAGR from 2026 to 2031, because BNPL providers, super-apps, and marketplaces can turn first-party behavioral data into instant underwriting at checkout. Traditional banks are responding through partnerships, including Mastercard’s 2026 Payment Risk Insights launch, which gives institutions FCRA-compliant cash flow risk tiers without requiring full internal model development. Credit bureaus and data aggregators are also moving up the stack, as shown by Experian’s June 2026 launch of an agentic AI operating system on Ascend for end-to-end credit workflows. In India, Southeast Asia, and Latin America, NBFCs and specialty finance providers are using psychometric and digital footprint-based screening earlier than banks because non-bank lenders often face lower operational barriers during rollout.
Geography Analysis
North America held 39.66% of the alternative credit scoring market share in 2025, maintaining its position as the largest regional base. The region benefits from a mature venture ecosystem, deep AI-native lending infrastructure, and the policy push behind consumer-permissioned data-sharing under Section 1033. FHFA’s approval of VantageScore 4.0 for GSE mortgage originations, together with Equifax and TransUnion's pricing moves below FICO’s 2026 mortgage score level, is widening the use of alternative data in the USD 13 trillion United States residential mortgage market. TransUnion’s majority acquisition of Buró de Crédito in Mexico and Upstart’s move toward direct institutional status show that the region is still extending both data reach and lending capacity.
Asia-Pacific is projected to grow at 25.83% CAGR from 2026 to 2031, making it the fastest-growing region in the alternative credit scoring market. Growth reflects government-directed scoring mandates, mobile-first finance ecosystems, and super-app data layers that lack a close Western equivalent. South Korea’s Financial Services Commission is developing a small-business scoring model that uses Naver SmartStore transaction data and Naver Place local business ratings, shifting early-stage business lending away from simple income checks toward growth potential. KakaoBank also extended its model to more than 70 financial institutions through a June 2025 partnership with NICE Credit Information, which turned a digital bank score into shared lending infrastructure. In India, Experian launched the Grameen Score in November 2025, while Credit Information Companies sought RBI approval to add utility bill data. In China, the State Council issued a 2026 implementation plan for a comprehensive enterprise credit evaluation system tied to SME finance and wider data mobilization goals.
Europe is advancing through PSD2-linked open banking adoption and the broader impact of Germany’s 2026 SCHUFA reforms, while the United Kingdom now operates under a diverging post-GDPR automated decision-making framework. South America, especially Brazil, is moving through Open Finance, Pix Automático, and credit portability, which improve the depth of real-time transaction data available for thin-file SME assessment. In the Middle East and Africa, Nova Credit’s CRC Nigeria partnership addresses cross-border credit portability for Nigerians moving to the US, while Kenya and South Africa are seeing the early formation of structured alternatives built on behavioral and embedded lending models. Together, these patterns keep the alternative credit scoring market geographically uneven, but they also show that regions with weaker bureau coverage can move faster once policy and digital transaction rails are aligned.

Competitive Landscape
The alternative credit scoring market is moderately concentrated. It is divided among three main groups: incumbent bureaus such as Experian, Equifax, and TransUnion; AI-native underwriting platforms such as Upstart, Zest AI, and Pagaya; and specialist players such as Nova Credit, CredoLab, LenddoEFL, and Trusting Social. Incumbent bureaus maintain strong advantages in data scale, regulatory familiarity, and enterprise distribution, making them challenging to displace in highly regulated lending environments. Meanwhile, AI-native firms compete on approval lift, model speed, and integration depth. In contrast, specialist firms excel in narrower, underserved use cases such as cross-border files, behavioral scoring, and thin-file onboarding. This structure allows the alternative credit scoring market to remain open enough for new models to gain share, but not open enough for smaller firms to scale without partnerships.
Large incumbents are strengthening their position through acquisitions and workflow expansion rather than relying only on the score itself. Experian’s February 2026 acquisition of Own Up extends its reach into mortgage shopping and secured housing finance, while TransUnion’s completed 2025 acquisitions of Monevo in the United Kingdom and a majority stake in Buró de Crédito in Mexico expand borrower access points and geographic data coverage. Experian then launched an agentic AI Agent Operating System on Ascend in June 2026, with ServiceNow as the first integration partner, pushing its role beyond score delivery into process automation. Pagaya is also narrowing the line between challenger and incumbent through distribution alliances, including its May 2026 affiliate partnership with Experian Marketplace. The company’s network, trained on data from more than USD 1 trillion in annual loan applications and supported by over USD 34.5 billion in asset-backed securities issuance since inception, gives it a scale that many independent model vendors cannot match.
White-space remains strongest in cross-border credit portability and in MSME scoring across markets where bureau infrastructure is still limited. Nova Credit is the clearest scaled player in cross-border portability, having raised USD 35 million in Series D funding in October 2025 and built platform partnerships with PayPal, HSBC, SoFi, and Scotiabank. The World Bank has also emphasized that cross-sector data sharing among telecom operators, utilities, e-commerce platforms, and lenders produces more predictive models than single-source approaches, favoring firms that can build ecosystems rather than just collect proprietary data. From 2027 onward, the alternative credit scoring market is likely to see more consolidation among mid-tier vendors, as training scale, compliance costs, and distribution partnerships become harder to separate.
Alternative Credit Scoring Industry Leaders
Experian plc
TransUnion
Equifax, Inc.
Fair Isaac Corporation
Upstart Network, Inc.
- *Disclaimer: Major Players sorted in no particular order

Recent Industry Developments
- June 2026: Experian launched an agentic AI Agent Operating System on its Ascend Platform, with ServiceNow as the first integration partner, enabling autonomous AI agents to execute end-to-end credit decisioning workflows across partner financial institutions at scale. The system is positioned for early-adopter access in 2026 with broader rollout to follow.
- May 2026: Pagaya Technologies and Experian announced a strategic affiliate partnership embedding Pagaya's AI underwriting, backed by data from over USD 1 trillion in annual loan applications, within Experian Marketplace, extending automated real-time underwriting to personal loan applicants across the credit spectrum.
- May 2026: Pagaya partnered with Sezzle to embed AI underwriting at the point-of-sale through WebBank, enabling merchants to offer installment loans with higher approval rates and basket sizes without adding consumer friction.
- February 2026: Experian announced a definitive agreement to acquire Own Up, an AI-powered mortgage shopping platform, to extend alternative data scoring capabilities into secured housing finance through the Experian Marketplace. The acquisition is expected to close within 90 days after regulatory approvals.


Global Alternative Credit Scoring Market Report Scope
| Cash-flow and Banking Transaction Data |
| Utility, Telecom, and Recurring Bill Payments |
| Rental, Housing, and Property-Related Data |
| E-commerce, Digital Commerce, and Payment Platform Data |
| Behavioral, Psychometric, and Digital Footprint Data |
| Public Records, Employment, Income Verification, and Other Alternative Sources |
| Unsecured Consumer Lending |
| Mortgage and Secured Housing Finance |
| SME / MSME and Business Lending |
| Rental and Tenant Screening |
| Fraud Detection, Identity Verification, and Broader Risk Analytics |
| Other Applications |
| Traditional Banks |
| FinTech Lenders and Digital Banks |
| Credit Unions and Community Lenders |
| NBFCs and Specialty Finance Companies |
| Embedded Finance and Commerce Platforms |
| Credit Bureaus and Data Aggregators |
| North America | United States |
| Canada | |
| Mexico | |
| South America | Brazil |
| Argentina | |
| Chile | |
| Peru | |
| Rest of South America | |
| Europe | United Kingdom |
| Germany | |
| France | |
| Italy | |
| Spain | |
| BENELUX (Belgium, Netherlands, and Luxembourg) | |
| NORDICS (Denmark, Finland, Iceland, Norway, and Sweden) | |
| Rest of Europe | |
| Asia-Pacific | India |
| China | |
| Japan | |
| Australia | |
| South Korea | |
| South East Asia (Singapore, Malaysia, Thailand, Indonesia, Vietnam, and Philippines) | |
| Rest of Asia-Pacific | |
| Middle East and Africa | United Arab Emirates |
| Saudi Arabia | |
| South Africa | |
| Nigeria | |
| Rest of Middle East and Africa |
| By Data Source | Cash-flow and Banking Transaction Data | |
| Utility, Telecom, and Recurring Bill Payments | ||
| Rental, Housing, and Property-Related Data | ||
| E-commerce, Digital Commerce, and Payment Platform Data | ||
| Behavioral, Psychometric, and Digital Footprint Data | ||
| Public Records, Employment, Income Verification, and Other Alternative Sources | ||
| By Application | Unsecured Consumer Lending | |
| Mortgage and Secured Housing Finance | ||
| SME / MSME and Business Lending | ||
| Rental and Tenant Screening | ||
| Fraud Detection, Identity Verification, and Broader Risk Analytics | ||
| Other Applications | ||
| By End User | Traditional Banks | |
| FinTech Lenders and Digital Banks | ||
| Credit Unions and Community Lenders | ||
| NBFCs and Specialty Finance Companies | ||
| Embedded Finance and Commerce Platforms | ||
| Credit Bureaus and Data Aggregators | ||
| By Geography | North America | United States |
| Canada | ||
| Mexico | ||
| South America | Brazil | |
| Argentina | ||
| Chile | ||
| Peru | ||
| Rest of South America | ||
| Europe | United Kingdom | |
| Germany | ||
| France | ||
| Italy | ||
| Spain | ||
| BENELUX (Belgium, Netherlands, and Luxembourg) | ||
| NORDICS (Denmark, Finland, Iceland, Norway, and Sweden) | ||
| Rest of Europe | ||
| Asia-Pacific | India | |
| China | ||
| Japan | ||
| Australia | ||
| South Korea | ||
| South East Asia (Singapore, Malaysia, Thailand, Indonesia, Vietnam, and Philippines) | ||
| Rest of Asia-Pacific | ||
| Middle East and Africa | United Arab Emirates | |
| Saudi Arabia | ||
| South Africa | ||
| Nigeria | ||
| Rest of Middle East and Africa | ||


Key Questions Answered in the Report
What is driving growth in alternative credit scoring through 2031?
Growth is being driven by the large number of thin-file and credit invisible borrowers, wider use of consent-based cash flow underwriting, and embedded lending models that use first-party transaction data. The market is projected to reach USD 11.07 billion by 2031 at a 21.3% CAGR.
Why are cash flow and banking transaction data leading adoption?
Cash flow and banking transaction data held 31.42% share in 2025 because lenders can link account balances, overdrafts, and transaction patterns to repayment ability using data that is easier to audit and explain than many non-financial signals.
Which application area is expanding the fastest?
SME/MSME and business lending is the fastest-growing application with a projected 25.36% CAGR from 2026 to 2031, supported by rising use of e-commerce, payments, and transaction data to assess businesses that lack formal financial records.
Which end users are shaping deployment the most?
FinTech lenders and digital banks led with 28.72% share in 2025 because they built API-first systems and alternative data models from inception. Embedded finance and commerce platforms are growing the fastest at 28.02% CAGR.
Why is Asia-Pacific growing faster than North America and Europe?
Asia-Pacific is projected to grow at 25.83% CAGR because it combines policy-backed scoring initiatives, mobile-first financial behavior, and super-app ecosystems that generate dense transaction data for underwriting.
What is the biggest risk for lenders using alternative models?
The main risks are regulatory asymmetry, consent fatigue, and model drift. Lenders operating across several markets face different explainability, retraining, and data permission requirements, which can slow rollout and increase compliance costs.
Page last updated on:


