
United States Private Banking Market Size and Share
Market Overview
| Study Period | 2020 - 2031 |
|---|---|
| Forecast Data Period | 2026 - 2031 |
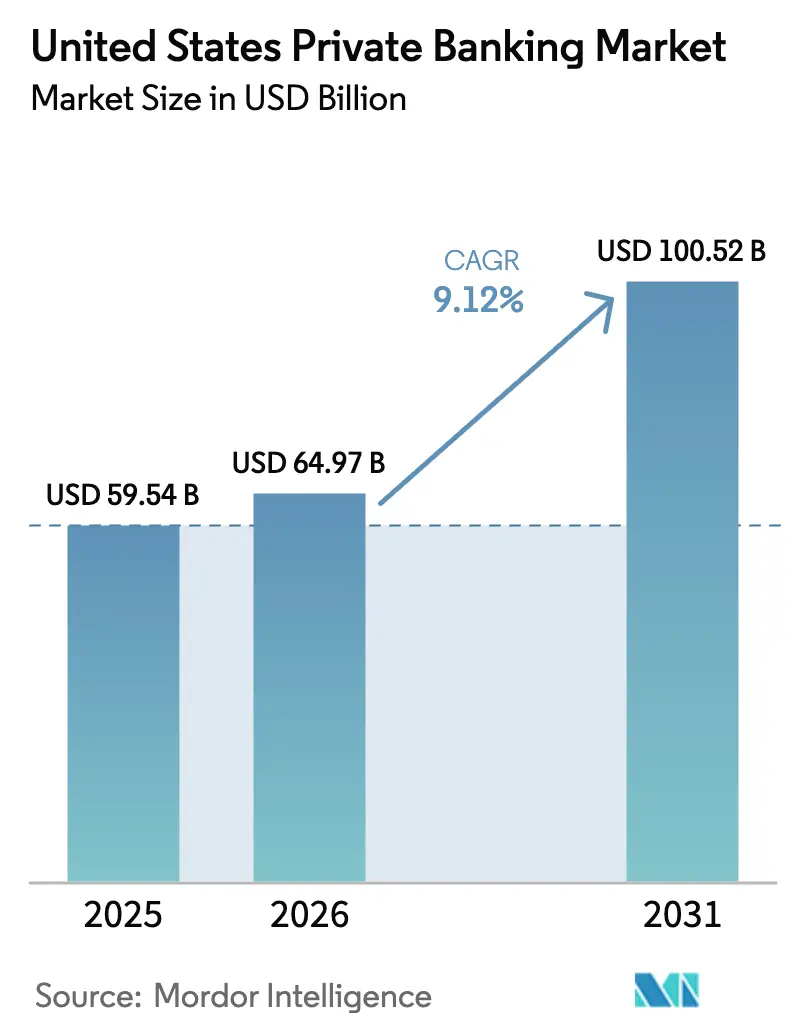
| Base Year Market Size (2025) | USD 59.54 Billion |
| Market Size (2026) | USD 64.97 Billion |
| Market Size (2031) | USD 100.52 Billion |
| Growth Rate (2026 - 2031) | 9.12 % |
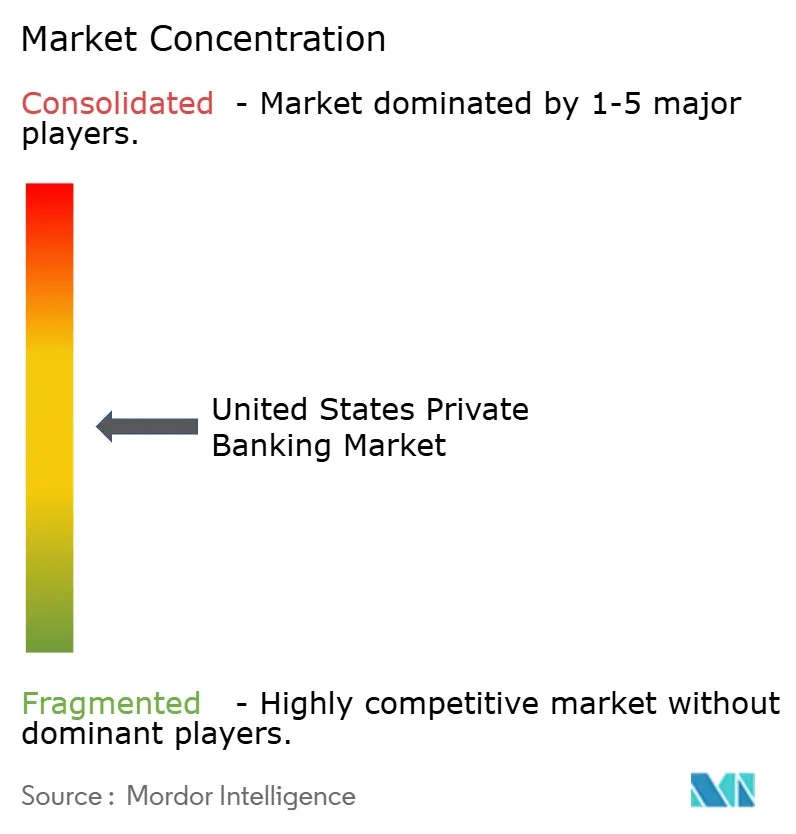
| Market Concentration | Medium |
Major Players *Disclaimer: Major Players sorted in no particular order Image © Mordor Intelligence. Reuse requires attribution under CC BY 4.0. | |
United States Private Banking Market Analysis by Mordor Intelligence
The United States private banking market size is expected to grow from USD 59.54 billion in 2025 to USD 64.97 billion in 2026 and is forecast to reach USD 100.52 billion by 2031 at 9.12% CAGR over 2026-2031. Expansion is fueled by robust demographic wealth creation, the rollout of SECURE Act 2.0 rollover incentives that convert retirement savers into fee-based advisory relationships, and rapid digitization that blends high-touch advice with AI-enabled scale. Client appetite for alternative assets, especially private credit and direct real-estate exposure, is lifting fee pools as private banks integrate specialized product desks within core advisory platforms. Meanwhile, wealth migration toward tax-advantaged states and technology hubs is reshaping regional competitive dynamics, prompting banks to expand branch footprints while doubling down on digital service delivery. Regulatory demands under Reg BI and heightened cybersecurity standards are raising fixed costs, giving scale-advantaged incumbents room to widen operational moats while forcing niche providers to differentiate through family-office style services and localized expertise.
Key Report Takeaways
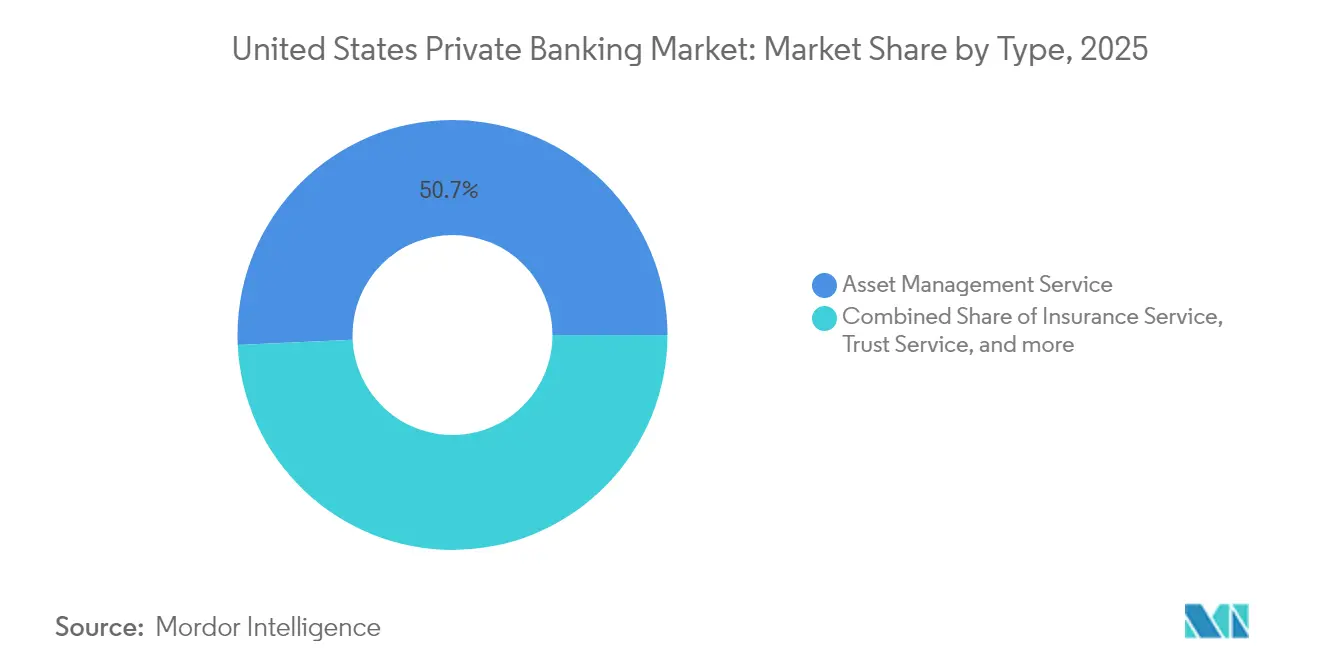
- By service type, asset management held 50.74% of the United States private banking market share in 2025, while real-estate consulting is forecast to grow at an 7.94% CAGR to 2031.
- By application, personal banking commanded 72.15% of the United States private banking market size in 2025, whereas enterprise services are advancing at a 7.28% CAGR through 2031.
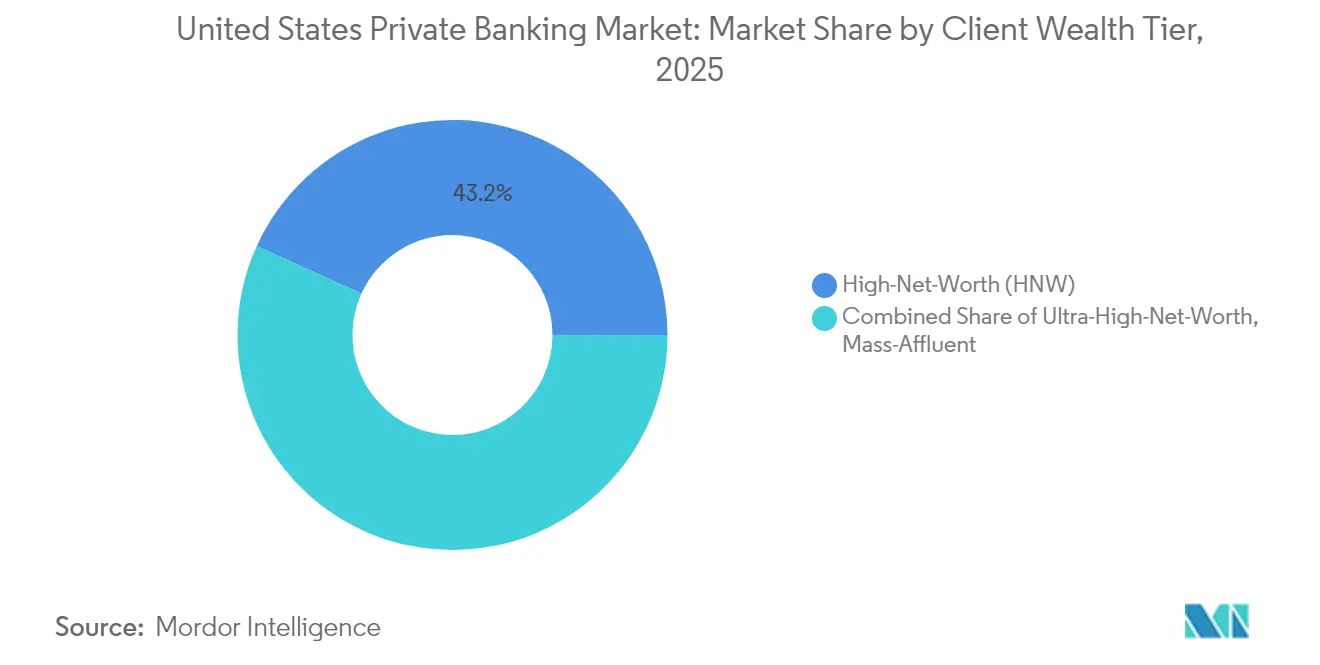
- By client wealth tier, high-net-worth clients accounted for 43.21% of the United States private banking market size in 2025; the ultra-high-net-worth segment is expanding at a 9.39% CAGR over 2026-2031.
- By geography, the Northeast led with 35.12% of the United States private banking market share in 2025, while the West is expected to record the fastest 6.74% CAGR to 2031.
Note: Market size and forecast figures in this report are generated using Mordor Intelligence’s proprietary estimation framework, updated with the latest available data and insights as of 2026.
United States Private Banking Market Trends and Insights
Drivers Impact Analysis*
| Driver | (~) % Impact on CAGR Forecast | Geographic Relevance | Impact Timeline |
|---|---|---|---|
| Rising HNW population & investable assets | +2.8% | Global, concentrated in Northeast, West, South | Long term (≥ 4 years) |
| Heightened demand for holistic planning & family-office style services | +2.1% | National, strongest in Northeast and West | Medium term (2-4 years) |
| Digital-first & hybrid advisory adoption surge | +1.9% | National, led by West Coast innovation hubs | Short term (≤ 2 years) |
| Appetite for alternative / private-market products | +1.6% | National, UHNW concentrated in Northeast, West | Medium term (2-4 years) |
| Banks' private-credit distribution partnerships expand fee pools | +0.8% | National, strongest in financial centers | Medium term (2-4 years) |
| SECURE Act 2.0 rollover incentives convert retirement savers to advice relationships | +0.5% | National, concentrated in high-income regions | Short term (≤ 2 years) |
| Source: Mordor Intelligence | |||
Rising HNW and UHNW Population
The United States counts more than 23 million millionaires in 2025, up 7% from 2024 as continued equity and property appreciation accelerates capital formation among entrepreneurs and technology founders[2]Source: UBS, “Family Office Report 2025,” ubs.com. UHNW households average USD 2.7 billion in net worth, fueling demand for concierge-level services such as direct investment sourcing, philanthropic structuring, and multi-jurisdictional estate planning. Inbound wealth programs—most notably the EB-5 investor visa—keep channeling foreign capital into U.S. private banking pipelines, solidifying the client base in coastal wealth centers. Private banks with proven cross-border tax expertise and family-office infrastructure are capturing outsized wallet share as new UHNW entrants seek institutional-grade governance. The demographic tailwind remains pronounced through 2030 as generational wealth transfer picks up pace, ensuring a steady inflow of assets under management.
Heightened Demand for Holistic Planning and Family-Office Style Services
A 2025 industry survey shows 91% of affluent clients want integrated tax, estate, and philanthropic advice, yet fewer than 25% report receiving it today[3]Source: Bank of America, “Specialty Asset Management,” bankofamerica.com. The gap is driving banks to add trust attorneys, in-house CPAs, and real-estate consultants who can bundle traditionally siloed services into a single relationship. Family-office assets under administration in North America are on track to rise from USD 3.1 trillion in 2024 to nearly USD 5.4 trillion by 2030, highlighting the white-space opportunity for institutions that can scale boutique-level attention without eroding margins. Younger wealth holders emphasize ESG screening and impact investing, prompting banks to embed sustainability analytics into proposal tools and manager research workflows. The demand for holistic stewardship also expands annuity-like fee revenue, improving earnings visibility amid cyclical market swings.
Digital-First and Hybrid Advisory Adoption
Generative AI reached mainstream deployment in January 2025 when Goldman Sachs rolled out an assistant that drafts research summaries, crafts client emails, and automates trade recommendations[4]Source: Goldman Sachs, “AI Assistant Deployment,” goldmansachs.com.. Large banks are following suit, combining machine-generated insights with human oversight to deliver personalized portfolios at scale. Hybrid models that pair virtual onboarding with periodic in-person strategy reviews reduce servicing costs by up to 35% while preserving the trust component crucial for high-value relationships. Clients now expect seamless omni-channel access—mobile messaging, secure document vaults, and video consultations—driving platform modernization roadmaps across the sector. Institutions lacking modern tech stacks risk share erosion as digitally native competitors woo mass-affluent customers with lower fees and frictionless interfaces. Still, early adopters note rising compliance and data-governance spend, reinforcing the advantage held by balance-sheet strong incumbents.
Persistently low yields on traditional fixed income portfolios have pivoted wealth flows toward private credit, secondary PE funds, and real-estate syndications. U.S. Bank grew its private-credit platform 40% year over year in 2025 through distribution pacts that slice institutional-grade funds into USD 250,000 minimums for qualified buyers. Larger players such as Bank of America now oversee more than USD 13 billion in specialty assets, a metric that includes timberland, farmland, and mineral rights. Direct property services are gaining steam: clients request market-level due-diligence, lease-up monitoring, and 1031-exchange execution, pushing real-estate consulting to the fastest CAGR across service lines. For banks, alternatives bolster fee spreads and deepen stickiness but escalate due-diligence burdens, favoring institutions with robust manager-selection frameworks and conflict-mitigation protocols.
Restraints Impact Analysis*
| Restraint | (~) % Impact on CAGR Forecast | Geographic Relevance | Impact Timeline |
|---|---|---|---|
| Fee compression from robo-advice and passive products | -1.4% | Nationwide, acute in mass-affluent | Short term (≤ 2 years) |
| Intensifying regulatory scrutiny | -0.9% | Major financial centers | Medium term (2-4 years) |
| Advisor talent war inflates compensation & churn risk | -1.1% | Major urban wealth centers | Medium term (2–4 years) |
| Escalating cyber-security / data-leak compliance costs | -0.8% | Nationwide, with cross-border implications | Short term (≤ 2 years) |
| Source: Mordor Intelligence | |||
Fee Compression from Robo-Advice and Passive Products
Assets managed by automated platforms topped USD 1 trillion in 2025, with Vanguard alone controlling USD 312 billion in digital advice mandates. As passive ETFs proliferate at sub-10 basis-point fees, price sensitivity bleeds into human-advised relationships, especially for portfolios under USD 1 million. Banks answer by embedding robo-allocation modules within full-service mandates, offering tiered pricing that preserves margin while signaling value transparency. Some early entrants have shuttered standalone robo tools after discovering thin economics, underscoring that trust-based counsel rather than price leadership remains the primary retention lever for high-balance households. Nonetheless, the secular fee-compression trend forces continuous efficiency upgrades, including straight-through account opening and AI-driven compliance checks, to keep cost-to-income ratios in check.
Intensifying Regulatory Scrutiny
Reg BI examinations now emphasize granular fee disclosures, product suitability, and dual-registrant conflict mitigation, pushing compliance budgets 8% higher in 2025 versus 2024. Department of Labor rules governing rollover advice add another oversight layer, directly affecting the SECURE Act 2.0 conversion pipelines that many banks target for growth. Simultaneously, Treasury guidance on AI risk management compels firms to document model governance, bias controls, and incident-response playbooks, raising barriers for smaller competitors. The cumulative regulatory drag squeezes margins and lengthens product-launch timelines, yet strong performers leverage compliance excellence as a trust builder when courting new assets under management.
*Our forecasts treat driver/restraint impacts as directional, not additive. The impact forecasts reflect baseline growth, mix effects, and variable interactions.
Segment Analysis
By Type: Asset Management Anchors Revenue Streams
Asset management accounted for 50.74% of the United States private banking market share in 2025, underscoring its centrality to relationship profitability. Ongoing capital-market volatility increases client reliance on tactical allocation, manager selection, and tax-loss harvesting, reinforcing the fee resilience of discretionary mandates. Real-estate consulting is projected to clock an 7.94% CAGR through 2031, making it the service-line growth engine as clients allocate toward income-producing property, 1031 exchanges, and fractional commercial deals. Trust and tax consulting continue to expand steadily as wealth transfer accelerates and state-level tax policies diverge, prompting affluent households to seek jurisdictional optimization. Insurance, while the smallest category, serves as a gateway into estate liquidity, long-term-care planning, and liability coverage, enriching cross-sell density across the client lifecycle.
Broader platform integration allows banks to migrate clients from single-service entry points into full-suite engagements, lifting average revenue per relationship. Institutions bundle capital-call lines with alternative investment subscriptions, marrying lending income with asset-management fees. Such cross-pollination defends wallet share against mono-line fintech entrants. The trend also feeds capital-efficiency metrics: clients with four or more product lines deliver up to 2.5× higher lifetime value than those limited to custody and trading services. Regulatory complexity across diverse business lines increases operational overhead, but scale economies in technology and compliance largely offset the incremental cost, especially for top-tier banks.



By Application: Personal Banking Dominates but Enterprise Demand Rises
Personal applications represented 72.15% of the United States private banking market size in 2025, reflecting the sector’s heritage of individualized portfolio stewardship. Mass-affluent and HNW investors continue to favor banks that combine personalized advice with mobile account access, biometric security, and curated alternative-investment marketplaces. Enterprise services, growing at a 7.28% CAGR, ride the tailwind of private-company liquidity events, executive stock-option planning, and cash-management mandates for professional partnerships. Banks that unify business and personal dashboards enable real-time snapshots of treasury positions alongside household balance sheets, delivering a differentiated advisory narrative.
Hybrid service architectures minimize friction: a founder may execute payroll through an enterprise portal in the morning and sweep excess cash into a laddered bond strategy by afternoon, all orchestrated via a single relationship manager. Integration also mitigates concentration risk by spreading revenue across corporate lending, FX, and personal-wealth lines. Compliance hurdles persist; advisors must navigate overlapping FINRA, SEC, and state regulations, particularly when recommending securities to closely held corporations. Yet the same complexity dissuades pure-play fintech challengers, allowing full-service banks to sustain premium pricing for bundled value.
By Client Wealth Tier: UHNW Growth Outpaces Other Segments
High-net-worth clients held 43.21% of 2025 assets, anchoring core profitability through diversified mandates that range from lending to philanthropic structuring. The ultra-high-net-worth cohort, though smaller in headcount, posts the fastest 9.39% CAGR as concentrated stock positions from IPOs, SPAC exits, and M&A transactions balloon personal balance sheets. Demand for direct private-equity co-investments, specialty real-estate vehicles, and bespoke derivatives hedging fuels revenue per client far above mass-affluent averages. Family-office service desks—providing CFO-like budget oversight, aircraft leasing advice, and global residency planning—differentiate incumbents amid fierce competition for marquee relationships.
Mass-affluent households remain strategically important as future HNW pipeline. Banks deploy tiered digital offerings with Robo-core portfolios, add-on advisor sessions, and automated tax-optimizing withdrawals to serve this segment profitably. Such scalable modules preserve operating leverage while instilling brand loyalty that eases conversion to full private-bank status as assets compound. Nonetheless, rising customer-acquisition costs and razor-thin fees heighten the urgency of AI-driven lead scoring and marketing analytics to pinpoint high-potential prospects.
Geography Analysis
The Northeast retained 35.12% market share in 2025, anchored by New York’s financial corridor, Boston’s biotech wealth, and continued inflows of global capital seeking U.S. dollar exposure. Despite its supremacy, net domestic migration trends have tilted southward, nudging banks to establish satellite wealth offices in Florida, North Carolina, and Georgia to follow client footprints. Real-estate advisory desks note accelerated condo and single-family purchases in Miami-Dade and Palm Beach counties, mirroring a broader shift toward zero-state-income-tax jurisdictions. The West is set to record a 6.74% CAGR through 2031, the fastest among regions as technology IPO windfalls, venture-capital distributions, and equity-compensation packages swell household investable assets. Silicon Valley remains the AUM nucleus, yet secondary hubs such as Austin and Denver are scaling rapidly, supported by corporate relocations and favorable business climates. Private banks expand into these metros via boutique acquisitions and co-working-style client lounges that resonate with tech founders. Real-asset demand trends westward too, with clients acquiring multifamily developments in Phoenix and Seattle, spurring banks to strengthen commercial-lending desks specialized in construction financing.
The South benefits from a USD 100 billion wealth migration wave between 2024 and 2025 as affluent households pursue lower taxes and warmer climates. Banks ramp hiring of bilingual advisors in Texas and Florida to serve Latin American inbound clients seeking dollar-denominated safety. Enterprise service uptake accelerates among family-owned businesses in energy, logistics, and healthcare, prompting tailored lending solutions such as asset-based lines secured by receivables. Miami emerges as a cross-border wealth hub, channelling investments into both U.S. and Caribbean property markets, thereby diversifying fee sources. Midwest wealth remains steady, rooted in manufacturing dividends, agricultural land appreciation, and a resurgence in mobility and clean-tech startups around Detroit and Chicago. Growth lags coastal regions yet provides stable lending spreads and sticky deposit bases. Banks leverage community ties, sponsoring local cultural initiatives that reinforce brand trust.
Regulatory Landscape
The United States private banking market operates under a multi-regulator framework led by the SEC and FINRA for brokerage and investment advisory conduct, alongside the Federal Reserve, OCC, and FDIC for bank prudential oversight, with FinCEN handling BSA/AML compliance. In 2026 regulatory agendas, priorities emphasized digital-asset integration and related supervisory expectations, including workstreams around stablecoin policy implementation and the treatment of tokenized assets within existing securities frameworks. These requirements directly shape how private banks distribute alternatives and new digital wrappers to HNW and UHNW clients.
Supervision and rulemaking also keep reshaping operating models and fixed costs. Reg BI examinations have emphasized fee disclosure, suitability, and conflict mitigation for dual-registrants, with rollover advice also remaining a focus given the SECURE Act 2.0-driven pipeline into advisory relationships. On the prudential side, the OCC proposed in December 2025 to raise the threshold for heightened risk-governance standards from USD 50 billion to USD 700 billion in total consolidated assets, a shift that can alter the compliance burden across mid-sized institutions and influence competitive intensity in wealth-led banking strategies.
Value Chain Analysis
The private banking value chain in the United States begins with client acquisition and onboarding, using relationship managers, referral networks, and digital lead generation. It then moves into advice and planning, including financial planning, tax and estate coordination, and family-office style services, before advancing to product manufacturing and sourcing such as in-house asset management, third-party funds, and alternatives like private credit and real estate syndications. Portfolio implementation follows through custody, trading, and reporting.
Lending and banking services, including securities-based lending, mortgages, liquidity lines, and cash management, sit alongside investment advice as key relationship anchors, while ongoing servicing depends on hybrid channels that combine in-branch engagement with secure digital workflows. Delivery is increasingly platform-led, with banks integrating wealth units with commercial and investment banking to provide holistic solutions for entrepreneurs and executives across personal and enterprise needs. Distribution blends traditional private-bank teams and wirehouse models with independent advisor networks, while specialist partners support trust administration, alternatives due diligence, and enabling technology such as onboarding, client portals, and analytics. AI-enabled tooling is shifting parts of research, communication, and operational checks toward automation, which can raise data-governance and supervisory requirements within the operating stack.
Competitive Landscape
The United States private banking market displays moderate concentration, with the largest players managing a significant portion of overall client assets. Leading institutions such as JPMorgan Private Bank and Bank of America Private Bank leverage their universal banking models to offer an integrated suite of services, combining lending, investment, and custody solutions. Their scale advantage is further strengthened by substantial technology investments aimed at enhancing advisor productivity and client experience. For example, JPMorgan’s upcoming platform upgrade integrates AI-driven trade recommendations into advisor workflows, while Goldman Sachs uses generative AI to streamline document handling. These innovations reduce operational friction and allow advisors to focus more on strategic wealth planning.
Regional and mid-tier banks are adopting specialization strategies to remain competitive in the evolving market. Commerce Bancshares expanded its footprint in the Southeast through a key acquisition, bringing in new trust assets and enabling the cross-selling of niche offerings such as private aviation and yacht financing. Similarly, TowneBank’s acquisition in Richmond supports its focus on middle-market business owners seeking coordinated personal and corporate financial solutions. These regional moves illustrate the value of concentrating resources in fast-growing, demographically attractive markets. Strategic geographic clustering, combined with tailored service offerings, allows smaller players to defend and grow market share despite resource limitations.
Fintech challengers continue to target specific segments of the wealth management value chain, including alternative investments, tax strategies, and digital estate planning tools. However, their lack of core banking infrastructure and increasing regulatory scrutiny pose limitations to long-term competitiveness. Traditional banks have responded by partnering with or absorbing fintech solutions, offering enhanced digital services without surrendering control over client relationships. As a result, the competitive battleground has shifted from pure innovation to execution—particularly in delivering hybrid digital-human experiences, maintaining robust product platforms, and ensuring regulatory compliance. Institutions that master these elements are more likely to attract and retain high-value clients amid shifting economic conditions.
United States Private Banking Industry Leaders
JPMorgan Private Bank
Bank of America Private Bank
Morgan Stanley Private Wealth Management
Wells Fargo The Private Bank
UBS Wealth Management USA
- *Disclaimer: Major Players sorted in no particular order

Market Opportunities and Future Outlook
Tokenization and broader digital-asset plumbing create product-design whitespace for private banks to offer more granular access and administration for private-market exposures, while staying within U.S. securities and banking oversight. Regulators have been advancing frameworks for integrating tokenized assets into existing securities regimes, and 2026 regulatory agendas across major agencies highlighted digital-asset integration as a priority. That emphasis supports continued build-out of compliant issuance, custody, reporting, and suitability processes within private banking platforms.
GenAI-driven hyper-personalization is another actionable opportunity area, supported by adoption inside large banks and by economic pressure from fee compression and rising compliance costs. Goldman Sachs deployed a GenAI assistant in January 2025 to support research summarization and client communications, while hybrid advisory models have been cited as reducing servicing costs while preserving high-touch trust. Early 2026 performance signals reinforce how platform scale can translate into execution and operating leverage, including Morgan Stanley Wealth Management, UBS Global Wealth Management, and Bank of America GWIM being highlighted among Q1 2026 revenue leaders, and JPMorgan Asset and Wealth Management reporting a 35% pre-tax margin in Q1 2026.
Recent Industry Developments
- July 2026: JPMorgan filed a federal suit in Chicago seeking a temporary restraining order against a former private client advisor who joined an LPL Financial affiliate Genesis Wealth. The case highlights litigation risk and adviser movement that can affect client retention and assets under management dynamics in the private banking ecosystem.
- May 2026: Wells Fargo announced the addition of three advisor teams from Morgan Stanley and UBS managing over $9 billion in total client assets. The expansion increases Wells Fargo's share of high-net-worth client assets and broadens cross-firm advisory capabilities.
- April 2026: Merrill Lynch (Bank of America Private Bank division) recruited a JPMorgan private banker managing $2.2 billion in San Francisco. The hiring points to intensified recruiting pressure and possible client-asset transfer among top private banks.


Research Methodology Framework and Report Scope
Market Definition and Coverage
For this study, the United States private banking market is defined as revenues earned from private banking and private wealth services delivered to affluent and high-net-worth clients through banks and similar regulated financial institutions.
Scope exclusions: It excludes retail mass-market banking fees, pure brokerage-only activity, and non-financial concierge services that are not directly tied to private banking relationships.
Segmentation Overview
- By Type
- Asset Management Service
- Insurance Service
- Trust Service
- Tax Consulting
- Real-Estate Consulting
- By Application
- Personal
- Enterprise
- By Client Wealth Tier
- Mass-Affluent
- High-Net-Worth
- Ultra-High-Net-Worth
- By Geography
- Northeast
- Midwest
- South
- West
Data Sources, Market Sizing, and Validation
Desk Research
Desk research was used to build the market boundaries, anchor the macro assumptions, and frame how private banking revenue pools typically move with wealth, interest rates, and client activity. We relied on public US sources such as Federal Reserve releases (including wealth and balance sheet tables), SEC and FINRA investor and regulatory materials, FDIC banking statistics, and US Bureau of Economic Analysis macro series, which helps keep the model aligned with the underlying economy.
To translate these signals into a workable market view, additional inputs were taken from bank 10-Ks, earnings decks, and annual reports, followed by association updates and trusted press coverage on wealth trends and advisory pricing. Where needed, paid subscriptions for company financials and intelligence, news and financials, and patent databases were used to cross-check product launches and banking technology themes that influence service delivery. The examples listed above are illustrative only, and many other sources were also reviewed for data collection, clarification, and validation.
Primary Interviews and Surveys
Primary work focused on validating what is counted as private banking revenue in practice, and how pricing and client mix shift by region and bank type. We spoke with relationship teams, product specialists, and operations leaders to confirm fee drivers such as advisory pricing, discretionary mandates, and lending-linked revenue, and then tested these notes against the desk assumptions.
Because this is a US-only market, we balanced field inputs across major wealth corridors and smaller hubs so regional differences in client behavior and service models could be represented without overfitting the model.
Distribution of primary research fieldwork respondents
| Company type | Respondent position |
|---|---|
| Top tier: 39% | CXOs: 14% |
| Mid tier: 41% | Functional/Unit leaders: 41% |
| Smaller Players: 20% | Managers: 45% |
Market-Sizing & Forecasting
The market size is constructed using a combined top-down and bottom-up logic. On the top-down side, we rebuild the addressable fee pool by linking US wealth and asset allocation signals to private banking service penetration, and then apply realistic pricing ranges for advisory, trust, and planning services.
To keep results grounded, we use selective bottom-up checks, such as rolling up sampled private bank revenue lines from public filings, comparing implied revenue per client or per advisor, and sanity-checking outcomes versus regional footprints. When gaps exist, for example when firms do not break out private banking neatly, we apply proxy splits based on peer disclosures and then re-test them through expert feedback.
For forecasting, scenario analysis is applied so the model can reflect different paths for interest rates, market returns, and client activity without forcing a single straight-line trend. Inputs that matter most include HNWI and UHNW population and wealth growth, equity and fixed income market performance, managed account mix, uptake of alternatives, lending demand tied to securities-based borrowing, and staffing productivity in advisory teams.
Data Validation & Update Cycle
Outputs are validated in several steps so the final number is not driven by any single assumption. We compare results against independent signals like US wealth levels, bank wealth management revenue disclosures, and observed shifts in advisory pricing, and then review outliers before sign-off.
If a major variance shows up by region, client tier, or service line, the assumptions are revisited and select respondents are re-contacted to confirm what changed and why. Reports are refreshed annually, and interim updates are done when material events occur that can move fee pools, regulation, or client behavior. Before delivery, an analyst performs a fresh pass so clients receive the latest updated view.
Mordor Intelligence's United States Private Banking Market Size Versus Other Published Estimates
Published market sizes for US private banking often vary because the service boundary is not uniform across firms, and revenue definitions shift between advisory fees, trust income, and lending-linked income. Differences also come from how each study treats client tiers, whether enterprise services are counted, and the timing of currency and rate assumptions used in the base year.
By tracking fee line items and client-wealth tier cutoffs, Mordor Intelligence keeps the estimate tied to private banking revenues that can be reconciled back to disclosures and interview checks, which reduces inflation from adjacent brokerage and mass-affluent wealth products.
Benchmark comparison
| Source | Market Size | Gaps in Research Methodology |
|---|---|---|
| Mordor Intelligence | USD 59.54 B (2025) | |
| Industry Data Publisher A | USD 128.70 B (2026) | Uses an industry revenue view that can fold in broader wealth management, interest income, and trust company activity, which expands scope beyond private banking fee pools and also shifts the base year to a higher rate cycle. |
| Advisory Newsletter B | USD 112.50 B (2024) | Often presented as a rounded current-value range with limited clarity on whether enterprise services, mass-affluent wealth programs, or custody-style revenues are included, which can lift totals versus a tighter private banking boundary. |
The spread in the table is mostly explained by what is counted as private banking versus the wider bank wealth and trust ecosystem, and by which revenue lines are treated as in-scope. When the scope is kept consistent and the drivers are traced to observable signals like wealth levels, pricing, and disclosure-based checks, the market number becomes easier to reproduce and to use in planning.


Key Questions Answered in the Report
What is the current value of the United States private banking sector?
The United States private banking market size is USD 64.97 billion in 2026.
How fast is the United States private banking market expected to grow?
It is projected to expand at a 9.12% CAGR, reaching USD 100.52 billion by 2031.
Which service line holds the largest share in private banking?
Asset management leads with 50.74% market share in 2025.
Which U.S. region shows the fastest private-banking growth?
The West is forecast to post a 6.74% CAGR through 2031.
Why are alternative investments important to private banks?
Client demand for private credit and real estate boosts fee revenues and differentiates advisory offerings.
Page last updated on:





