Cleaning Products Market Size and Share
Market Overview
| Study Period | 2021 - 2031 |
|---|---|
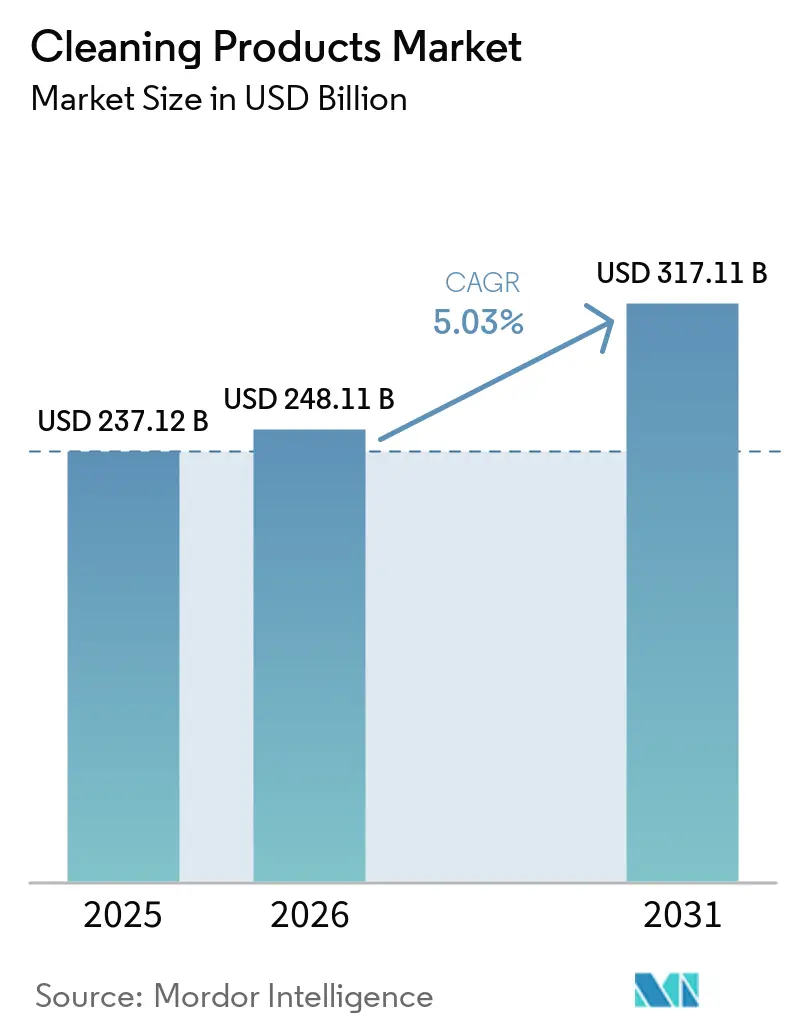
| Market Size (2026) | USD 248.11 Billion |
| Market Size (2031) | USD 317.11 Billion |
| Growth Rate (2025 - 2030) | 5.03% CAGR |
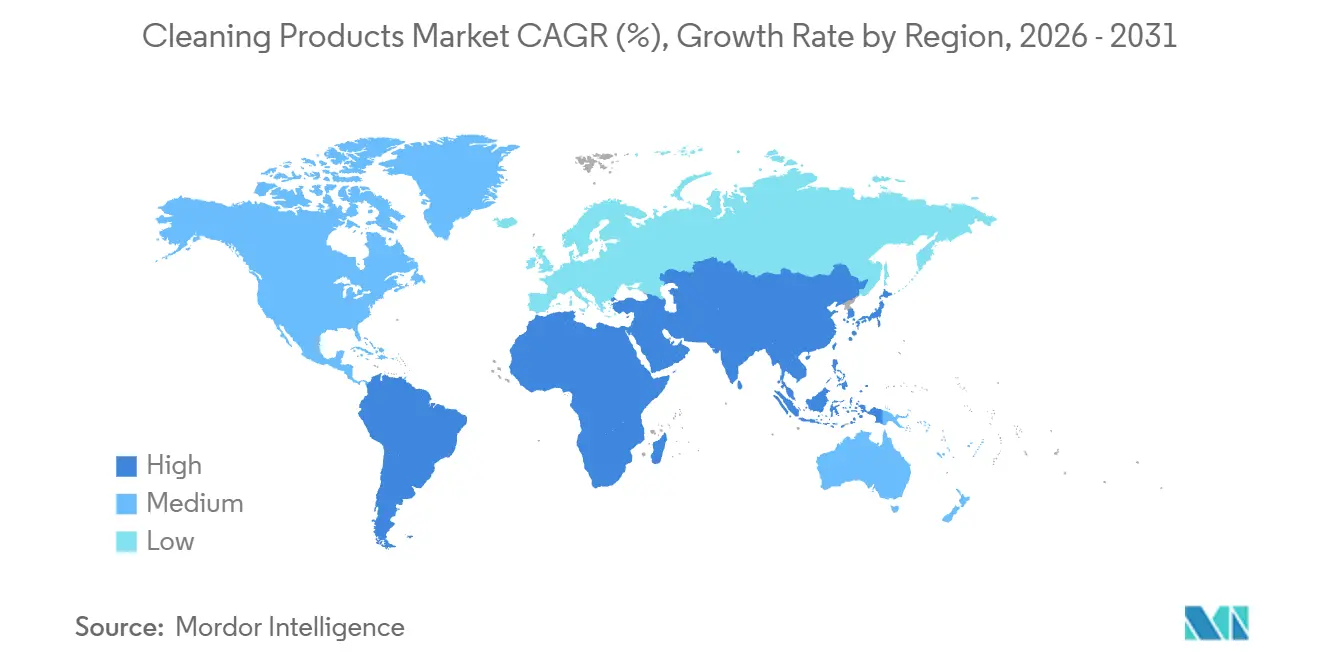
| Fastest Growing Market | Middle East and Africa |
| Largest Market | North America |
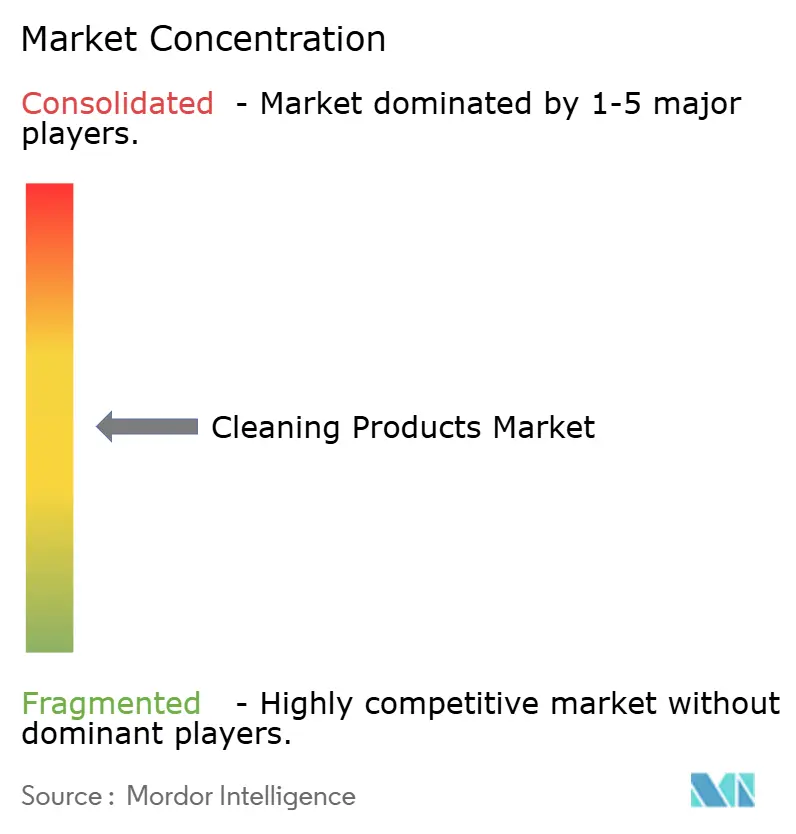
| Market Concentration | Medium |
Major Players *Disclaimer: Major Players sorted in no particular order Image © Mordor Intelligence. Reuse requires attribution under CC BY 4.0. | |
Cleaning Products Market Analysis by Mordor Intelligence
The cleaning products market size was valued at USD 237.12 billion in 2025 and is estimated to grow from USD 248.11 billion in 2026 to reach USD 317.11 billion by 2031, at a CAGR of 5.03% during the forecast period (2026-2031). Heightened regulatory requirements for biodegradable surfactants, the implementation of stricter hygiene protocols following the pandemic, and the rapid growth of direct-to-consumer subscription services are significantly influencing formulation science and route-to-market strategies. Increasing disposable incomes in emerging economies are driving first-time purchases, while the expansion of private-label products in mature markets is reducing the price premiums traditionally held by established brands. Fluctuations in raw material prices for oleochemicals and petrochemicals are prompting companies to adopt vertical integration and multi-sourcing approaches. Companies that excel in enzyme engineering, digital traceability, and refillable packaging are well-positioned to gain pricing advantages as government procurement increasingly prioritizes verified sustainable solutions. These shifts are creating opportunities for businesses to align with evolving consumer preferences and regulatory expectations, ensuring long-term growth and competitiveness in the market.
Key Report Takeaways
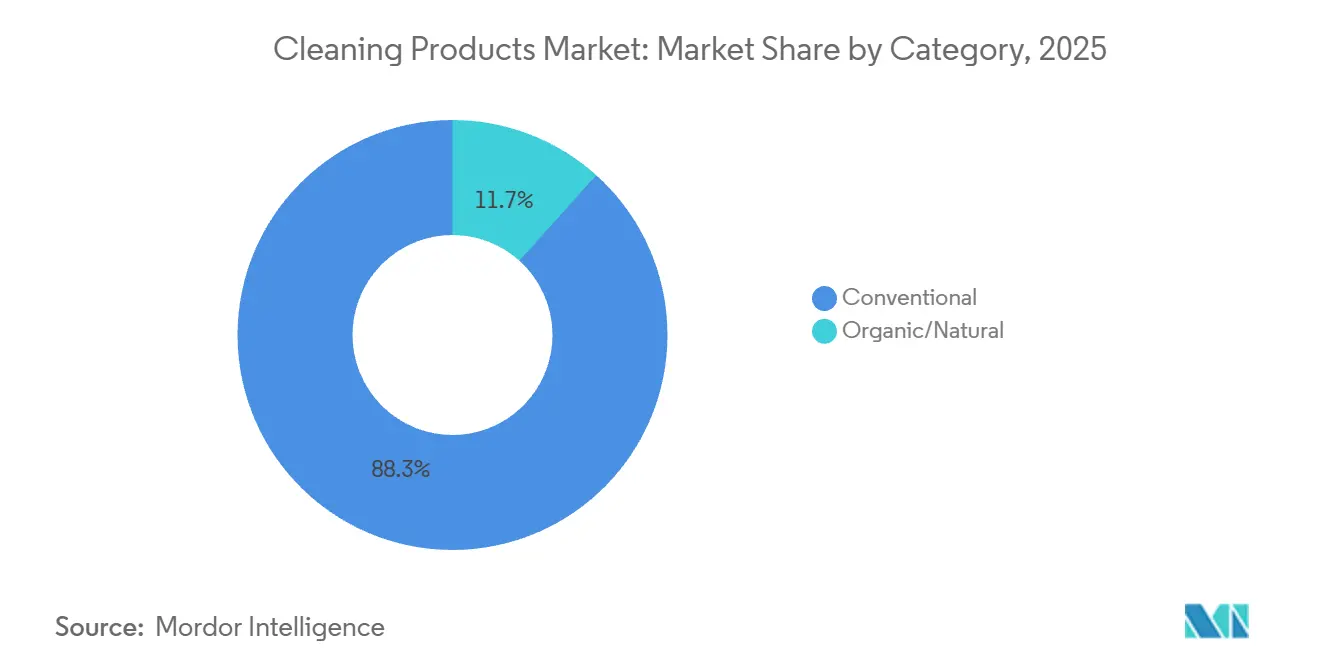
- By category, conventional products led with 88.34% revenue share in 2025, while organic and natural alternatives are advancing at an 8.32% CAGR through 2031.
- By product type, laundry care held 35.32% of revenue in 2025; surface cleaners are forecast to expand at a 5.88% CAGR to 2031.
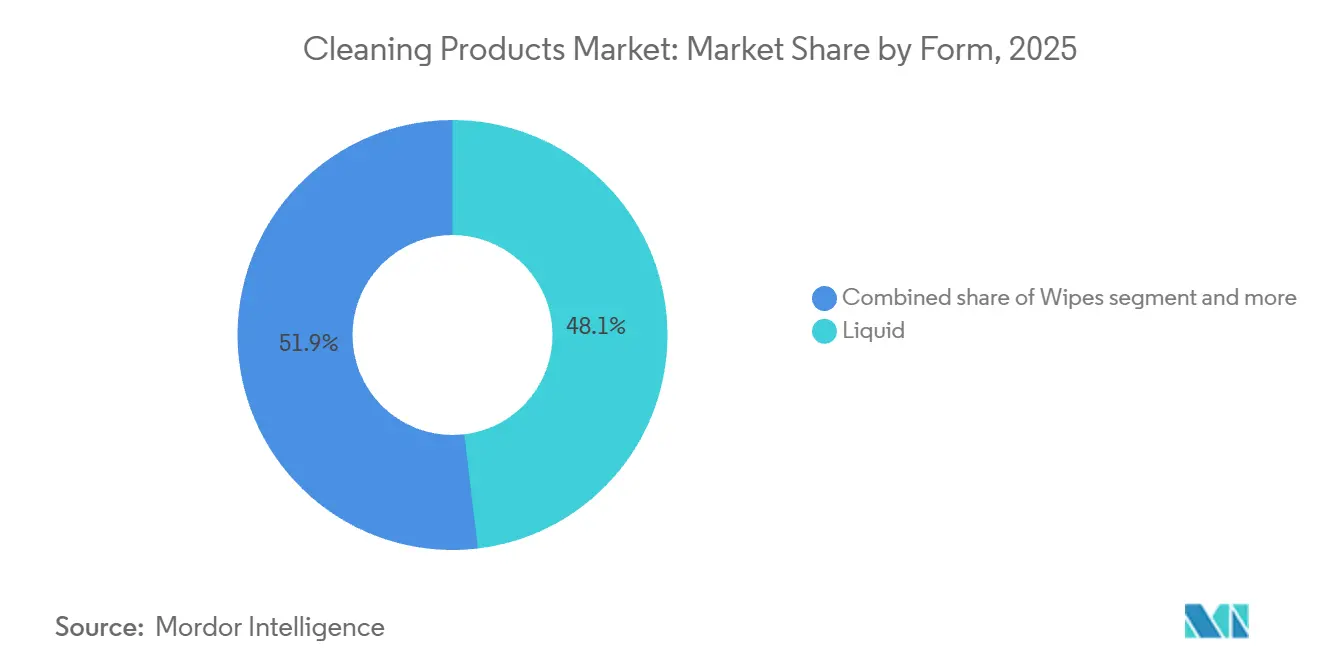
- By form, liquid formats commanded 48.11% share of the cleaning products market size in 2025, whereas wipes are growing at a 6.51% CAGR through 2031.
- By application, household and residential uses accounted for 73.12% of demand in 2025, yet institutional and commercial demand is increasing at an 8.34% CAGR to 2031.
- By distribution channel, retail venues held 78.26% of value in 2025, while online platforms are rising at a 9.1% CAGR through 2031.
- By geography, North America is projected to account for 29.34% of the market value in 2025, while the Middle East and Africa are expected to grow at a CAGR of 6.65% through 2031.
Note: Market size and forecast figures in this report are generated using Mordor Intelligence’s proprietary estimation framework, updated with the latest available data and insights as of January 2026.
Global Cleaning Products Market Trends and Insights
Drivers Impact Analysis*
| Driver | (~) % Impact on CAGR Forecast | Geographic Relevance | Impact Timeline |
|---|---|---|---|
| Shift toward eco-friendly, biodegradable, and non-toxic products | +1.2% | Global, with strongest uptake in North America and EU | Medium term (2-4 years) |
| Demand for natural and plant-based formulations amid preferences for chemical-free options | +0.9% | North America, EU, and urban Asia-Pacific | Medium term (2-4 years) |
| Busy lifestyles of working professionals favoring convenient formats | +0.7% | Global, particularly urban centers in Asia-Pacific and North America | Short term (≤ 2 years) |
| Growth in specialized products for specific surfaces | +0.6% | North America, EU, and institutional segments globally | Medium term (2-4 years) |
| Technological advancements in formulations for better efficacy and longer-lasting results | +0.8% | Global, with research and development concentration in North America, EU, and Japan | Long term (≥ 4 years) |
| Preference for products with pleasant fragrances and attractive packaging | +0.5% | Global, with premium segments in North America and Asia-Pacific | Short term (≤ 2 years) |
| Source: Mordor Intelligence | |||
Shift toward eco-friendly, biodegradable, and non-toxic products
Regulatory frameworks are becoming more stringent regarding surfactant biodegradability and aquatic toxicity, pushing manufacturers to reformulate products to remain competitive in the market. The European Union's revised Detergents Regulation, which is set to be implemented in the year 2027, will require digital product passports to track ingredient sourcing and lifecycle emissions. Similarly, the United States Environmental Protection Agency's Safer Choice program expanded in the year 2025, introducing restrictions on microplastics and stricter criteria for volatile organic compounds [1]Source: Environmental Protection Agency, “EPA’s Safer Choice and Design for the Environment (DfE) Standard,” epa.gov. In response to these regulatory changes, Unilever's bioscience division launched a biosurfactant platform in the year 2024, utilizing fermented sugarcane. This innovation achieved high biodegradability within a short period under Organisation for Economic Co-operation and Development protocols, enabling the company to address regulatory-driven demand in key markets such as Germany and the Netherlands. Additionally, Clorox introduced a hydrogen peroxide-based disinfectant line in the year 2025, eliminating quaternary ammonium compounds to address institutional buyers' concerns regarding antimicrobial resistance and indoor air quality. These changes are not solely compliance-driven but also reflect a strategic emphasis on ingredient transparency as a competitive differentiator. This is particularly relevant in markets where eco-labels, such as the European Union Ecolabel and Nordic Swan, command significant price premiums.
Demand for natural and plant-based formulations amid preferences for chemical-free options
Consumer skepticism toward synthetic chemicals is driving the growing adoption of plant-derived surfactants, enzymes, and preservatives. However, this transition poses formulation challenges, particularly concerning stability and microbial efficacy. Procter & Gamble's recent investor presentation highlighted the success of its plant-based laundry line, which utilizes surfactants derived from coconut and palm kernel oil. This product line has gained significant traction in the North American premium segment shortly after its launch, outperforming synthetic alternatives in repeat purchase rates. Seventh Generation, a subsidiary of Unilever, expanded its essential oil-based fragrance portfolio in the year two thousand twenty-four. The company collaborated with DSM-Firmenich to develop encapsulation technologies that improve scent longevity without relying on phthalates or synthetic musks. Despite these advancements, natural preservatives such as potassium sorbate and sodium benzoate exhibit narrower pH stability ranges compared to traditional isothiazolinones. This limitation has prompted brands to invest in cold-chain logistics and adopt shorter shelf-life labeling. Regulatory frameworks remain inconsistent, with the United States Food and Drug Administration maintaining a voluntary disclosure system, while the European Chemicals Agency enforces mandatory allergen labeling under the Registration, Evaluation, Authorisation and Restriction of Chemicals Annex Seventeen.
Busy lifestyles of working professionals favoring convenient formats
Single-dose formats and pre-measured units are becoming increasingly popular as busy households prioritize convenience over bulk purchasing. This trend is reshaping packaging economics and supply chain logistics. For example, Earth Breeze's laundry sheets, introduced in 2020, have significantly reduced the need for plastic jugs and cut shipping weight by a substantial percentage. This innovation supports direct-to-consumer subscription models, allowing companies to bypass traditional retail markups. Similarly, The Procter & Gamble Company's Tide Pods have seen substantial success in the North American market, with unit-dose formats gaining traction due to benefits like portion control and minimizing dosing errors. The wipes market is expanding at an annual growth rate of over 6%. Institutional buyers in healthcare and hospitality sectors are increasingly adopting pre-saturated formats to standardize disinfection protocols and minimize cross-contamination risks. Clorox's disinfecting wipes line has achieved significant sales, with a majority of its volume sold through electronic commerce channels. Subscription-based auto-replenishment models in these channels are enhancing customer lifetime value. However, this shift toward single-use formats comes with challenges. Single-use wipes contribute to landfill waste, leading to regulatory scrutiny in regions such as California and the European Union. Concerns focus on biodegradability claims and flushability standards, highlighting the environmental trade-offs associated with these products.
Growth in specialized products for specific surfaces
Surface-specific formulations are becoming increasingly popular as consumers recognize that universal cleaners often fail to perform effectively on materials such as granite, stainless steel, and engineered wood. This trend has created opportunities for premium-priced niche products. For instance, Reckitt Benckiser's Finish line for dishwashers introduced a glass-protection variant in 2024, incorporating silicate coatings to prevent etching. This product captured 18% of the European premium dishwasher detergent segment within 12 months. Similarly, SC Johnson's Windex Electronics wipes, launched in 2025, feature alcohol-free formulations designed to prevent screen damage on organic light-emitting diode (OLED) and liquid crystal display (LCD) screens, addressing a key concern for commercial buyers in retail and hospitality sectors. Additionally, Ecolab expanded its institutional product line in 2024 to include pH-neutral floor cleaners specifically formulated for luxury vinyl tile. This flooring material accounts for 35% of North American commercial installations but requires non-alkaline chemistry to prevent discoloration. Compliance factors are also becoming critical as brands navigate International Organization for Standardization (ISO) 22196 antimicrobial efficacy standards and American Society for Testing and Materials (ASTM) D5343 biodegradability protocols, which vary depending on the substrate and application method [2]Source: International Organization for Standardization, “ISO 22196:2011,” iso.org.
Restraints Impact Analysis*
| Restraint | (~) % Impact on CAGR Forecast | Geographic Relevance | Impact Timeline |
|---|---|---|---|
| Regulatory complexity and regional differences | -0.6% | Global, with highest friction in EU and Asia-Pacific | Medium term (2-4 years) |
| Consumer health concerns over harsh chemicals causing allergies | -0.4% | North America and EU, with growing awareness in Asia-Pacific | Short term (≤ 2 years) |
| Low brand loyalty as consumers switch based on promotions or trials | -0.5% | Global, particularly in price-sensitive segments | Short term (≤ 2 years) |
| Supply chain disruptions leading to ingredient shortages | -0.7% | Global, with acute impact in Asia-Pacific and South America | Short term (≤ 2 years) |
| Source: Mordor Intelligence | |||
Regulatory complexity and regional differences
Divergent chemical regulations across regions are increasing compliance costs and fragmenting product portfolios, particularly for multinational brands operating in the European Union, United States, and Asia-Pacific. The European Union's Registration, Evaluation, Authorisation and Restriction of Chemicals regulation requires registration and safety dossiers for approximately 1,800 substances used in cleaning products. In contrast, the United States employs a voluntary Safer Choice framework, which lacks enforcement mechanisms, resulting in uneven compliance burdens. China's revised GB standards for surfactant biodegradability, implemented in 2024, mandate 60% degradation within 28 days, a threshold 10 percentage points stricter than Organisation for Economic Co-operation and Development 301B, necessitating reformulations for brands targeting the Chinese market. Henkel AG & Co. KGaA's 2024 annual report revealed EUR 38 million in regulatory compliance costs, representing 1.2% of cleaning product revenue, primarily due to toxicological testing and dossier preparation for new ingredients [3]Source: Organisation for Economic Co-operation and Development, “Test No. 301: Ready Biodegradability,” oecd.org. Smaller brands, lacking the resources to navigate these complex frameworks, are losing market share to multinationals with dedicated regulatory affairs teams.
Consumer health concerns over harsh chemicals causing allergies
Growing concerns about the link between preservatives, fragrances, and surfactants to contact dermatitis and respiratory sensitization are driving product reformulations. However, these substitutes often impact product performance or shelf stability. The European Scientific Committee on Consumer Safety's opinion on methylisothiazolinone recommended concentration limits below a specific threshold in leave-on products, leading to reformulations across a significant portion of European cleaning stock-keeping units (SKUs). Similarly, the United States Environmental Protection Agency's assessment of quaternary ammonium compounds highlighted respiratory irritation risks in occupational settings, prompting institutional buyers to prioritize disinfectants free of quaternary ammonium compounds in procurement contracts. Unilever's sustainability report revealed that a portion of its cleaning portfolio underwent allergen reformulation, replacing synthetic fragrances with essential oils and botanical extracts. However, these changes resulted in a notable increase in raw material costs. Additionally, consumer litigation is on the rise, with class-action lawsuits in California and New York targeting brands for undisclosed allergens and misleading "hypoallergenic" claims.
*Our forecasts treat driver/restraint impacts as directional, not additive. The impact forecasts reflect baseline growth, mix effects, and variable interactions.
Segment Analysis
By Category: Conventional Dominance Masks Organic Acceleration
Conventional products accounted for 88.34% market share in 2025, supported by long-standing brand equity, extensive retail distribution networks, and pricing that appeals to cost-conscious households. However, organic and natural alternatives are growing at an annual rate of 8.32%, driven by regulatory support and increasing consumer demand for ingredient transparency, which are reshaping competitive dynamics.The Procter & Gamble Company's conventional Tide line generated USD 4.8 billion in revenue in 2024, utilizing enzyme technology and fragrance encapsulation to maintain its premium positioning. Meanwhile, its plant-based Tide Purclean captured 3% of the North American laundry market within three years of its launch.
Seventh Generation, Unilever's organic subsidiary, reported 22% revenue growth in 2025, supported by United States Department of Agriculture (USDA) Certified Biobased Product labels and partnerships with retailers such as Whole Foods and Target. Organic formulations face challenges related to consumer perceptions of efficacy and price premiums, which average 35% higher than conventional products. However, direct-to-consumer brands like Blueland and Grove Collaborative are addressing these issues by bypassing retail markups through subscription models that help lower customer acquisition costs.


By Product Type: Surface Cleaners Outpace Laundry Care
Laundry care products accounted for a 35.32% market share in 2025, reflecting established consumer habits and high repurchase rates. At the same time, surface cleaners experienced an annual growth rate of 5.88%, driven by institutional buyers who prioritize disinfectant efficacy and reduced dwell times, particularly in healthcare and hospitality sectors. Clorox's disinfecting sprays and wipes generated USD 1.9 billion in revenue in 2024, with 58% of the volume directed to institutional channels. These products benefit from Environmental Protection Agency (EPA)-registered kill claims against pathogens such as SARS-CoV-2 and norovirus, enabling premium pricing. Ecolab's institutional surface cleaner portfolio expanded by 14% in 2025, supported by hospital procurement contracts emphasizing 1-minute dwell times and compatibility with high-touch surfaces like stainless steel and polycarbonate.
Dishwashing products held an 18% market share in 2025, with innovations focusing on water efficiency. Reckitt's Finish Quantum tablets, for example, include pre-soaking agents that eliminate the need for rinse cycles in commercial dishwashers. Toilet and bathroom cleaners, floor cleaners, and glass and metal cleaners collectively contributed 28% of revenue in 2025, with growth concentrated in emerging markets. Rising incomes and urbanization in these regions are driving first-time purchases. In North America, SC Johnson's Windex line introduced a streak-free formula for automotive glass in 2024, targeting the USD 2.3 billion car care products market.
By Form: Wipes Surge Amid Convenience Demand
Wipes are growing at an annual rate of 6.51%, representing the fastest growth among all formats. This growth is driven by increased adoption among households and institutional buyers due to their pre-saturated substrates, which eliminate dosing errors and reduce cross-contamination risks. However, environmental concerns regarding flushability and landfill waste have led to regulatory interventions. Liquid formats accounted for a 48.11% market share in 2025, driven by the popularity of spray bottles and refillable concentrates. These formats appeal to environmentally conscious consumers aiming to reduce plastic consumption. For example, The Procter & Gamble Company's Mr. Clean concentrate line, launched in 2024, offers 10 refills per bottle, reducing packaging waste by 85% and capturing 7% of the North American surface cleaner market within 18 months.
Powder formats, which were historically dominant in laundry care, declined to 12% of the market in 2025 as consumers shifted to liquid and pod formats. These alternatives dissolve more quickly in cold water and leave fewer residues. Gel and cream formulations, representing 9% of the market in 2025, are preferred for vertical surfaces such as toilet bowls and oven interiors due to their viscosity, which prevents runoff and extends contact time. Tablets and aerosols collectively accounted for 11% of revenue in 2025. However, aerosols faced challenges due to volatile organic compound regulations in regions such as California and the European Union.

By Application: Institutional Segment Accelerates
Institutional and commercial applications are experiencing an annual growth rate of 8.34%, surpassing the household and residential segments. This growth is driven by healthcare facilities, corporate offices, and hospitality operators adopting stricter sanitation protocols and vendor-managed inventory solutions. In 2025, household and residential applications accounted for a 73.12% market share. Frequent purchases of products such as laundry detergents, dish soaps, and surface cleaners are sustaining this segment; however, growth is slowing in mature markets with high penetration rates. Diversey's institutional portfolio, anticipated to serve a significant number of facilities globally in the coming years, emphasizes concentrated formulations and automated dispensing systems aimed at reducing labor costs and ensuring dosing accuracy.
According to Ecolab's filings with the United States Securities and Exchange Commission (SEC), a substantial portion of its cleaning product revenue originates from institutional channels, with healthcare contributing a notable share, followed closely by food service. Healthcare facilities are increasingly prioritizing Environmental Protection Agency (EPA)-registered disinfectants with kill claims against Clostridioides difficile spores. This requirement limits product options and supports premium pricing. Clorox Healthcare's bleach-based disinfectants hold a significant share of the United States hospital segment, benefiting from short contact times and compatibility with electronic medical equipment.
By Distribution Channel: Retail Dominance Persists Amid E-Commerce Gains
Retail channels accounted for a 78.26% market share in 2025 and are projected to grow at an annual rate of 5.32%. Supermarkets and hypermarkets contributed significantly to retail volume through strategies such as promotional pricing and end-cap displays, which effectively drive impulse purchases. Online retail emerged as the fastest-growing sub-channel, expanding steadily due to subscription models and automated replenishment algorithms. These innovations reduce customer acquisition costs and improve customer lifetime value. For example, Amazon's Subscribe and Save program captured a notable share of the United States cleaning product e-commerce market by offering discounts on recurring orders and leveraging predictive analytics to optimize delivery schedules.
Convenience and grocery stores, while representing a smaller but essential portion of retail distribution, primarily served immediate-need purchases and urban households with limited storage capacity for bulk products. Wholesale and corporate procurement channels catered to institutional buyers through vendor-managed inventory systems and just-in-time delivery methods, which minimize on-site storage requirements. Ecolab's institutional sales model, which combines product supply with equipment leasing and training services, generated significant revenue, with most customers engaged in multi-year contracts.
Geography Analysis
North America led the market in 2025, holding a 29.34% share, primarily driven by the United States. Household penetration in the United States exceeds 98%, with per-capita consumption of cleaning products averaging USD 95 annually. However, growth in the region has moderated to 4.2%, as companies prioritize innovation over volume expansion. Procter & Gamble, Clorox, and Church & Dwight collectively controlled 48% of the United States market in 2024, utilizing their patent portfolios in enzyme stability and encapsulation technology to maintain their dominance in premium segments. In Canada, the market is shaped by bilingual labeling requirements and provincial regulations on phosphate content, with Quebec enforcing phosphate-free formulations since 2010, a decade ahead of federal standards. Meanwhile, Mexico is growing at 6.8% annually, supported by urbanization and rising middle-class incomes. Local brands such as Pinol have captured 14% of the floor cleaner segment through value pricing and distribution in traditional trade channels.
The Middle East and Africa region is the fastest-growing segment, expanding at an annual rate of 6.65%. This growth is fueled by infrastructure development, government-led hygiene initiatives, and an increasing expatriate population in Gulf Cooperation Council countries. Saudi Arabia's market grew by 8.1% in 2024, driven by Vision 2030 investments in healthcare and hospitality infrastructure, with institutional cleaning product demand increasing at 11.2% annually. In the United Arab Emirates, the market is characterized by high per-capita consumption and premiumization, with 48% of households purchasing eco-certified products in 2025, marking the highest penetration in the region. These factors collectively position the Middle East and Africa as a key area of growth within the global cleaning products market.
Other regions, such as Europe, held a 26% market share in 2025, with Germany, the United Kingdom, France, Italy, and Spain collectively contributing 68% of the region's revenue. However, growth in Europe is constrained to 3.9%, as stringent Registration, Evaluation, Authorisation, and Restriction of Chemicals (REACH) regulations and Ecolabel certification requirements increase compliance costs. Germany, the largest market in Europe, valued at EUR 4.2 billion in 2024, demonstrates a high penetration of eco-certified products, with 38% of households purchasing Ecolabel-certified cleaners compared to 22% across the European Union. Additionally, the Asia-Pacific region is driven by urbanization, rising disposable incomes, and increasing hygiene awareness. China, India, and Japan collectively accounted for over 60% of the region's revenue in 2025. In India, government initiatives such as Swachh Bharat Abhiyan (Clean India Mission) have significantly increased household penetration of surface cleaners, supporting the region's growth trajectory.
Mordor Intelligence provides coverage of the cleaning products market across other key regional markets. Detailed country-level analysis extends to South Africa incorporating local coverage and market participation, as required.

Competitive Landscape
The cleaning products market demonstrates moderate concentration, providing opportunities for regional specialists, private-label brands, and direct-to-consumer companies to gain market share through niche positioning and flexible go-to-market approaches. Established multinational companies such as Procter & Gamble, Unilever, Henkel, and Reckitt Benckiser utilize their patent portfolios in enzyme engineering, encapsulation technology, and surfactant chemistry to maintain their positions in premium segments. However, these incumbents face margin pressures due to the expansion of private-label products in European hypermarkets and North American grocery chains, where retailers are developing proprietary formulations that deliver comparable performance at prices approximately 25% lower than branded alternatives. Procter & Gamble's 2024 Securities and Exchange Commission (SEC) 10-K report revealed 127 active patents related to cleaning product formulations, including 18 filings in 2024 focused on cold-water enzyme stability and microplastic-free abrasives, highlighting the critical role of intellectual property in maintaining competitive advantages.
Direct-to-consumer brands such as Blueland and Grove Collaborative are bypassing traditional retail markups by leveraging subscription models and social media marketing. These brands are effectively targeting millennial and Generation Z consumers, who prioritize sustainability and ingredient transparency over established brand reputations. Additionally, new opportunities are emerging in institutional segments, where vendor-managed inventory systems and automated dispensing technologies help reduce labor costs and ensure accurate dosing. This value proposition is particularly appealing to healthcare facilities and hospitality operators dealing with persistent staffing shortages. Ecolab and Diversey currently dominate institutional channels, collectively accounting for 42% of the global commercial cleaning market in 2025. However, smaller players like Avmor and Betco are gaining traction through regional distribution networks and specialized formulations tailored for niche applications, such as food processing and pharmaceutical manufacturing.
Technology adoption is advancing rapidly, with Internet of Things (IoT)-enabled dispensers that monitor usage patterns and automate reordering processes, minimizing stockouts and optimizing inventory management. Reckitt Benckiser's 2025 investor presentation emphasized its digital transformation efforts, which include the integration of Radio Frequency Identification (RFID) tags and cloud-based analytics to provide institutional customers with real-time consumption data and predictive maintenance alerts.
Cleaning Products Industry Leaders
The Procter & Gamble Company
Unilever plc
Henkel AG & Co. KGaA
Reckitt Benckiser Group plc
Colgate-Palmolive Company
- *Disclaimer: Major Players sorted in no particular order

Recent Industry Developments
- July 2025: First Quality Enterprises announced the acquisition of Henkel's Retailer Brands in North America, creating a new division called First Quality Home Care Products, which expanded the company's portfolio into detergents, fabric finishers, and dishwash categories.
- May 2025: Clean Cult, the world's first company to package cleaning products in paper-based cartons, announced its nationwide launch in as many as 1,800 Target stores and on Target.com.
- April 2025: Unilever launched probiotics-based home cleaning products, marking a shift toward beneficial microorganisms that provided sustained cleaning benefits while supporting healthy indoor microbiomes.
- July 2024: Ecolab launched Disinfectant 1 Wipe, the first EPA-registered 100% plastic-free, readily degradable disinfectant wipe with 1-minute hospital disinfection capability. Made from 100% wood pulp fibers, the product achieved a 94.3% biodegradation rate in 15-day testing while reducing total wipe utilization by 36%.


Global Cleaning Products Market Report Scope
The global cleaning products market focuses on the manufacturing and sale of household, commercial, and institutional products. These products include laundry detergents, surface cleaners, dishwashing products, bathroom cleaners, and floor cleaners. Both conventional and eco-friendly formulations are available through various distribution channels. The market is segmented by category into conventional and organic or natural, by product type into laundry care products, surface cleaners, dishwashing products, toilet or bathroom cleaners, floor cleaners, glass and metal cleaners, and other specialty cleaners, by form into liquid, powder, gel and cream, wipes, and tablets and aerosol, by application into household or residential and institutional and commercial, by distribution channel into wholesale or corporate procurement and retail. Retail is further segmented into supermarkets and hypermarkets, convenience or grocery stores, online retail, and other distribution channels, and by geography into North America, Europe, Asia-Pacific, South America, and Middle East and Africa. The market sizing has been done in value terms in USD for all the abovementioned segments.
| Conventional |
| Organic/Natural |
| Laundry Care Products |
| Surface Cleaners |
| Dishwashing Products |
| Toilet/Bathroom Cleaners |
| Floor Cleaners |
| Glass and Metal Cleaners |
| Other Specialty Cleaners |
| Liquid |
| Powder |
| Gel and Cream |
| Wipes |
| Tablets and Aerosol |
| Household/Residential |
| Institutional and Commercial |
| Wholesale/Corporate Procurement | |
| Retail | Supermarkets and Hypermarkets |
| Convenience/Grocery Stores | |
| Online Retail | |
| Other Distribution Channels |
| North America | United States |
| Canada | |
| Mexico | |
| Rest of North America | |
| Europe | Germany |
| United Kingdom | |
| Italy | |
| France | |
| Spain | |
| Netherlands | |
| Poland | |
| Belgium | |
| Sweden | |
| Rest of Europe | |
| Asia-Pacific | China |
| India | |
| Japan | |
| Australia | |
| Indonesia | |
| South Korea | |
| Thailand | |
| Singapore | |
| Rest of Asia-Pacific | |
| South America | Brazil |
| Argentina | |
| Colombia | |
| Chile | |
| Peru | |
| Rest of South America | |
| Middle East and Africa | South Africa |
| Saudi Arabia | |
| United Arab Emirates | |
| Nigeria | |
| Egypt | |
| Morocco | |
| Turkey | |
| Rest of Middle East and Africa |
| By Category | Conventional | |
| Organic/Natural | ||
| By Product Type | Laundry Care Products | |
| Surface Cleaners | ||
| Dishwashing Products | ||
| Toilet/Bathroom Cleaners | ||
| Floor Cleaners | ||
| Glass and Metal Cleaners | ||
| Other Specialty Cleaners | ||
| By Form | Liquid | |
| Powder | ||
| Gel and Cream | ||
| Wipes | ||
| Tablets and Aerosol | ||
| By Application | Household/Residential | |
| Institutional and Commercial | ||
| By Distribution Channel | Wholesale/Corporate Procurement | |
| Retail | Supermarkets and Hypermarkets | |
| Convenience/Grocery Stores | ||
| Online Retail | ||
| Other Distribution Channels | ||
| By Geography | North America | United States |
| Canada | ||
| Mexico | ||
| Rest of North America | ||
| Europe | Germany | |
| United Kingdom | ||
| Italy | ||
| France | ||
| Spain | ||
| Netherlands | ||
| Poland | ||
| Belgium | ||
| Sweden | ||
| Rest of Europe | ||
| Asia-Pacific | China | |
| India | ||
| Japan | ||
| Australia | ||
| Indonesia | ||
| South Korea | ||
| Thailand | ||
| Singapore | ||
| Rest of Asia-Pacific | ||
| South America | Brazil | |
| Argentina | ||
| Colombia | ||
| Chile | ||
| Peru | ||
| Rest of South America | ||
| Middle East and Africa | South Africa | |
| Saudi Arabia | ||
| United Arab Emirates | ||
| Nigeria | ||
| Egypt | ||
| Morocco | ||
| Turkey | ||
| Rest of Middle East and Africa | ||


Key Questions Answered in the Report
How large will global demand for household and institutional cleaners be in 2031?
The cleaning products market is forecast to reach USD 317.11 billion by 2031, reflecting continued adoption across both household and institutional settings.
Which product forms are growing the quickest?
Pre-saturated wipes are advancing at a 6.51% CAGR as consumers and institutions favor ready-to-use convenience.
Why are biosurfactants gaining traction?
They comply with new biodegradability rules and help brands capture eco-label premiums of about 15% while lowering aquatic toxicity.
What is driving online sales of detergents and surface cleaners?
Subscription services and predictive replenishment algorithms are lifting e-commerce revenue at a 9.1% CAGR by reducing stock-out risk for consumers.
Which regions are expected to post the fastest growth?
The Middle East and Africa region is projected to expand at 6.65% per year through 2031, lifted by healthcare construction and hygiene campaigns.
Page last updated on:


