Market Overview
| Study Period | 2019 - 2031 |
|---|---|
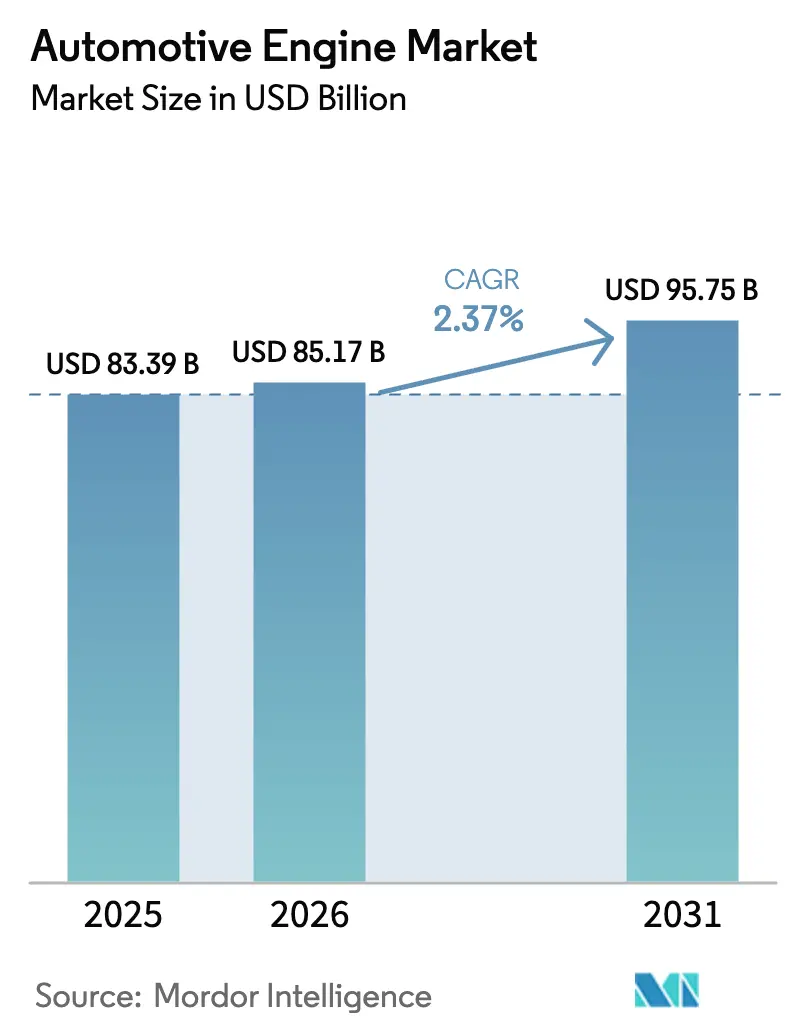
| Market Size (2026) | USD 85.17 Billion |
| Market Size (2031) | USD 95.75 Billion |
| Growth Rate (2026 - 2031) | 2.37% CAGR |
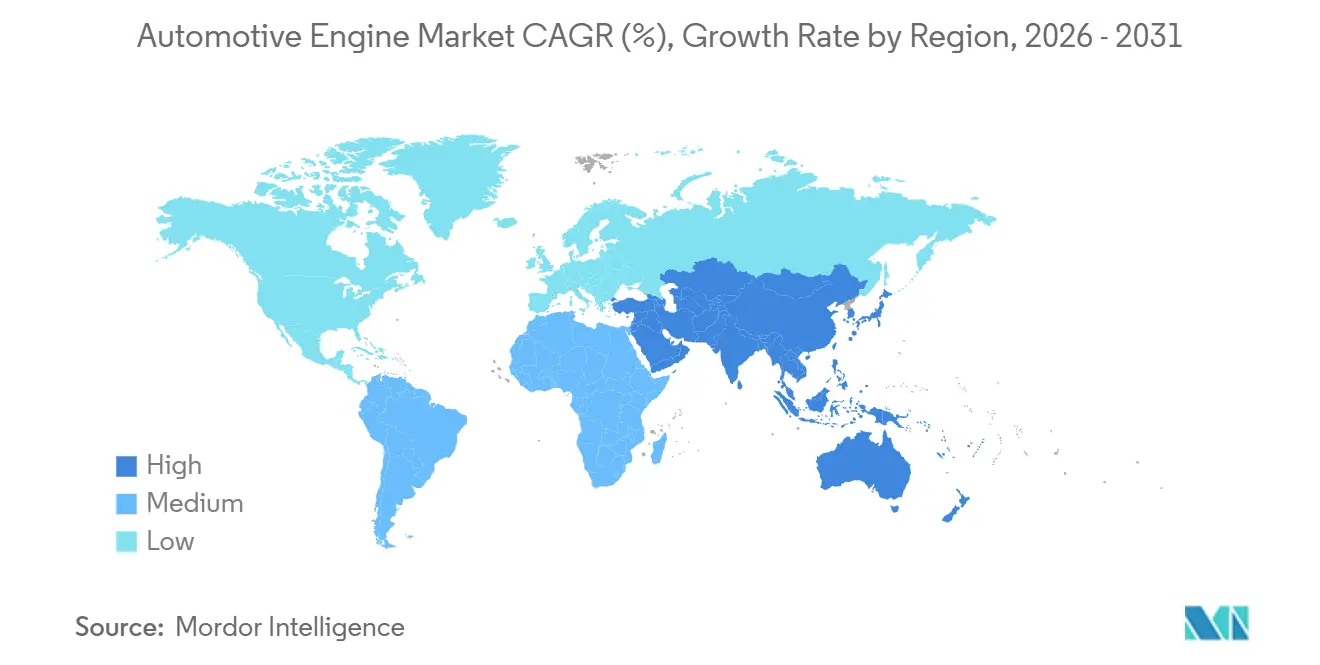
| Fastest Growing Market | Asia Pacific |
| Largest Market | Asia Pacific |
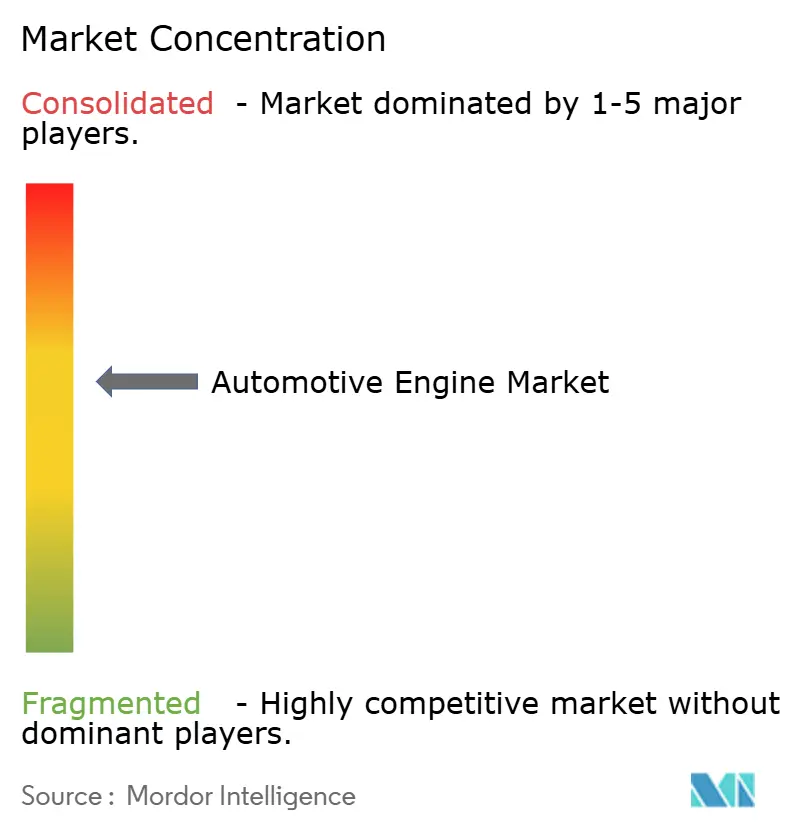
| Market Concentration | Medium |
Major Players *Disclaimer: Major Players sorted in no particular order Image © Mordor Intelligence. Reuse requires attribution under CC BY 4.0. | |
Automotive Engine Market Analysis by Mordor Intelligence
The automotive engine market size was valued at USD 83.39 billion in 2025 and estimated to grow from USD 85.17 billion in 2026 to reach USD 95.75 billion by 2031, at a CAGR of 2.37% during the forecast period (2026-2031). Persistent emissions legislation, mounting electrification momentum, and the enduring economics of hybrid-friendly internal-combustion platforms are shaping this measured trajectory. Automakers are channeling capital toward 48-volt systems, variable compression ratios, and after-treatment upgrades that eke out gains without abandoning familiar manufacturing footprints. Asia Pacific’s production heft keeps it in pole position, yet rising zero-emission mandates in Chinese and Indian megacities temper volume upside. Commercial-vehicle segments, synthetic e-fuels, and hydrogen-ICE pilots collectively anchor a medium-term bridge that postpones abrupt displacement by battery-electric drivetrains.
Key Report Takeaways
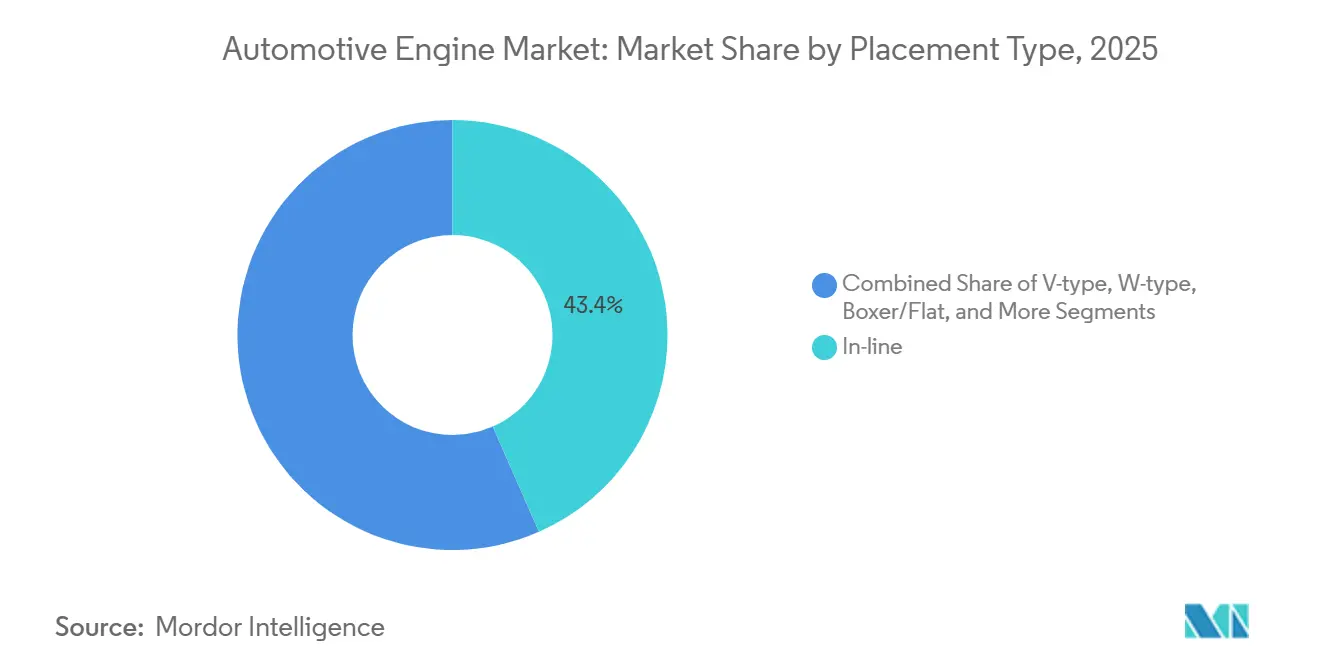
- By placement type, in-line layouts commanded 43.36% in 2025, whereas opposed-piston designs are advancing at a 2.39% CAGR to 2031.
- By fuel type, gasoline engines held 63.31% of the automotive engine market share in 2025, while hybrid-ICE configurations are projected to expand at a 2.47% CAGR through 2031.
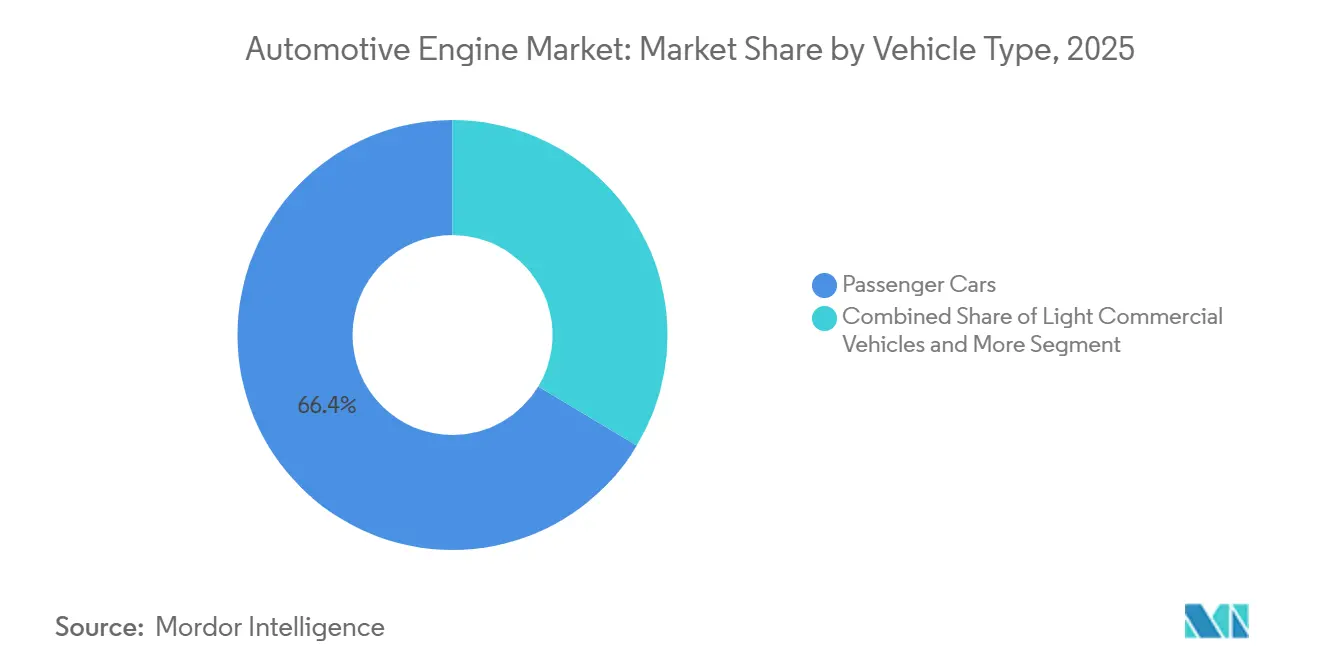
- By vehicle type, passenger cars accounted for 66.37% of demand in 2025; medium and heavy commercial vehicles are set to grow at a 2.49% CAGR, the fastest among segments.
- By engine capacity, the 1.5-to-3-liter band captured 54.45% of the automotive engine market size in 2025, while sub-1.5-liter turbocharged units are forecast to expand at a 2.41% CAGR.
- By geography, Asia Pacific secured 38.71% volume share in 2025 and is set to grow at a 2.45% CAGR through 2031, the quickest regional pace.
Note: Market size and forecast figures in this report are generated using Mordor Intelligence’s proprietary estimation framework, updated with the latest available data and insights as of January 2026.
Global Automotive Engine Market Trends and Insights
Drivers Impact Analysis*
| Driver | (~) % Impact on CAGR Forecast | Geographic Relevance | Impact Timeline |
|---|---|---|---|
| Rising Vehicle Production in Emerging Asia-Pacific Economies | +0.6% | Asia Pacific core (China, India, ASEAN), spill-over to South Asia | Short term (≤ 2 years) |
| Stricter Global Emission Regulations Driving ICE Efficiency Upgrades | +0.5% | Global, with accelerated compliance in Europe, China, and California | Medium term (2-4 years) |
| 48-V Micro-Hybrid Systems Reinforcing ICE Relevance | +0.4% | Global, with early adoption in Europe and China | Short term (≤ 2 years) |
| E-Commerce Logistics Boosting Light Commercial Vehicle Engine Demand | +0.3% | North America, Europe, urban Asia Pacific | Short term (≤ 2 years) |
| Emergence of Synthetic E-Fuels Extending ICE Lifecycle | +0.2% | Europe (Germany, Netherlands), pilot programs in Japan and California | Long term (≥ 4 years) |
| Hydrogen-Fueled ICE Pilots for Medium and Heavy Trucks | +0.1% | Japan, Europe (Germany), select North America trials | Long term (≥ 4 years) |
| Source: Mordor Intelligence | |||
Rising Vehicle Production in Emerging Asia-Pacific Economies
In 2025, India significantly increased its passenger vehicle production, achieving notable growth due to capacity expansions in Gujarat and Tamil Nadu. Meanwhile, China maintained its position as a leading producer of light vehicles, focusing on hybrids and exports, particularly to Southeast Asia, where infrastructure challenges persist. Both Indonesia and Thailand attracted substantial investments in flexible powertrains, solidifying their roles as key hubs in the ASEAN region for gasoline, hybrid, and CNG variants, all manufactured using shared tooling. Leveraging labor-cost advantages, Indian-manufactured engines are being exported to Africa and Latin America at significantly lower prices compared to their European counterparts, ensuring the continued competitiveness of internal combustion engines (ICE). This production growth is driving the automotive engine market forward, even as urban electrification policies become increasingly stringent [1]“Passenger Vehicles Sales Data,” SIAM, www.siam.in.
Stricter Global Emission Regulations Driving Internal Combustion Engine Efficiency Upgrades
Euro 7, China VI-b, and the United States Environmental Protection Agency (USEPA) Tier 4 Final standards converge to tighten particulate and NOₓ limits, obliging manufacturers to deploy gasoline particulate filters, on-board diagnostics parity, and low-temperature durability calibrations. The incremental hardware raises per-engine cost by roughly USD 300 yet safeguards regulatory compliance for high-volume passenger cars [2]“Joint Venture Partners between China’s National VI-b and California Air Resources,” European Commission, climate.ec.europa.eu. Selective catalytic reduction and high-pressure direct injection now permeate compact construction machines as well as light vehicles, expanding supplier addressable markets. Continued tightening propels R&D into lean-burn strategies, variable valve timing, and Miller-cycle adaptations that chase every gram of CO₂ abatement. The upshot is a sustained engineering pipeline that keeps the automotive engine market relevant even as electric vehicles gain share.
E-Commerce Logistics Boosting Light Commercial Vehicle Engine Demand
In 2025, Amazon, FedEx, and DHL collectively added a significant number of light commercial vehicles (LCVs) to their fleets. These companies showed a clear preference for mid-sized turbo diesel engines, specifically those delivering moderate horsepower and compliant with particulate filter regulations. While battery-electric LCVs are gaining traction, they grapple with challenges like payload reductions and diminished range in colder months. As a result, operators are gravitating towards engines from Ford and Mercedes-Benz that align with urban zone standards. Stellantis' diesel engine boasts impressive thermal efficiency and extended service intervals, effectively reducing the total cost per delivery stop. Given that logistics fleets prioritize uptime and quick refueling, they're maintaining orders for internal combustion engines (ICE) through the foreseeable future. This trend solidifies the segment's pivotal role in the automotive engine market.
Emergence of Synthetic E-Fuels Extending the Internal Combustion Engine Lifecycle
In the mid-2020s, Porsche's Haru Oni pilot produced a significant volume of e-fuel, blending it into German retail gasoline at a small percentage, demonstrating its compatibility with legacy engines. Recent EU amendments permit e-fuel-exclusive internal combustion engine (ICE) vehicles to be classified as zero-emission. This classification hinges on maintaining lifecycle CO₂ emissions at a minimal level, a target achievable through renewable electricity and carbon capture. Bosch and Mahle are reengineering combustion chambers for high-octane fuels, aiming for a notable efficiency boost via higher compression and ultra-lean strategies. While production costs in the mid-2020s are relatively high, scaling up production to a much larger volume could significantly reduce prices by the end of the decade. This price point becomes particularly competitive in markets with substantial carbon taxes. Such a trajectory not only provides original equipment manufacturers (OEMs) with a safeguard against stranded ICE investments but also extends the longevity of the automotive engine market.
Restraints Impact Analysis*
| Restraint | (~) % Impact on CAGR Forecast | Geographic Relevance | Impact Timeline |
|---|---|---|---|
| Rapid BEV Adoption Diverting R&D Budgets | -0.6% | Global, most acute in China, Europe, and California | Short term (≤ 2 years) |
| Critical Alloy Shortages Inflating Engine Costs | -0.4% | Global, most acute in supply chains serving Europe and North America | Short term (≤ 2 years) |
| Zero-Emission Urban Zones Curbing ICE Sales | -0.3% | Europe cities (London, Paris, Milan), Beijing, Tokyo | Medium term (2-4 years) |
| OTA-Driven Value Shift Toward Power Electronics | -0.2% | Global, led by premium segments in North America, Europe, and China | Medium term (2-4 years) |
| Source: Mordor Intelligence | |||
Rapid Battery Electric Vehicle Adoption Diverting R&D Budgets
In recent years, global sales of battery electric vehicles (BEVs) have experienced significant growth, capturing a notable share of the light-vehicle market. This shift has prompted automakers to pivot their engineering focus towards battery packs and software architectures. Volkswagen, in a bold move, allocated a substantial budget for electrification initiatives over the next decade. This decision came with a significant reduction in its internal combustion engine (ICE) budget and a consolidation of its combustion families. Meanwhile, General Motors announced it would halt the development of new ICE platforms in the near future, confining its future expenditures to compliance adjustments and mild-hybrid enhancements. In a clear sign of the industry's evolving landscape, Tier-1 suppliers like Bosch made headlines by reducing their power-train workforce. This move underscores a growing consensus: the once-thriving combustion sector is now merely a sustaining technology. As capital investments dwindle, innovation in areas like homogeneous-charge compression ignition and plasma-assisted ignition has slowed, steering the automotive engine industry towards incremental improvements rather than groundbreaking breakthroughs.
Zero-Emission Urban Zones Curbing Internal Combustion Engine Sales
In 2024, London expanded its Ultra Low Emission Zone to encompass all boroughs, imposing a daily charge on older internal combustion engine (ICE) vehicles. This move is hastening the shift towards hybrid and battery electric vehicles (BEVs). In the mid-2020s, Paris prohibited diesel cars from operating within the Périphérique, and restrictions on gasoline vehicles are expected to follow soon after. These actions are significantly reducing the addressable volume for ICEs. Around the same time, Beijing declared its outer ring road as a zero-emission zone for commercial vehicles, leading to the removal of a substantial number of diesel light commercial vehicles (LCVs) within a short period. As a result, manufacturers are now managing dual product lines: zero-emission vehicles for urban areas and ICEs to cater to rural markets. This strategy is diluting the economies of scale previously enjoyed in engine production. With heightened compliance risks and the looming threat of fines, manufacturers are channeling more capital into electric capacities, consequently dampening growth prospects for the automotive engine market.
*Our forecasts treat driver/restraint impacts as directional, not additive. The impact forecasts reflect baseline growth, mix effects, and variable interactions.
Segment Analysis
By Placement Type: Opposed-Piston Advances Amid Efficiency Race
In-line engines controlled 43.36% of the automotive engine market in 2025 by leveraging modular scalability and hybrid compatibility across Toyota’s Dynamic Force and Volkswagen’s EA888 families. Opposed-piston units, although niche, are projected to grow at 2.39% CAGR through 2031 as freight operators validate Achates Power’s two-stroke design, which posts one-third of fuel-economy gains versus conventional diesels and meets EPA 2027 NOₓ rules without selective catalytic reduction.
Ford’s 3.5-liter EcoBoost V6 and GM’s 6.2-liter V8 maintain V-type relevance for towing-oriented pickups, while Subaru’s boxer architecture persists in all-wheel-drive crossovers where a low center of gravity offsets added manufacturing complexity. Regulatory focus on output rather than architecture has encouraged automakers to downsize cylinders yet retain familiar layouts, but the tangible efficiency from opposed-piston trials could swing procurement in long-haul trucking over the forecast window.


By Fuel Type: Hybrid-ICE Configurations Outpace Conventional Combustion
Gasoline held 63.31% of the automotive engine market in 2025, but hybrid-ICE powertrains spanning mild, full, and plug-in systems will expand at a 2.47% CAGR to 2031, the fastest among fuel categories. Toyota’s 2.5-liter Dynamic Force Hybrid achieves thermal efficiency, while Stellantis integrates 48-volt systems on 1.5-liter turbo fours across Jeep and Peugeot models.
Diesel’s retreat in European passenger cars contrasts with its endurance in heavy-duty trucks, where fuel density and refueling speed remain decisive. Natural-gas fleets are growing in urban buses as biomethane delivers sustainable lifecycle CO₂ reductions, and Brazil’s flex-fuel engines preserve the low-cost ethanol advantages. Hydrogen-ICE pilots showcased 300 horsepower outputs in 2025 endurance racing, illustrating a zero-carbon pathway that leverages existing casting and machining assets.
By Vehicle Type: Commercial Segments Lead Growth Arc
Passenger cars accounted for 66.37% of the automotive engine market size in 2025, yet will trail medium and heavy commercial vehicles, which are forecast to grow at a 2.49% CAGR to 2031. Long-haul trucking remains tethered to diesel and emerging hydrogen combustion because current battery chemistries penalize payload and mandate extended charging downtimes.
Light commercial vehicles, powered by efficient 2.0-liter turbos, sustain double-digit fleet additions from e-commerce logistics, while two-wheelers continue to serve rural Asia despite electrification advances in urban corridors. Off-road machinery satisfies Tier 4 Final norms through high-efficiency catalysis, and Caterpillar’s 7.1-liter inline-six launched in 2025 without exhaust-gas recirculation, trimming maintenance cycles for rental fleets.
By Engine Capacity: Downsizing Accelerates to Meet CO₂ Targets
The 1.5-to-3-liter segment captured 54.45% of 2025 volume, yet sub-1.5-liter turbocharged units are poised to expand at a 2.41% CAGR as European and Chinese OEMs chase fleet-average CO₂ ceilings under 95 g/km. Volkswagen’s 1.0-liter TSI three-cylinder became Europe’s best-selling engine in 2025, posting a CO₂ improvement over its 1.6-liter predecessor.
Stellantis’ 1.2-liter PureTech added a 48-volt belt-starter-generator in 2025, enabling cylinder deactivation that trims urban fuel burn by a minimal amount. Engines above 3.0 liters increasingly occupy niche towing and performance roles, with Ford’s 3.5-liter EcoBoost still shipping 450,000 units in 2025 by blending port-direct injection and turbocharging for 400 horsepower in the F-150.
Geography Analysis
Asia Pacific held 38.71% of 2025 global volume and is projected to expand at a 2.45% CAGR through 2031, driven by India’s output surge and ASEAN’s rise as a flexible power-train hub. China remains the world’s largest light-vehicle producer at 26.8 million units, retaining ICE lines for hybrids and exports even as Beijing targets electric vehicle penetration by 2030. Japan’s domestic engine production dipped in 2025 as OEMs shifted capacity to the United States-Mexico-Canada Agreement (USMCA) zones.
In recent years, United States light-vehicle sales have shown strong performance, with internal combustion engine (ICE) vehicles and hybrids dominating the market due to the high demand for full-size trucks that emphasize towing and refueling convenience. Ford’s Kentucky Truck Plant and GM’s Flint Assembly continue to operate at full capacity, producing V6 and V8 engines that comply with EPA Tier 3 standards. In Europe, passenger-car production has experienced a slight decline, influenced by the increasing implementation of urban zero-emission zones. However, Germany’s Salzgitter site has made significant investments to transition towards producing mild-hybrid modules alongside traditional engine units, ensuring job security for thousands of workers.
In South America, the Middle East, and Africa, demand for vehicles remains robust, but the adoption of battery electric vehicles (BEVs) faces challenges due to cost and infrastructure limitations. Brazil has leveraged its competitive advantage in sugarcane ethanol, which is more cost-effective than gasoline, to maintain strong production of flex-fuel vehicles. Meanwhile, Saudi Arabia and the UAE have initiated hydrogen-ICE pilot projects for urban logistics, utilizing their domestic hydrogen production and addressing the thermal challenges associated with lithium-ion batteries in extreme climates. South Africa continues to focus on producing right-hand-drive ICE vehicles for export to sub-Saharan markets, where charging infrastructure is still in its early stages of development.

Competitive Landscape
In the mid-term, the top five producers, Toyota, Volkswagen, Hyundai, General Motors, and Stellantis, held a significant share of the global output, indicating a moderately concentrated market. In a strategic move, Stellantis reduced the number of its ICE platforms, channeling the freed capital into scaling mild-hybrids, while ensuring amortization benefits across its Jeep and Peugeot lines. Meanwhile, Ford announced its decision to halt new investments in ICE platforms in the near future, redirecting its remaining budget towards compliance adjustments and preparing its heavy trucks for hydrogen technology.
Niche leaders like Cummins, Volvo Group, and Caterpillar are at the forefront of the commercial and off-road sectors. They're pioneering the integration of hydrogen and renewable diesel, potentially prolonging the service life of ICEs in demanding duty-cycle environments. Achates Power’s opposed-piston prototypes, boasting significant fuel savings in road tests, have caught the eye of fleets, especially where operating costs outweigh acquisition prices. Companies like Bosch and Continental are leveraging machine-learning algorithms to fine-tune injection, turbo boost, and spark timing. This not only enhances real-time efficiency but also allows for over-the-air calibrations, ensuring the vehicles retain their residual value.
Hydrogen-combustion demonstrations, such as Toyota’s V6 showcased in the GR Corolla H2, achieved commendable performance during endurance events. This success underscores the potential for legacy casting lines to transition to zero-carbon fuels with minimal retooling. Furthermore, patent filings related to variable compression, water-injection knock suppression, and plasma-assisted ignition hint at untapped efficiency potential, suggesting a slower shift from internal combustion engines to electric vehicles in heavy-duty and specialized applications.
Automotive Engine Industry Leaders
Toyota Motor Corporation
Volkswagen AG
Hyundai Motor Group
General Motors
Stellantis N.V.
- *Disclaimer: Major Players sorted in no particular order

Recent Industry Developments
- October 2025: Stellantis granted Tata Motors a license, enabling the latter to develop a mid-sized diesel engine, known for its advanced technology and efficiency, internally. This move allows Tata Motors to enhance its in-house capabilities and strengthen its position in the automotive market by leveraging Stellantis' expertise in engine technology.
- March 2025: In India, Tata Motors has intensified its efforts by conducting comprehensive trials of hydrogen-powered trucks. These trials aim to evaluate the feasibility and efficiency of hydrogen as a sustainable fuel alternative for long-distance transportation. By focusing on this innovative technology, Tata Motors seeks to address the growing demand for eco-friendly solutions in the transportation industry while contributing to the reduction of carbon emissions in the logistics sector.


Research Methodology Framework and Report Scope
Market Definitions and Key Coverage
Our study counts revenue from newly manufactured internal-combustion powertrains, gasoline, diesel, gaseous-fuel, hybrid-ICE, and emerging hydrogen ICE sold to light vehicles, trucks, buses, off-highway, and powersports platforms. Engines delivered as crate units or built in-house by OEMs are both captured, while values reflect factory-gate transfers into the vehicle assembly line.
Scope exclusions include electric drive units, remanufactured engines, and stand-alone engine parts, which are outside the boundary.
Segmentation Overview
- By Placement Type
- In-line
- V-type
- W-type
- Boxer / Flat
- Opposed-piston
- By Fuel Type
- Gasoline
- Diesel
- Natural Gas / CNG
- Hybrid-ICE (Mild, Full, Plug-in)
- Alternative Fuels (Ethanol, LPG, e-Fuels)
- Hydrogen Internal Combustion Engine (ICE)
- By Vehicle Type
- Passenger Cars
- Light Commercial Vehicles
- Medium and Heavy Commercial Vehicles
- Two-Wheelers and Powersports
- Off-road / Agricultural / Construction
- By Engine Capacity
- Below 1.5 L
- 1.5 to 3 L
- Over 3 L
- By Geography
- North America
- United States
- Canada
- Rest of North America
- South America
- Brazil
- Argentina
- Rest of South America
- Europe
- Germany
- United Kingdom
- France
- Italy
- Spain
- Rest of Europe
- Asia Pacific
- China
- India
- Japan
- South Korea
- Rest of Asia Pacific
- Middle East and Africa
- United Arab Emirates
- Saudi Arabia
- South Africa
- Turkey
- Rest of Middle East and Africa
- North America
Detailed Research Methodology and Data Validation
Primary Research
To close gaps, we interview engine design engineers, tier-one suppliers, fleet maintenance heads, and dealer groups across Asia-Pacific, Europe, and the Americas. Their feedback on production schedules, average selling prices, and hybrid uptake helps us recalibrate secondary data and vet early trend inflections.
Desk Research
Mordor analysts first compile production, registration, and trade statistics from bodies such as OICA, ACEA, UN Comtrade, the US Energy Information Administration, and China's CAAM. They then enrich these with regulatory notices, such as Euro 7 drafts and US EPA Tier 3, and patent activity gathered through Questel. Company filings and D&B Hoovers profiles clarify price realizations and segment mix, while news flows on Dow Jones Factiva flag model-launch timelines that reshape near-term demand. This listing is illustrative; many additional open and subscription sources supported fact-finding and cross-checks.
Market-Sizing & Forecasting
A top-down vehicle production and trade rebuild establishes the demand pool, which is then verified by sampled bottom-up roll-ups of selected OEM engine plants and channel checks. Key variables, like regional vehicle output, engine take rates by fuel, average displacement brackets, hybrid penetration, and regulation-driven downsizing, feed a multivariate regression that projects 2026-2030 volumes and ASPs. Where supplier samples under-represent small geographies, ratios from contiguous markets are applied before final triangulation.
Data Validation & Update Cycle
Outputs face variance screens versus historical series and peer metrics, followed by a two-level internal review. The model is refreshed annually; material events, for example, a sudden Euro 7 delay, trigger interim updates, and an analyst re-validates numbers just before publication.
Why Mordor's Automotive Engine Baseline Commands Reliability
Published estimates often diverge because firms choose unequal scope, input sets, and refresh cadences. Our disciplined boundary setting, variable selection, and yearly revisions anchor a figure decision-makers can trace with ease.
Key gap drivers include some publishers bundling engine parts or electric drive units, others applying flat ASP escalation without validating real contract data, and several relying solely on shipment value without regional displacement filters that Mordor applies.
Benchmark comparison
| Market Size | Anonymized source | Primary gap driver |
|---|---|---|
| USD 84.44 Bn (2025) | Mordor Intelligence | |
| USD 95.95 Bn (2024) | Global Consultancy A | Includes engine parts and e-drive units; uses single top-down path |
| USD 104.10 Bn (2024) | Trade Journal B | Assumes uniform 6 % price inflation; limited primary validation |
| USD 96.80 Bn (2022) | Independent Research C | Historical base year, no adjustment for EV substitution |
In short, by aligning scope strictly to new ICE powertrains, blending authoritative data streams with on-ground intelligence, and running multi-step reviews, Mordor Intelligence delivers a balanced, transparent baseline that clients can rely on for strategic and tactical decisions.


Key Questions Answered in the Report
What is the current value of the automotive engine market?
The automotive engine market size reached USD 85.17 billion in 2026 and is projected to hit USD 95.75 billion by 2031.
How fast is demand for hybrid-ICE powertrains growing?
Hybrid-ICE configurations are expected to register a 2.47% CAGR between 2026 and 2031, the quickest among fuel segments.
Which region dominates engine production?
Asia Pacific captured 38.71% of global volume in 2025, underpinned by China’s and India’s manufacturing scale.
Why are opposed-piston engines gaining attention?
Fleet tests show opposed-piston diesels can boost fuel economy by about 30% compared with conventional four-stroke alternatives.
How are zero-emission urban zones affecting ICE sales?
Expanding bans and daily charges in cities such as London and Paris are shrinking ICE passenger-car demand within metropolitan limits.
What fuels could extend the life of internal combustion engines?
Synthetic e-fuels and hydrogen combustion are emerging as drop-in or low-retrofit options that comply with stringent CO₂ targets.
Page last updated on:


