Market Overview
| Study Period | 2019 - 2031 |
|---|---|
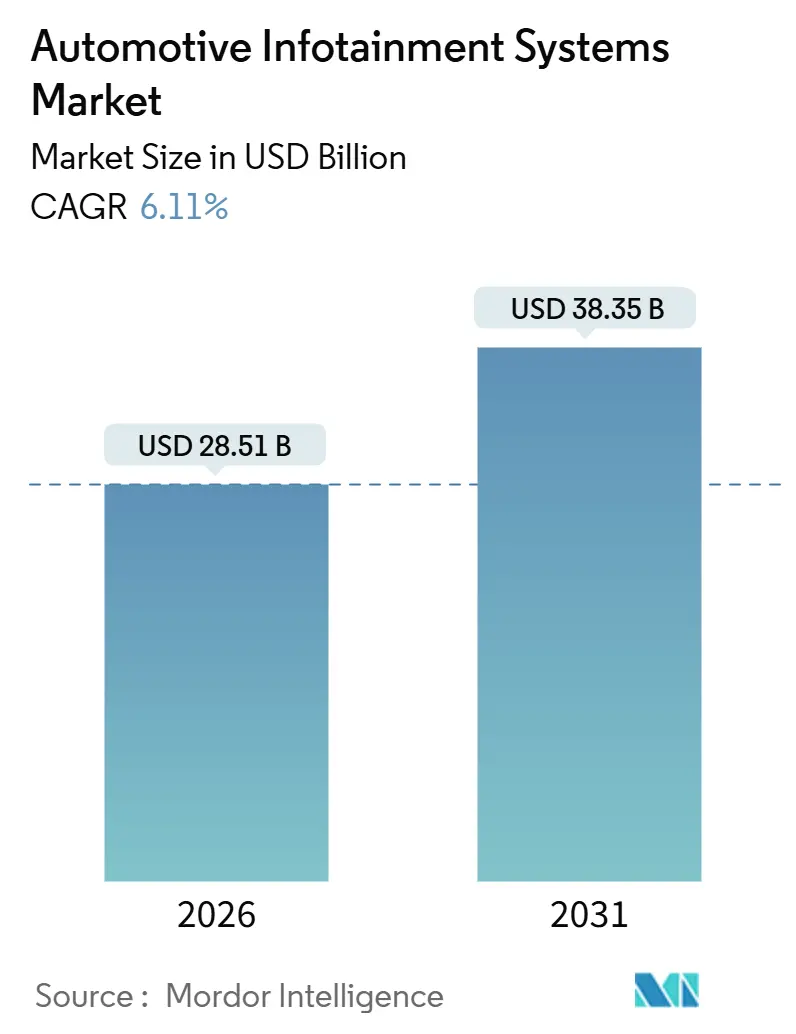
| Market Size (2026) | USD 28.51 Billion |
| Market Size (2031) | USD 38.35 Billion |
| Growth Rate (2026 - 2031) | 6.11% CAGR |
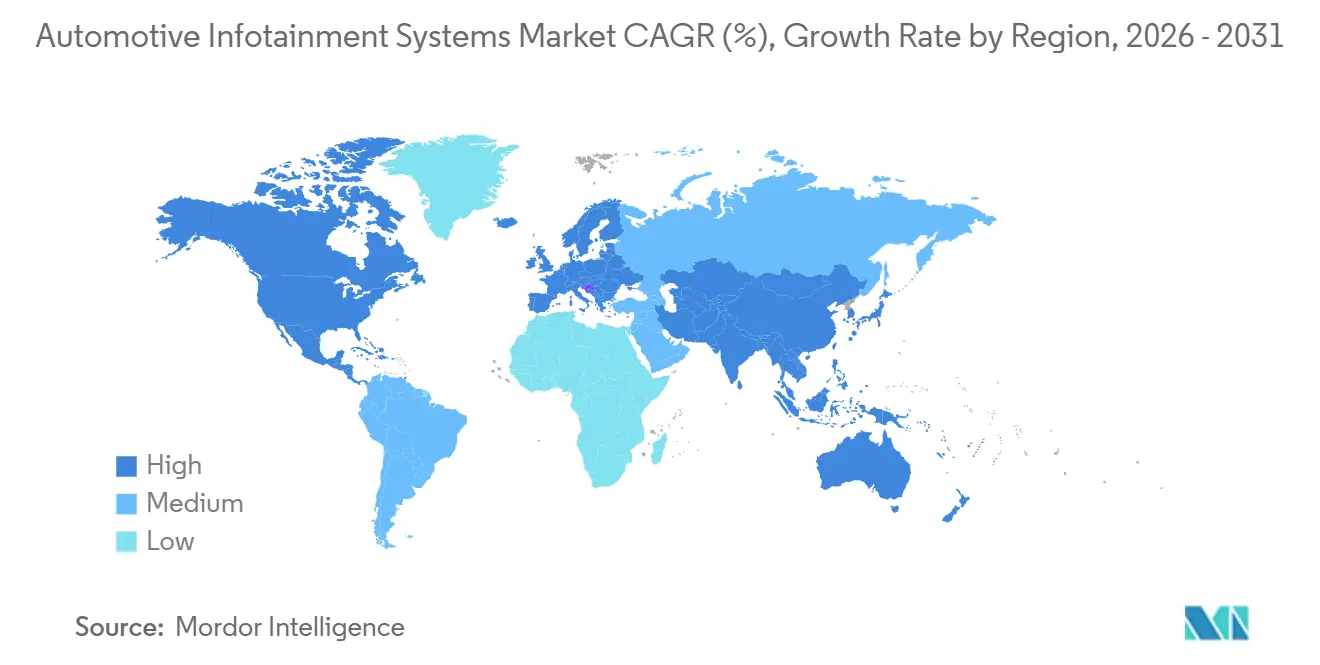
| Fastest Growing Market | South America |
| Largest Market | Asia-Pacific |
| Market Concentration | Medium |
Major Players *Disclaimer: Major Players sorted in no particular order Image © Mordor Intelligence. Reuse requires attribution under CC BY 4.0. | |
Automotive Infotainment Systems Market Analysis by Mordor Intelligence
The Automotive Infotainment Systems Market size is estimated at USD 28.51 billion in 2026, and is expected to reach USD 38.35 billion by 2031, at a CAGR of 6.11% during the forecast period (2026-2031). This momentum reflects the pivot from hardware-centric dashboards to software-defined cockpits, where over-the-air updates, 5G telematics, and generative AI assistants are reshaping user experience and revenue models. Automakers are merging infotainment, driver monitoring, and ADAS visualization on single domain controllers to compress bill-of-materials cost, while eCall regulations and battery-electric-vehicle adoption broaden the installed base of connected head units. Semiconductor firms and cloud-native software suppliers are challenging tier-1 incumbents, and subscription economics are gaining prominence as OEMs seek to offset lost service revenue from electrified powertrains. Geopolitical supply-chain risk and cybersecurity compliance under UNECE WP.29 remain key watchpoints for the automotive infotainment systems market [1]“WP.29 World Forum for Harmonization of Vehicle Regulations,” United Nations Economic Commission for Europe, unece.org .
Key Report Takeaways
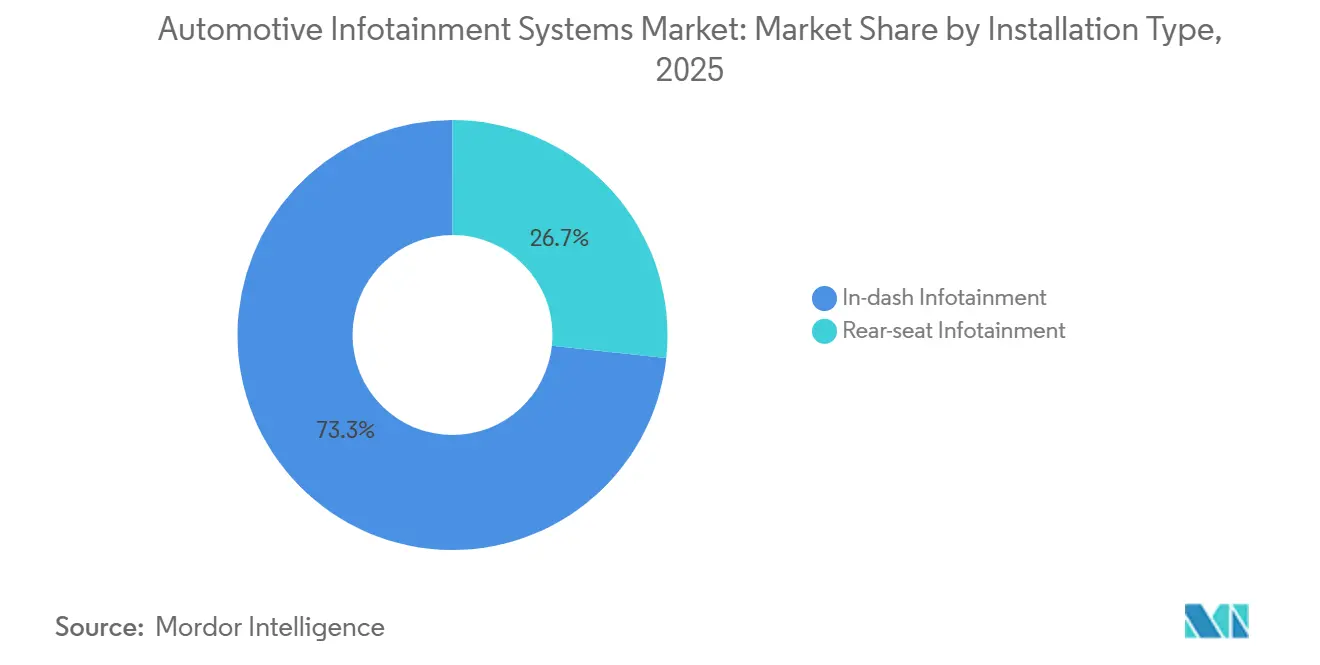
- By installation type, in-dash systems held 73.27% of the automotive infotainment systems market share in 2025, while rear-seat entertainment is expanding at a 6.13% CAGR through 2031.
- By vehicle type, passenger cars commanded an 81.31% share in 2025; light commercial vehicles are advancing at a 6.18% CAGR through 2031.
- By component, head units and domain controllers accounted for 43.43% of revenue in 2025, whereas operating-system software and apps are growing at a 6.27% CAGR.
- By propulsion, internal combustion vehicles still represented 66.71% of installations in 2025, yet battery electric vehicles are increasing at a 6.15% CAGR.
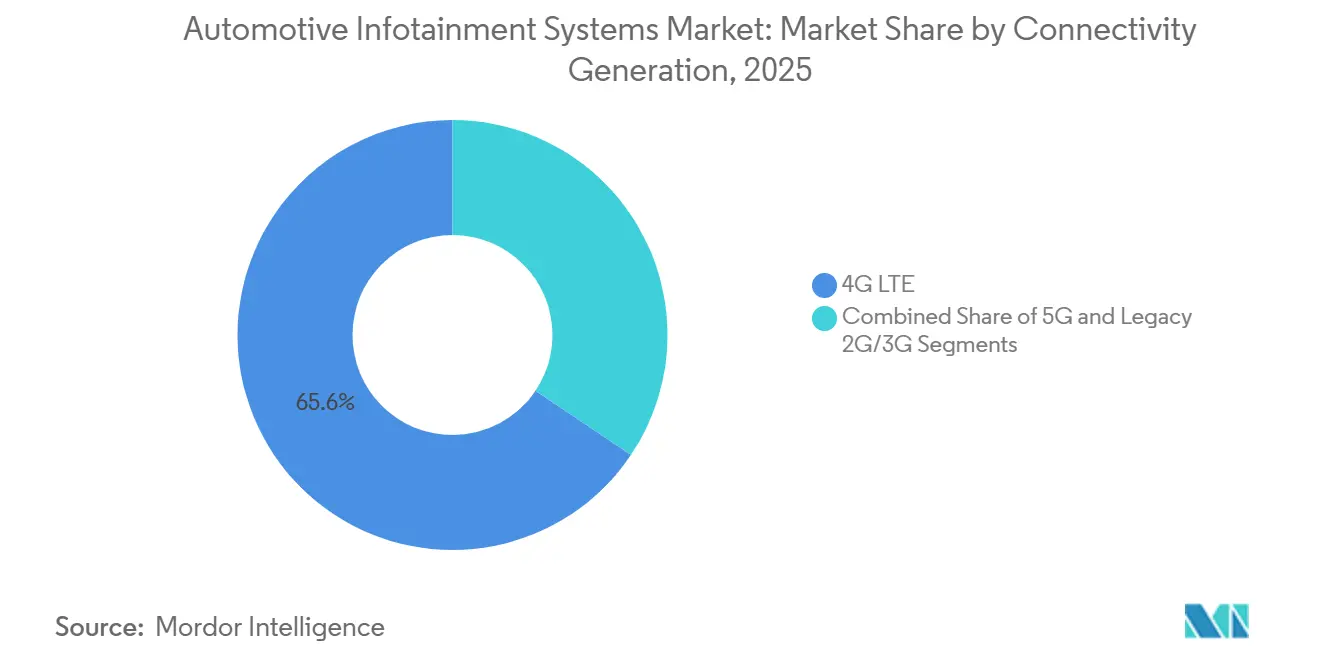
- By connectivity, 4G LTE captured 65.64% share in 2025; 5G connectivity is moving ahead at a 6.21% CAGR.
- By operating system, Linux-based platforms, including Android Automotive OS, held a 36.12% share in 2025, and Android Automotive OS alone is rising at a 6.29% CAGR.
- By sales channel, OEM-installed systems dominated with 87.72% share in 2025, while the aftermarket is expanding at a 6.24% CAGR.
- By geography, Asia Pacific led with 38.77% share in 2025; South America is forecast to post the fastest regional growth at a 6.17% CAGR through 2031.
Note: Market size and forecast figures in this report are generated using Mordor Intelligence’s proprietary estimation framework, updated with the latest available data and insights as of January 2026.
Global Automotive Infotainment Systems Market Trends and Insights
Drivers Impact Analysis*
| Driver | (~) % Impact on Market CAGR | Geographic Relevance | Impact Timeline |
|---|---|---|---|
| Consumer Demand for Connected Services & 5G Roll-out | +1.4% | Global, led by North America, Europe, and Asia Pacific urban centers | Short term (≤ 2 years) |
| Shift toward Software-Defined Vehicles & Digital Cockpits | +1.3% | Global, with leadership in Europe (Germany) and China | Medium term (2-4 years) |
| Integration of ADAS-Centric HMI into Infotainment Head Units | +1.2% | Global, with early adoption in Europe and North America | Medium term (2-4 years) |
| Mandatory eCall & Data-Logging Regulations | +0.8% | South America (Brazil), Asia Pacific (India), Middle East & Africa | Short term (≤ 2 years) |
| Cloud-Native Updates Enabling Feature-on-Demand | +0.7% | Global, with North America and Europe leading subscription adoption | Medium term (2-4 years) |
| In-Car E-commerce / App-Store Monetisation | +0.6% | North America and Europe; emerging in Asia Pacific | Long term (≥ 4 years) |
| Source: Mordor Intelligence | |||


Consumer Demand for Connected Services and 5G Roll-out
Two-fifths of global car owners would consider switching brands for a better infotainment user experience, rising to nearly half in Germany. AT&T began delivering 5G connectivity to Toyota and Lexus vehicles in 2025, enabling real-time rerouting, cloud voice assistants, and low-latency V2X messaging [2]“AT&T and Toyota Bring 5G Connectivity to Select 2025 and 2026 Models,” AT&T, att.com. Network slicing reserves bandwidth for safety traffic while simultaneously streaming 4K video to rear seats, a capability 4G LTE struggles to match. General Motors embedded Apple Music natively across 2025 and 2026 models, offering eight years of free streaming to encourage brand loyalty.
Shift Toward Software-Defined Vehicles and Digital Cockpits
Through over-the-air delivery, software-defined architectures have significantly reduced the feature lag, enabling much faster updates. Toyota's upcoming RAV4, leveraging the Arene platform, is set for continuous updates. Meanwhile, BMW's Operating System X will make its debut on the Neue Klasse in the near future, allowing the automaker to maintain control over data and its monetization. As OEMs increasingly take charge of developing the user-interface layer, Tier-1 suppliers are shifting their focus towards middleware services. Industry projections indicate that automotive software revenue will experience substantial growth in the coming years, with infotainment, connectivity, and security taking a significant share. Suppliers lacking the ability to scale their software talent face the risk of displacement, especially as hardware edges closer to commoditization.
Integration of ADAS-Centric HMI Into Infotainment Head Units
Centralizing ADAS visualization on a single screen not only reduces the number of electronic control units but also accelerates the introduction of advanced driver-assistance features. NXP's i.MX 95 processor integrates real-time safety functions with infotainment tasks, achieving a significant reduction in computing costs. Mercedes-Benz is set to debut its MBUX Surround Navigation on the upcoming CLA model, integrating lane-keeping cues and real-time environmental data onto the primary display, enhancing the cabin's uniqueness. Luxury automakers are swiftly adopting domain controllers, with industry experts predicting widespread adoption of unified computing platforms in the near future. Under ISO 26262, regulatory oversight intensifies the accountability of infotainment glitches on safety visuals, necessitating thorough validation and ongoing updates.
Mandatory eCall and Data-Logging Regulations in Emerging Markets
Brazil’s 2024 eCall mandate drives standard fitment of cellular modems and GPS receivers, pushing connectivity into every new vehicle and enabling subscription services at low incremental cost. India followed similar rules, and Turkey and South Africa are drafting frameworks for 2026. Domestic data storage clauses require global OEMs to localize cloud infrastructure, raising cost for low-volume importers but guaranteeing data sovereignty for regulators and consumers.
Restraints Impact Analysis*
| Restraint | (~) % Impact on Market CAGR | Geographic Relevance | Impact Timeline |
|---|---|---|---|
| Cost Sensitivity in Entry-Level Models | -0.9% | Global, acute in South America, Asia Pacific (India, Southeast Asia), and Africa | Short term (≤ 2 years) |
| Cyber-security & Liability Risks | -0.7% | Global, with heightened regulatory scrutiny in Europe (UNECE WP.29) and North America | Medium term (2-4 years) |
| Automotive SoC Supply-Chain Volatility | -0.6% | Global, with bottlenecks in Asia Pacific (Taiwan, South Korea) affecting all regions | Short term (≤ 2 years) |
| Right-to-Repair & Data-Ownership Legislation | -0.4% | North America (Massachusetts, California) and Europe (EU Right-to-Repair Directive) | Long term (≥ 4 years) |
| Source: Mordor Intelligence | |||
Cost Sensitivity in Entry-Level Models
Price-conscious buyers in emerging markets often forgo touchscreens and connectivity to hit sub-USD 15,000 price points. In India, base trims of the Maruti Suzuki Alto ship with analog clusters, limiting the installed base for premium head units. Chinese entrants intensify price pressure, forcing incumbents to absorb infotainment costs or risk share erosion. Aftermarket Android head units priced at USD 150–300 offer partial remedies but lack deep vehicle integration. The delay in connected adoption restrains network effects vital for app-store ecosystems.
Cybersecurity and Liability Risks
UNECE WP.29 and ISO/SAE 21434 require threat monitoring, incident response, and secure update processes, adding USD 50–100 to per-vehicle certification cost and extending development timelines by up to a year. Generative AI assistants increase the attack surface, and insurers are raising premiums for highly connected vehicles. Fleet operators sometimes disable OTA channels to avoid zero-day exploits, undercutting the business case for continuous software monetization.
*Our forecasts treat driver/restraint impacts as directional, not additive. The impact forecasts reflect baseline growth, mix effects, and variable interactions.
Segment Analysis
By Installation Type: Rear-Seat Entertainment Expands Premium Appeal
The automotive infotainment systems market registered a 73.27% dominance for in-dash units in 2025, yet rear-seat installations are projected to post a 6.13% CAGR through 2031. Luxury OEMs deploy 8K screens and cloud gaming to transform back seats into living spaces and justify up-market pricing. BMW’s 31.3-inch Theatre Screen and Mercedes-Benz’s dual-screen MBUX rear system illustrate the move toward immersive entertainment that operates only when parked or in autonomous mode. Suppliers focus on modular architectures that share GPUs and memory between front and rear zones to curb duplication of costly silicon.
A second trend is regulatory. UNECE dictates that driver-facing displays show mandatory safety visuals, cementing in-dash primacy, while rear-seat content remains discretionary. Rear-seat setups command higher per-unit revenue—USD 3,000–5,000 in flagship models—creating a profitable niche even though overall volumes trail front displays. Streaming providers align with this niche; Xbox Cloud Gaming leveraged LG partnerships in 2025 to reach vehicle cabins without onboard consoles, supporting the growth trajectory of the automotive infotainment systems market.

By Vehicle Type: Fleet Digitalization Lifts Light Commercial Vehicles
Passenger cars accounted for 81.31% of the automotive infotainment systems market size in 2025, reinforcing their mass-market status. Light commercial vehicles are forecast to clock a 6.18% CAGR as logistics firms prioritize telematics, electronic logging, and driver coaching. Indian start-up Euler Motors has equipped its electric delivery vans with a 10-inch Chimera head unit that integrates geofencing and predictive maintenance dashboards, signaling a shift in LCV infotainment from entertainment to mission-critical fleet software.
The commercial segment experiences ruggedization challenges. Fleets demand MIL-STD-810-rated hardware to withstand vibration and dust, which adds minimal cost to components. Yet subscription attach rates are higher; fleet operators willingly pay USD 30–50 per month for connected services that shave fuel use and insurance premiums. OEMs that harmonize passenger-car user-interface learnings with fleet durability stand to gain incremental revenue and strengthen the automotive infotainment systems market.
By Component: Software Captures Growing Margin Pool
Head units and domain controllers contributed 43.43% to 2025 revenue, but operating-system software and apps are projected to increase at a 6.27% CAGR through 2031. BMW’s in-house Operating System X, built on the Android Open Source Project, illustrates the strategic shift from hardware to recurring licenses. Larger, higher-resolution screens still generate hardware upsell—Volvo’s 2026 XC60 display boosts pixel density by one-fifth—yet software dominates incremental margin.
Hardware commoditization spurs tier-1 suppliers to invest in middleware. Elektrobit, BlackBerry QNX, and Wind River monetize hypervisors and secure communication stacks that sit atop SoCs from Qualcomm or NXP. As the automotive infotainment systems market transitions toward software-defined value, suppliers lacking deep code portfolios could face margin compression or displacement.
By Propulsion Type: Battery-Electric Vehicles Lead Feature Velocity
Internal combustion vehicles made up 66.71% of installations in 2025, yet battery electric vehicles will expand at a 6.15% CAGR. Touchscreens grow beyond 15 inches; Tesla’s refreshed Model 3 employs an AMD Ryzen platform for console-grade gaming, and BYD’s rotating display caters to portrait social-media scrolling when stationary. Hybrid models bridge the gap, offering EV routing and charge-station search functions that proceed through the same software pipeline.
BEV infotainment merges with home electronics. Polestar enables Google Home device control from the cabin, integrating vehicle and domestic ecosystems. Functional-safety complexity rises because infotainment must coordinate thermal management during fast charging to avoid battery overheating. These technical nuances accelerate R&D cycles and enrich the automotive infotainment systems market.
By Connectivity Generation: 5G Enables New Service Layers
4G LTE still held 65.64% market share in 2025, but 5G connections will record a 6.21% CAGR. AT&T supplies 5G to Toyota and Lexus models, while Qualcomm’s Snapdragon Digital Chassis fuses modem and application processor to trim the bill of materials. Carriers sunsetting 3G and soon 2G networks compel retrofit programs to preserve connected services in older cars, indirectly supporting aftermarket activity.
Network slicing under 5G allows OEMs to buy guaranteed low-latency bandwidth for safety-critical V2X while streaming entertainment on a best-effort basis. European trials with Volvo and Telenor demonstrated sub-20 millisecond end-to-end latency. Rural coverage gaps persist, meaning 5G exclusive features will concentrate in urban corridors until at least 2027. Nevertheless, the advent of 5G underpins richer service bundles and expands the automotive infotainment systems market.

By Operating System: Android Automotive OS Accelerates Adoption
Linux-based platforms, led by Android Automotive OS, represented 36.12% market share in 2025, and Android Automotive OS alone is projected to post a 6.29% CAGR. Volvo, Renault, and Honda leverage native Google Maps and Play Store integration to bypass smartphone mirroring. BlackBerry QNX keeps a foothold in safety-critical domains with ISO 26262 certification, but its closed ecosystem limits third-party apps.
OEMs weigh data control against ecosystem depth. BMW built Operating System X on the AOSP stack without bundling Google Automotive Services, keeping first-party data while allowing selective third-party app entry. Regulatory scrutiny over data sovereignty may force regional variants, but the gravitational pull of a unified developer ecosystem favors open platforms and fuels the growth outlook for the automotive infotainment systems market.
By Sales Channel: Aftermarket Retains a Niche
OEM installations held 87.72% share in 2025, yet aftermarket upgrades show a 6.24% CAGR among price-sensitive owners of older vehicles. Pioneer’s USD 400 wireless CarPlay head unit suits aging fleets in emerging markets. Right-to-repair rules erode OEM lock-in and let independent shops reflash factory systems, dampening the incentive for hardware replacement. Aftermarket suppliers, therefore, pivot to premium audio, advanced driver-assistance retrofits, and niche integrations such as off-road navigation.
OEM systems maintain deep CAN bus integration and OTA support, advantages difficult for aftermarket units to match. Over time, as eCall mandates push embedded modems into every new vehicle, the mainstream value proposition may shift entirely to first-fit systems, but enthusiast and legacy niches keep the aftermarket thread alive within the automotive infotainment systems market.
Geography Analysis
Asia Pacific held 38.77% of the automotive infotainment systems market in 2025, driven by China's substantial production of new-energy vehicles and India's swift embrace of connected cars. In early 2025, Japan rolled out a considerable number of passenger vehicles featuring Toyota's Arene multimedia, while South Korea's Hyundai Mobis showcased holographic head-up displays, highlighting the region's integrated automotive ecosystem. While TSMC and Samsung dominate the semiconductor supply, tensions surrounding Taiwan present potential disruptions. Meanwhile, Southeast Asian nations like Vietnam, though currently modest players, are becoming increasingly receptive to Chinese OEMs offering competitive, feature-rich infotainment systems.
South America is projected to register the fastest growth at a 6.17% CAGR through 2031 as Brazil’s 2024 eCall requirement forces cellular connectivity into every new vehicle. In 2025, Argentina's vehicle registrations grapple with aggressive Chinese brands, leveraging advanced infotainment features to challenge established players. Despite hurdles like regional payment fragmentation and currency fluctuations, savvy OEMs can turn connectivity into a steady revenue stream by localizing content, billing, and cloud services.
Europe and North America, while established, remain vibrant. European nations, led by Germany, the UK, and France, are at the forefront of deploying software-defined cockpits, spurred by the General Safety Regulation II's push for ADAS visualization. The U.S. is capitalizing on the 5G rollout and a burgeoning electric vehicle market—evident from the growing EV sales in 2024—integrating features like streaming infotainment for enhanced customer loyalty. Canada is closely following U.S. trends, while the Middle East and Africa see growth concentrated in the UAE and Saudi Arabia. Notably, Turkey and South Africa are gearing up for eCall regulations, promising to amplify connectivity benefits throughout the region.

Competitive Landscape
The automotive infotainment systems market is moderately fragmented. Tier-1 suppliers like Harman, Bosch, Continental, Denso, and Visteon now contend with heightened competition from Qualcomm, Nvidia, and NXP. They also face challenges from software-centric firms such as Elektrobit and BlackBerry QNX. Qualcomm’s Snapdragon Cockpit Elite, now powering systems for BMW, Volvo, and General Motors, boasts significant graphics enhancement. It adeptly manages both ADAS and entertainment tasks on a single SoC. In a strategic move, Harman teamed up with Qualcomm in recent years, integrating Luna AI avatars with Ready Vision's augmented-reality features. This collaboration targets European and Chinese automakers, emphasizing the industry's shift towards emotionally attuned cabins.
There's potential in fleet-focused infotainment and retrofitting solutions for older vehicles. In a notable shift, Xbox partnered with LG in recent years, integrating cloud gaming into rear-seat displays, sidestepping conventional suppliers. BMW's patent on its Panoramic Vision HUD, which spans the windshield, underscores a growing emphasis on proprietary intellectual property in augmented-reality.
To avoid being sidelined as value shifts upwards, traditional hardware vendors must bolster their software and cloud proficiencies. Aptiv's recent introduction of a software-defined architecture, which seamlessly integrates infotainment, telematics, and body control, highlights the strategic evolution needed to succeed in the dynamic automotive infotainment landscape.
Automotive Infotainment Systems Industry Leaders
Denso Corporation
Harman International
Aisin Corporation
Pioneer Corporation
Continental AG
- *Disclaimer: Major Players sorted in no particular order

Recent Industry Developments
- January 2025: Qualcomm and Amazon announced a technology collaboration to enhance in-vehicle experiences using Snapdragon Cockpit Platform and Amazon's AI services, enabling automakers to deliver innovative in-car experiences while reducing development time and costs through virtual development environments.
- January 2025: Mercedes-Benz and Google Cloud expanded their partnership to enhance MBUX Virtual Assistant with AI-powered conversational capabilities, debuting in the new Mercedes-Benz CLA with Automotive AI Agent built on Google's Gemini models for natural-language navigation queries.
- October 2024: Renault and Cerence expanded their partnership to integrate generative AI into Renault's in-car companion Reno, debuting in the Renault 5 E-Tech electric vehicle with Cerence Chat Pro, an automotive-grade large language model for human-like interactions


Research Methodology Framework and Report Scope
Market Definitions and Key Coverage
Our study treats the automotive infotainment systems market as the total annual value of factory-fitted and aftermarket head-unit hardware, integrated displays, embedded operating-system software, and associated connectivity modules that deliver navigation, media, telematics, and app functions inside passenger cars and commercial vehicles.
Scope exclusion: pure audio radios without a display, portable navigation devices, and smartphone apps that run independently of the in-car head unit are left outside this boundary.
Segmentation Overview
- By Installation Type
- In-dash Infotainment
- Rear-seat Infotainment
- By Vehicle Type
- Passenger Cars
- Light Commercial Vehicles
- Medium and Heavy Commercial Vehicles
- By Component
- Display / Touch-screen Module
- Head Unit / Domain Controller
- Operating-System Software & Apps
- Connectivity ICs & Antenna Modules
- By Propulsion Type
- Internal-Combustion Engine Vehicles
- Battery Electric Vehicles
- Hybrid Electric Vehicles
- By Connectivity Generation
- 4G LTE
- 5G
- Legacy 2G/3G
- By Operating System
- Linux-Based (AAOS, AGL, etc.)
- QNX
- Android Automotive OS
- Others (Proprietary, RTOS)
- By Sales Channel
- OEM-Installed
- Aftermarket
- By Geography
- North America
- United States
- Canada
- Rest of North America
- South America
- Brazil
- Argentina
- Rest of South America
- Europe
- Germany
- United Kingdom
- France
- Italy
- Spain
- Rest of Europe
- Asia Pacific
- China
- India
- Japan
- South Korea
- Rest of Asia Pacific
- Middle East and Africa
- United Arab Emirates
- Saudi Arabia
- South Africa
- Turkey
- Rest of Middle East and Africa
- North America
Detailed Research Methodology and Data Validation
Primary Research
Mordor analysts interviewed head-unit engineers, connectivity chipset vendors, dealer groups, and fleet operators across Asia-Pacific, Europe, and North America. These conversations clarified real-world 4G-to-5G transition rates, ASP erosion, and regional feature bundles, allowing us to fine-tune penetration assumptions and cross-check preliminary model outputs.
Desk Research
We began by mapping unit production and fit-rate trends from publicly available datasets such as OICA light-vehicle output, ACEA registration dashboards, and NHTSA equipment mandates, which set the outer demand pool. Trade filings on UN Comtrade, patent counts extracted through Questel, and tariff-coded import values from Volza helped us benchmark average selling prices. Complementary insight flowed from company 10-Ks, investor days, and tier-1 supplier presentations, while D&B Hoovers provided spend splits for leading cockpit-electronics makers. The sources listed illustrate the mix; many additional databases and open publications were consulted to validate specific datapoints and definitions.
Market-Sizing & Forecasting
A top-down build starts with yearly vehicle production and in-operation parc, which are then paired with infotainment fit rates by vehicle class and propulsion type. Resulting unit counts are multiplied by region-specific ASPs; selective bottom-up roll-ups of leading supplier revenues and channel checks anchor the totals. Key model inputs include: 1) global passenger-car output, 2) EV share of production, 3) average screen size migration, 4) 5G module attach rate, and 5) software update monetization per vehicle. Multivariate regression links these drivers to historical spending, while scenario analysis frames upside and downside trajectories. Data gaps in supplier roll-ups are bridged using normalized ASP ranges derived from disclosed contract awards.
Data Validation & Update Cycle
Outputs pass through variance checks against external market ratios, followed by peer review among senior Mordor analysts. Material anomalies trigger re-contact of sources. The dataset is refreshed each year, with interim updates issued when regulatory shifts or major OEM design wins move the baseline.
Why Mordor's Automotive Infotainment Systems Baseline Commands Reliability
Published values often diverge because firms choose different product mixes, exchange-rate vintages, and refresh cadences.
Key gap drivers stem from whether aftermarket kits are counted, how embedded software revenue is allocated, and the timing of EV-driven feature upgrades. Mordor reports a balanced base year, updates annually, and discloses scope rules, whereas several publishers rely on older shipment snapshots or exclude software fees, leading to variance.
Benchmark comparison
| Market Size | Anonymized source | Primary gap driver |
|---|---|---|
| 28.53 B (2025) | Mordor Intelligence | - |
| 27.30 B (2023) | Global Consultancy A | Older base year and inflation roll-forward, limited ASP refresh |
| 16.40 B (2024) | Industry Journal B | Omits aftermarket units and software licensing revenue |
| 26.72 B (2024) | Research Firm C | Includes telematics hardware but excludes subscription upgrades |
The comparison shows that once scope, year, and pricing logic are aligned, Mordor's disciplined blend of public statistics, expert insight, and dual-path modeling offers the most transparent, decision-ready baseline for planners and investors.


Key Questions Answered in the Report
What revenue growth is expected for automotive infotainment between 2026 and 2031?
The automotive infotainment systems market is projected to expand from USD 28.51 billion in 2026 to USD 38.35 billion by 2031, reflecting a 6.11% CAGR.
Which connectivity technology will gain the most traction inside vehicles by 2031?
5G telematics will record the fastest uptake, rising at a 6.21% CAGR as carriers deploy network slicing and ultra-low-latency services for V2X communication.
Why are automakers emphasizing software-defined cockpits?
Software-defined architectures allow over-the-air feature rollouts, reduce hardware complexity through domain controllers, and create subscription revenue streams that offset declining service income from electric powertrains.
How do eCall regulations influence infotainment demand in emerging markets?
Mandatory eCall requirements in Brazil, India, and pending rules in Turkey and South Africa force every new vehicle to carry cellular modems and GPS, embedding connected infotainment capability by default and opening doors for paid services.
What is the main cybersecurity challenge for next-generation infotainment?
Compliance with UNECE WP.29 and ISO/SAE 21434 introduces stringent processes for threat detection, secure updates, and liability management, adding cost and extending development timelines while safeguarding against fleet-wide exploits.
Page last updated on:


