Agritech Market Size and Share
Market Overview
| Study Period | 2021 - 2031 |
|---|---|
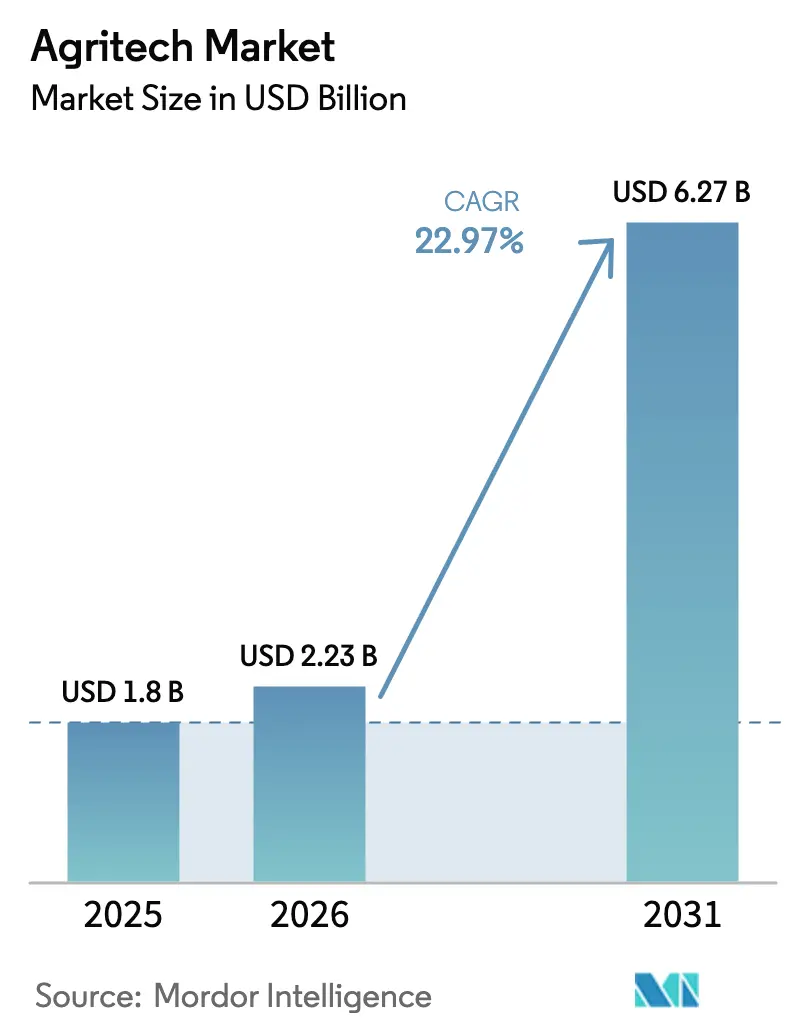
| Market Size (2026) | USD 2.23 Billion |
| Market Size (2031) | USD 6.27 Billion |
| Growth Rate (2026 - 2031) | 22.97% CAGR |
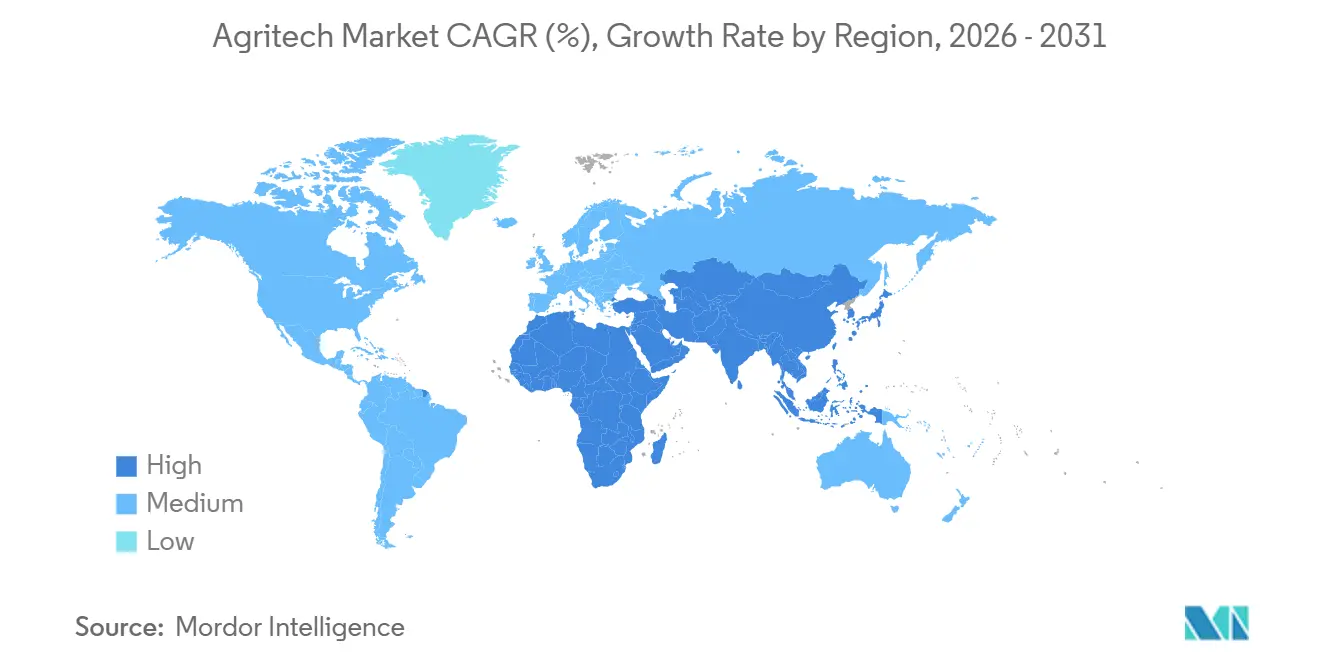
| Fastest Growing Market | Asia Pacific |
| Largest Market | North America |
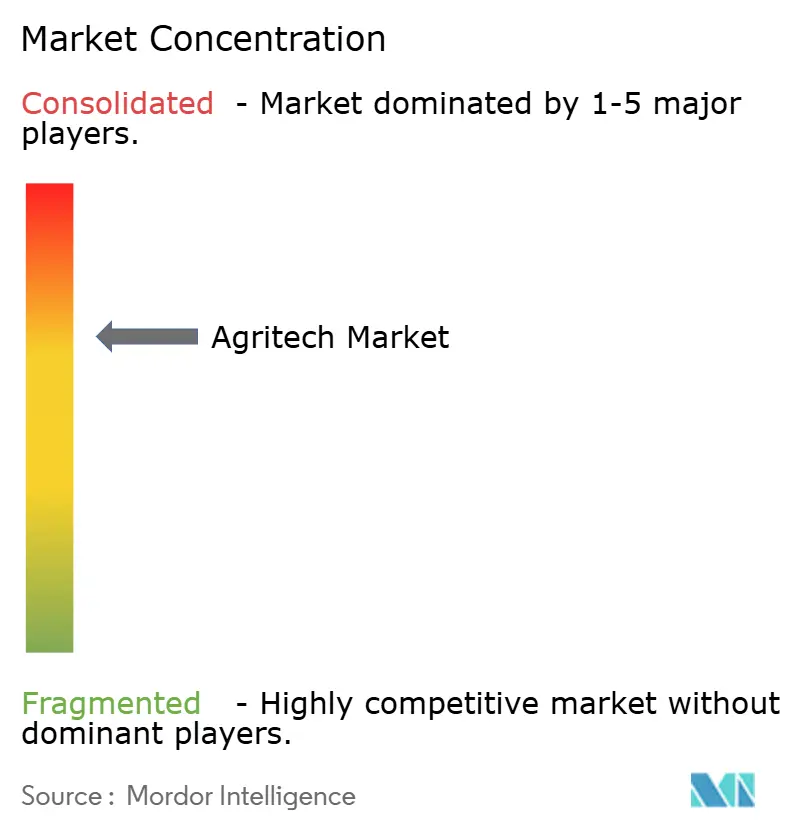
| Market Concentration | Medium |
Major Players *Disclaimer: Major Players sorted in no particular order Image © Mordor Intelligence. Reuse requires attribution under CC BY 4.0. | |
Agritech Market Analysis by Mordor Intelligence
The Agritech market size is anticipated to grow from USD 1.8 billion in 2025 to USD 2.23 billion in 2026 and is forecast to reach USD 6.27 billion by 2031 at a 22.97% CAGR over 2026-2031. Farms are redirecting capital toward subscription access to autonomous robots priced below USD 50,000, while on-device analytics cut cloud latency and data-transfer costs. Rural broadband grants in the United States and large farmer-database programs in India signal that public funding is converging on connectivity gaps and data infrastructure. At the same time, the European Union is tying subsidies to precise documentation of soil-carbon gains, turning data sets into a parallel revenue stream beyond crop sales. The Agritech market now benefits from simultaneous cost deflation in sensors, rapid gains in edge-AI chips (edge Artificial Intelligence chips), and an acute labor shortfall that pushes growers toward full automation.
Key Report Takeaways
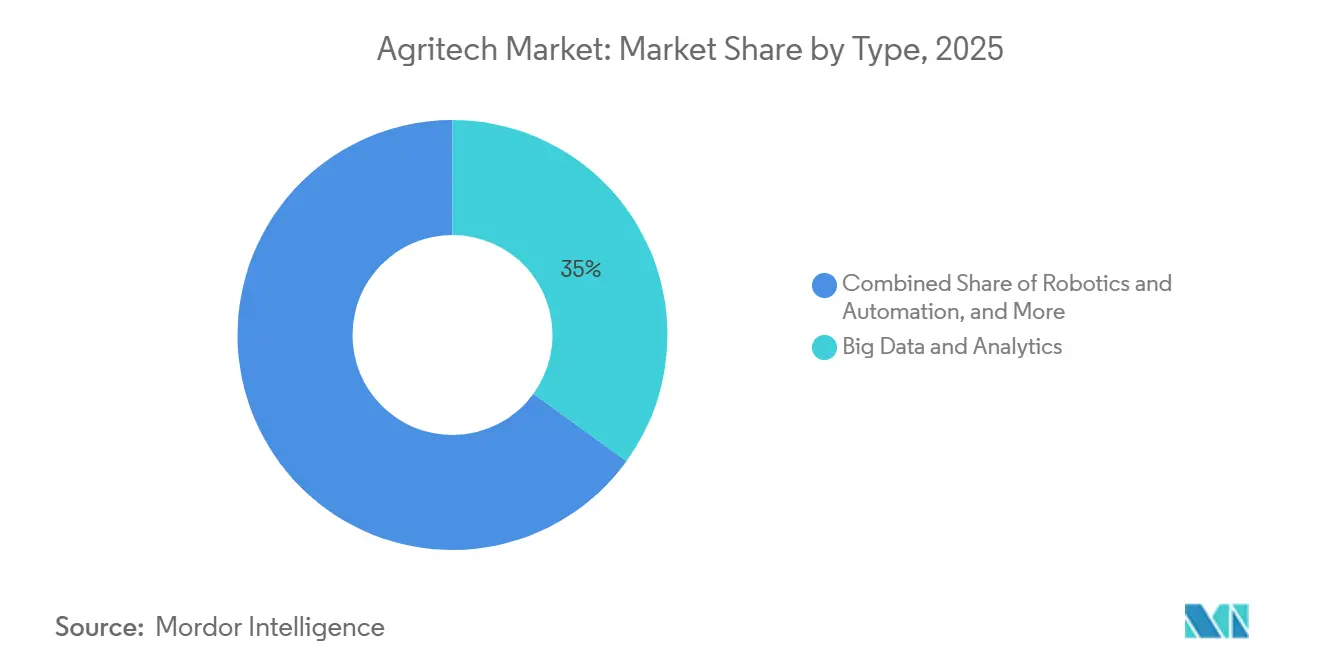
- By type, big data and analytics held 35% of the Agritech market share in 2025, whereas robotics and automation are advancing at a 29% CAGR between 2026 and 2031.
- By application, broad-acre operations accounted for 45% of the Agritech market size in 2025, while indoor and vertical farming are expanding at a 31% CAGR between 2026 and 2031.
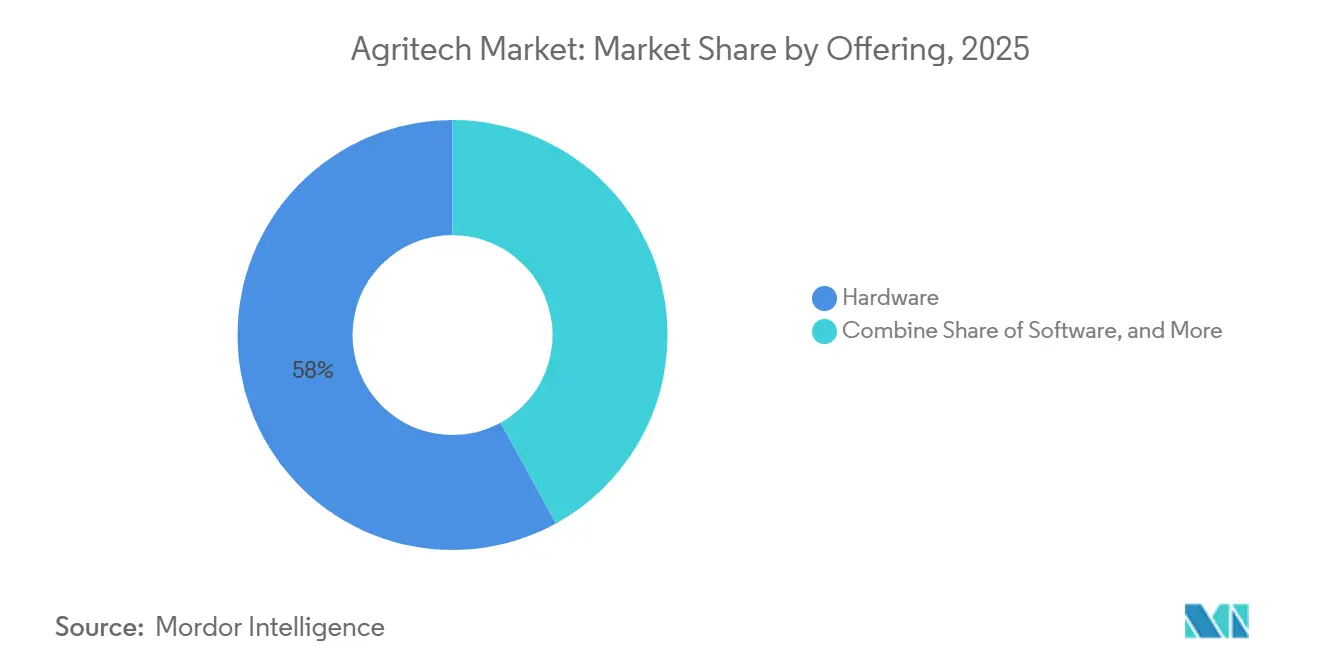
- By offering, hardware accounted for 58% of the Agritech market revenue in 2025, and services are forecast to rise at a 29.5% CAGR between 2026 and 2031.
- By geography, North America led with 41% Agritech market share in 2025, and Asia-Pacific is on track for a 27.5% CAGR during 2026-2031.
Note: Market size and forecast figures in this report are generated using Mordor Intelligence’s proprietary estimation framework, updated with the latest available data and insights as of January 2026.
Global Agritech Market Trends and Insights
Drivers Impact Analysis*
| Driver | (~)% Impact on CAGR Forecast | Geographic Relevance | Impact Timeline |
|---|---|---|---|
| Rapid cost declines of vision-guided field robots | +4.2% | Global, with highest adoption in North America, Europe, and Australia | Medium term (2-4 years) |
| Edge-AI chips enabling on-device analytics | +3.8% | Global, particularly critical in Asia-Pacific, Africa, and South America where connectivity is limited | Medium term (2-4 years) |
| Adoption of farming-as-a-service subscription models | +3.5% | Global, strongest uptake in Asia-Pacific smallholder markets and emerging economies | Long term (≥ 4 years) |
| Government smart-farm grant programs | +3.2% | North America, Europe, China, India, with selective programs in Middle East | Short term (≤ 2 years) |
| Acute farm-labor shortages | +4.8% | North America, Europe, Japan, Australia, with spillover to high-wage agricultural regions | Long term (≥ 4 years) |
| Carbon-credit monetization of AI-optimized practices | +2.5% | Europe, North America, Australia, with emerging frameworks in South America | Long term (≥ 4 years) |
| Source: Mordor Intelligence | |||
Rapid Cost Declines of Vision-Guided Field Robots
Autonomous robots equipped with computer vision fell below USD 50,000 in 2025, opening the Agritech market to mid-sized farms that previously relied on manual labor. In 2025, Aigen, inc. has introduced the solar-powered Element Gen2 robot designed for weeding crops. Each Element robot operates autonomously and can cover up to 20 acres. John Deere has enhanced its fully autonomous tractor technology, unveiling second-generation AI-powered autonomous machines at CES 2025 to tackle significant skilled labor shortages in agriculture. It plans to introduce its next-generation "Autonomy 2.0" perception system, with a full release scheduled for 2026. This system offers 360-degree operation with "set-and-forget" functionality, enabling unattended overnight field preparation and improved operational speed[1]Source: John Deere, “See and Spray Technology,” deere.com. Advanced cameras and AI enable driverless operation, addressing labor shortages and reducing costs during high-demand seasons. Similar cost trajectories are visible in Japan, where Kubota’s rice transplanters cut transplanting time by 40%. The spread of robot-as-a-service contracts further transforms spending from capex (capital expenditure) to predictable monthly fees.
Edge-AI Chips Enabling On-Device Analytics
Low-power neural processing units now deliver more than 250 TOPS (tera operations per second) while consuming less than 15 watts, so drones and ground robots can classify weeds or detect disease without a network hop. In 2025-2026, a notable shift allows advanced AI tasks, such as Local Large Language Models (LLMs) and intricate computer vision, to operate directly on devices, eliminating the need for cloud connectivity. NVIDIA Corporation’s Jetson Orin module, deployed across multiple Agritech market segments during 2024, exemplifies this leap. Trimble embedded similar edge inference in its guidance consoles in 2025, creating prescription maps in seconds and bypassing cloud costs. In India, Cropin Technology fitted smartphone cameras with edge analytics to serve areas where 4G coverage remains under 60%. With this technology, users can conduct real-time field analyses such as pest detection and crop health assessments directly on their devices, reducing the need for constant cloud connectivity. The same architecture addresses data sovereignty rules by keeping sensor streams on-premises.
Adoption of Farming-as-a-Service Subscription Models
Converting hardware ownership into a per-acre fee lowers entry barriers in the Agritech industry. AGCO is ramping up its "Farmer-First" strategy, broadening its precision agriculture technology offerings under the PTx portfolio (previously known as Fuse and Precision Planting)[2]Source: AGCO Corporation, “Fuse Smart Farming Platform,” agcocorp.com. The company is shifting its focus to provide more adaptable, subscription-based, or retrofitted solutions, moving away from the traditional model of high-cost, upfront purchases. Solinftec's Solix Ag Robotics enables earlier detection of pests, diseases, and weeds through its "plant-by-plant" monitoring. By integrating AI (Alice AI) with field-based robots and drones, the company's technology can cut insecticide use by as much as 70%, provided pests are spotted early. In August 2023, Solinftec revealed that its Solix Ag Robotics sprayer, tested in the United States Corn Belt, achieved herbicide use reductions of up to 95% during the 2023 growing season, with certain trials even hitting a 97% reduction mark. This recurring model helps vendors smooth revenue while letting farmers scale commitments only after seeing clear yield benefits.
Acute Farm-Labor Shortages
Over the past thirty years, global employment trends have shifted significantly, turning automation from a productivity choice into a survival strategy. Employment rates in Bangladesh and Vietnam declined significantly, dropping from approximately 70% to 38%. Meanwhile, China experienced a decline from 60% to 25%. The average age of Japanese farmers is 68.4 years, with over 70% being above the age of 65. The Japanese farming population has significantly declined to 1.23 million in 2022. To address labor shortages and the challenges of an aging workforce, Japanese companies have introduced AI-powered robots capable of automatically harvesting crops. In 2024, Japan’s private AI investment amounted to USD 0.93 billion, with other countries including the United States (USD 109.08 billion) and China (USD 9.29 billion), leveraging generative AI to achieve high production efficiency. Autonomous farm robots developed in regional Queensland are receiving a USD 7 million investment from the Clean Energy Finance Corporation (CEFC) to promote sustainable farming practices and reduce agricultural emissions across Australia in 2025. The Agritech market answers these gaps through machine vision harvesters, robotic milkers, and driverless tractors.
Restraints Impact Analysis*
| Restraint | (~)% Impact on CAGR Forecast | Geographic Relevance | Impact Timeline |
|---|---|---|---|
| Limited rural connectivity bandwidth | -2.8% | Asia-Pacific, Africa, South America, with selective gaps in North America and Europe | Medium term (2-4 years) |
| Data-ownership and sovereignty concerns | -1.9% | Europe, North America, with emerging scrutiny in China and India | Long term (≥ 4 years) |
| High annual maintenance fees for autonomous fleets | -1.5% | Global, particularly acute in smallholder and mid-sized operations | Medium term (2-4 years) |
| Short lifecycle of sensor hardware | -1.2% | Global, with higher replacement frequency in harsh climates | Long term (≥ 4 years) |
| Source: Mordor Intelligence | |||
Limited Rural Connectivity Bandwidth
In 2024, approximately 83% of urban residents worldwide are anticipated to use the Internet, compared to 48% of the rural population. Among the estimated 2.6 billion people offline in 2024, 1.8 billion reside in rural areas. High latency above 500 milliseconds renders real-time variable-rate spraying impractical, limiting use cases to post-harvest analytics. The United States allocated USD 40 million for fiber build-out in 2025, yet completions stretch to 2028. The United States telecom industry experienced its most significant single-year growth in 2025, with the addition of approximately 11.8 million new fiber-to-the-home (FTTH) passings. This expansion increased total United States fiber coverage to over 60% of households. As of early 2026, India's BharatNet project is undergoing significant expansion under the revised, higher-budget framework known as the Amended BharatNet Program. This initiative aims to connect all 650,000 villages. While substantial progress has been achieved, challenges in implementation persist. The original target was limited to 250,000 Gram Panchayats (GPs), but the current scope has been considerably expanded. The divide forces vendors to design hybrid cloud-edge stacks, fragmenting software ecosystems inside the Agritech market.
Data-Ownership and Sovereignty Concerns
Farmers remain wary of sharing granular field data with technology vendors, fearing loss of control over proprietary agronomic insights and potential misuse by input suppliers or commodity traders. A survey found that many growers were uncomfortable with third-party access to yield maps and soil data, citing concerns about data resale and competitive disadvantage. In China, the Data Security Law enacted in 2021 and updated in 2024 mandates that agricultural data generated within national borders remain on domestic servers, forcing multinational vendors to establish in-country cloud regions. India's proposed Digital Personal Data Protection Act includes provisions for agricultural data sovereignty, requiring explicit farmer consent for cross-border data transfers. These regulatory frameworks increase compliance burdens and slow platform interoperability, as vendors must navigate a patchwork of national and regional data-governance regimes. Trust deficits also hinder adoption, as growers perceive data-sharing as a one-way value transfer that benefits technology providers more than farm operators.
*Our forecasts treat driver/restraint impacts as directional, not additive. The impact forecasts reflect baseline growth, mix effects, and variable interactions.
Segment Analysis
By Type: Big Data Anchors, Robotics Surges
Big Data and Analytics accounted for 35% of the Agritech market size in 2025 as satellite imagery and sensor fusion optimized seeding rates, fertilizer doses, and irrigation scheduling. Robotics and Automation are projected to have the fastest 29% CAGR from 2026 to 2031 because camera-guided weeders and autonomous harvesters directly offset labor shortages. Sensors and connected devices accounted for a significant share of the agritech market, driven by declining chip prices. Biotechnology tools represented a smaller portion, supported by AI-driven gene-editing and phenotyping pipelines. The remaining share was attributed to blockchain traceability and supply chain software.
Robotics is narrowing the gap with analytics as capital outlays drop and financing models expand. In 2025, John Deere customers reduced non-residual herbicide usage by approximately 50% with the use of the See and Spray system across 5 million acres of farmland, saving nearly 31 million gallons of herbicide mix. Kubota reached an increased penetration of autonomous rice planters in Japan during 2025. Sensor commoditization is steering suppliers toward service bundles that lock customers in with decision support rather than hardware margins. Biotechnology Tools should accelerate as seed companies adopt AI to shorten breeding cycles for climate-resilient varieties.


By Application: Broad-Acre Leads, Indoor Farming Accelerates
Broad-Acre Operations captured 45% of the Agritech market share in 2025 because large contiguous fields maximize the return on guidance systems and variable-rate applicators. Indoor and Vertical Farming is projected to expand at a fastest 31% CAGR from 2026 to 2031 as land-scarce regions chase food security and year-round harvests. Livestock Management accounted for a significant portion of the Agritech market, driven by wearables and computer vision technologies that enable early disease detection and reduce antibiotic usage. Aerial Imaging represented a notable share of the market, while Supply Chain and Inventory Management contributed the remaining portion.
Urban policies are promoting indoor farming. For instance, Singapore aims to achieve increased local food production by the end of the decade and is investing in AI-monitored vertical farms that consume significantly less water compared to traditional field crops. Emirates Crop One launched a large facility in Dubai, utilizing spectral LEDs to optimize nutrient absorption. Livestock Management is also advancing with the use of sensors to track rumination and temperature, as demonstrated by Alltech, which reduced antibiotic usage in pilot herds. Additionally, drones are emerging as an accessible entry point into precision agriculture for small and mid-sized farms.
By Offering: Hardware Dominates, Services Gain Ground
Hardware yielded 58% of the 2025 Agritech market size because sensors, drones, and edge processors still require upfront purchase. Services are forecast for a fastest 29.5% CAGR from 2026 to 2031 as vendors package agronomy advice, predictive maintenance, and carbon-credit verification into recurring contracts. Software platforms accounted for a significant share of the Agritech market, providing dashboards and farm management systems that help visualize in-field variability. The shift mirrors enterprise software, where subscriptions boost lifetime value and reduce cyclicality.
Trimble's Ag Software division experienced higher growth compared to its hardware division, highlighting the faster scalability of data-driven insights over physical product shipments. AGCO's Fuse achieved substantial annual recurring revenue. Solinftec managed a large area under its scouting subscription, generating revenue per hectare per season. Indigo Ag generated fees for each metric ton of verified carbon, illustrating how service-based offerings can create new revenue streams even as hardware spending slows.
Geography Analysis
North America controlled 41% of the Agritech market revenue in 2025. Broadband grants totaling USD 40 million in the United States aim to address the analytics latency gap. In Canada, CAD 50 million (USD 37 million) was co-invested in AgriTech startups specializing in livestock and carbon programs[3]Source: Agriculture and Agri-Food Canada, “AgriTech Growth Fund,” agr.gc.ca. In Alberta(Canada), Olds College Smart Farm manages a 2,800-acre site dedicated to testing agricultural technologies, including drones, sensors, and artificial intelligence. Government initiatives, such as the Agricultural Clean Technology Program, facilitate the adoption of these technologies on farms. Mexico has implemented multispectral drones in avocado and berry orchards to enable early detection of water stress.
In Europe, the Common Agricultural Policy allocated heavily for precision tools. Germany is at the forefront of autonomous tractor adoption, with companies such as Fendt and Claas incorporating AI-based guidance systems. In the United Kingdom, subsidy payments are linked to verified environmental outcomes, driving the adoption of software that tracks soil health. Additionally, carbon monetization frameworks are increasing the demand for comprehensive data logs across the region.
Asia-Pacific is on pace for a 27.5% CAGR during 2026-2031, the fastest global rate. China allocated CNY 10 billion (USD 1.4 billion) in subsidies for smart equipment in 2024. India aims to digitize 100 million smallholder farmers by 2027 through an INR 2,817 crore (USD 337 million) farmer database initiative. Japan has committed to funding robotic rice transplanters to address its aging workforce. Australia is utilizing soil sensors and satellite imagery to manage drought risks across its grain belts. In South America, Brazil integrates AI across sugarcane and soybean chains to meet export standards. Africa grows through smart-farm pilots in Egypt and South Africa, including IBM-led irrigation scheduling over several hectares. The Middle East is driven by the United Arab Emirates and Saudi Arabia's indoor farming investments.

Competitive Landscape
The Agritech market remains moderately fragmented, with the largest players holding a significant share of the revenue in 2025. Deere and Company leads the market, leveraging its equipment base to cross-sell precision agriculture subscriptions. AGCO Corporation and CNH Industrial N.V. integrate artificial intelligence into their traditional machinery to strengthen customer relationships. International Business Machines Corporation provides analytics solutions to enterprise agribusinesses and government agencies.
John Deere expands its Agrobotics Portfolio in 2025 through GUSS Acquisition by introducing a fully autonomous sprayer designed for orchards. Trimble Inc. follows, driven by its guidance hardware and growing software renewals. Software-focused competitors include Prospera Technologies Ltd. and CropX Technologies Ltd., which differentiate themselves through outcome-based pricing models that link fees to measurable yield improvements. Meanwhile, robotics companies such as Naïo Technologies SAS concentrate on specialty crops often overlooked by major tractor manufacturers.
Patent activity highlights the increasing competition in the Agritech market. Standards organizations are developing data exchange protocols to reduce vendor lock-in and facilitate multi-platform deployments. Edge inference capabilities are becoming a critical differentiator, particularly for growers in regions with limited connectivity, as these systems do not rely on constant data backhaul. Additionally, significant opportunities remain in the livestock segment, where AI adoption is still low.
Agritech Industry Leaders
Deere & Company
Datacor, Inc (Format Solution)
Corteva Agriscience
International Business Machines Corporation
AgEagle Aerial Systems Inc.
- *Disclaimer: Major Players sorted in no particular order

Recent Industry Developments
- November 2025: New Holland launched the new R4 robot series that aims to assist vineyard, orchard, and specialty crop growers in addressing key challenges such as labor shortages and the need for more environmentally sustainable food production.
- November 2024: AgroVision merged with AgriSyst, an international agricultural software provider. The merged entity focuses on delivering software solutions to enhance farm productivity and sustainability across Europe. The integration enables farmers to optimize operations, reduce emissions, and improve profitability.
- June 2024: New Holland, a CNH brand, formed a partnership with Bluewhite to integrate AI-driven autonomous technology into New Holland tractors in North America. The multi-year agreement focuses on implementing autonomous solutions for specialty crop operations in orchards and vineyards, with plans for regional and global expansion.


Global Agritech Market Report Scope
Agritech refers to the integration of digital technologies, data analytics, artificial intelligence (AI), and automation in farming practices to improve productivity, efficiency, and sustainability. The Agritech Market is segmented by Type (Biotechnology and Biotech, Big Data and Analytics, Robotics and Automation, Sensors and Connected Devices, and Others), by Application (Broad Acre Applications, Livestock Farm Management, Indoor Farming, Agrochemicals, Aerial Data Collection, Weather Tracking and Forecasting, Supply Chain Management, Inventory Management, and Others), by Offering (Hardware, Software, Other Products, and Services), and by Geography (North America, Europe, Asia-Pacific, South America, the Middle East, and Africa). The Market Forecasts are Provided in Terms of Value (USD).
| Biotechnology and Biotech |
| Big Data and Analytics |
| Robotics and Automation |
| Sensors and Connected Devices |
| Others |
| Broad Acre Applications | Field Mapping |
| Seeding and Planting | |
| Fertilizing and Irrigation | |
| Intercultural Operations | |
| Picking and Harvesting | |
| Livestock Farm Management | Milking |
| Shepherding and Herding | |
| Others | |
| Indoor Farming | |
| Agrochemicals | |
| Aerial Data Collection | |
| Weather Tracking and Forecasting | |
| Supply Chain Management | |
| Inventory Management | |
| Others |
| Hardware |
| Software |
| Other Products |
| Services |
| North America | United States |
| Canada | |
| Mexico | |
| Rest of North America | |
| Europe | Germany |
| United Kingdom | |
| France | |
| Spain | |
| Italy | |
| Rest of Europe | |
| Asia-Pacific | China |
| Japan | |
| India | |
| Australia | |
| Rest of Asia-Pacific | |
| South America | Brazil |
| Argentina | |
| Rest of South America | |
| Africa | South Africa |
| Rest of Africa | |
| Middle East | United Arab Emirates |
| Saudi Arabia | |
| Rest of Middle East |
| By Type | Biotechnology and Biotech | |
| Big Data and Analytics | ||
| Robotics and Automation | ||
| Sensors and Connected Devices | ||
| Others | ||
| By Application | Broad Acre Applications | Field Mapping |
| Seeding and Planting | ||
| Fertilizing and Irrigation | ||
| Intercultural Operations | ||
| Picking and Harvesting | ||
| Livestock Farm Management | Milking | |
| Shepherding and Herding | ||
| Others | ||
| Indoor Farming | ||
| Agrochemicals | ||
| Aerial Data Collection | ||
| Weather Tracking and Forecasting | ||
| Supply Chain Management | ||
| Inventory Management | ||
| Others | ||
| By Offering | Hardware | |
| Software | ||
| Other Products | ||
| Services | ||
| By Geography | North America | United States |
| Canada | ||
| Mexico | ||
| Rest of North America | ||
| Europe | Germany | |
| United Kingdom | ||
| France | ||
| Spain | ||
| Italy | ||
| Rest of Europe | ||
| Asia-Pacific | China | |
| Japan | ||
| India | ||
| Australia | ||
| Rest of Asia-Pacific | ||
| South America | Brazil | |
| Argentina | ||
| Rest of South America | ||
| Africa | South Africa | |
| Rest of Africa | ||
| Middle East | United Arab Emirates | |
| Saudi Arabia | ||
| Rest of Middle East | ||


Key Questions Answered in the Report
How big is the Agritech Market?
The Agritech Market size is valued at USD 2.23 billion in 2026 and grow at a CAGR of 22.97% to reach USD 6.27 billion from 2026-2031.
Which technology type currently owns the largest slice of spending?
Big Data and Analytics held the largest share at 35% in 2025.
What is the leading regional market for Agritech solutions?
North America led with 41% of global revenue in 2025.
Why are services so important to future vendor revenue?
Services monetize recurring activities such as agronomy advice and carbon-credit verification, driving a 29.5% CAGR that outpaces hardware growth.
How concentrated is competition in this space?
The combined share of the top five suppliers indicates moderate concentration and ongoing room for new entrants.
Page last updated on:


