Farm Management Software Market Size and Share
Market Overview
| Study Period | 2021 - 2031 |
|---|---|
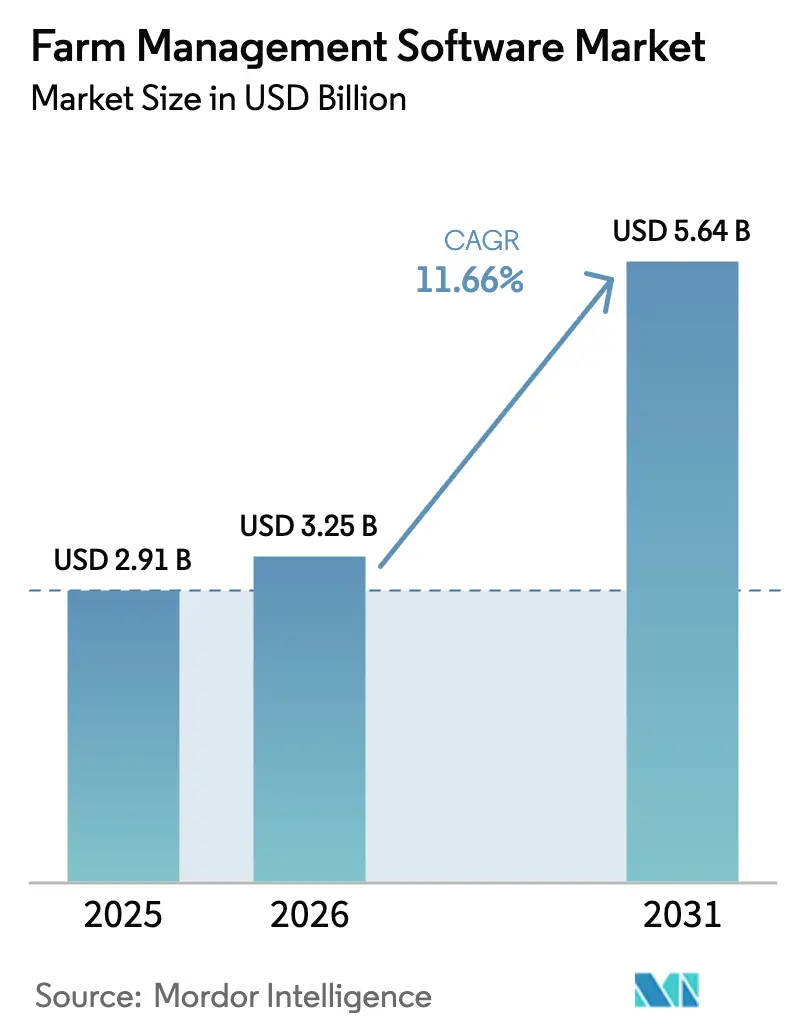
| Market Size (2026) | USD 3.25 Billion |
| Market Size (2031) | USD 5.64 Billion |
| Growth Rate (2026 - 2031) | 11.66% CAGR |
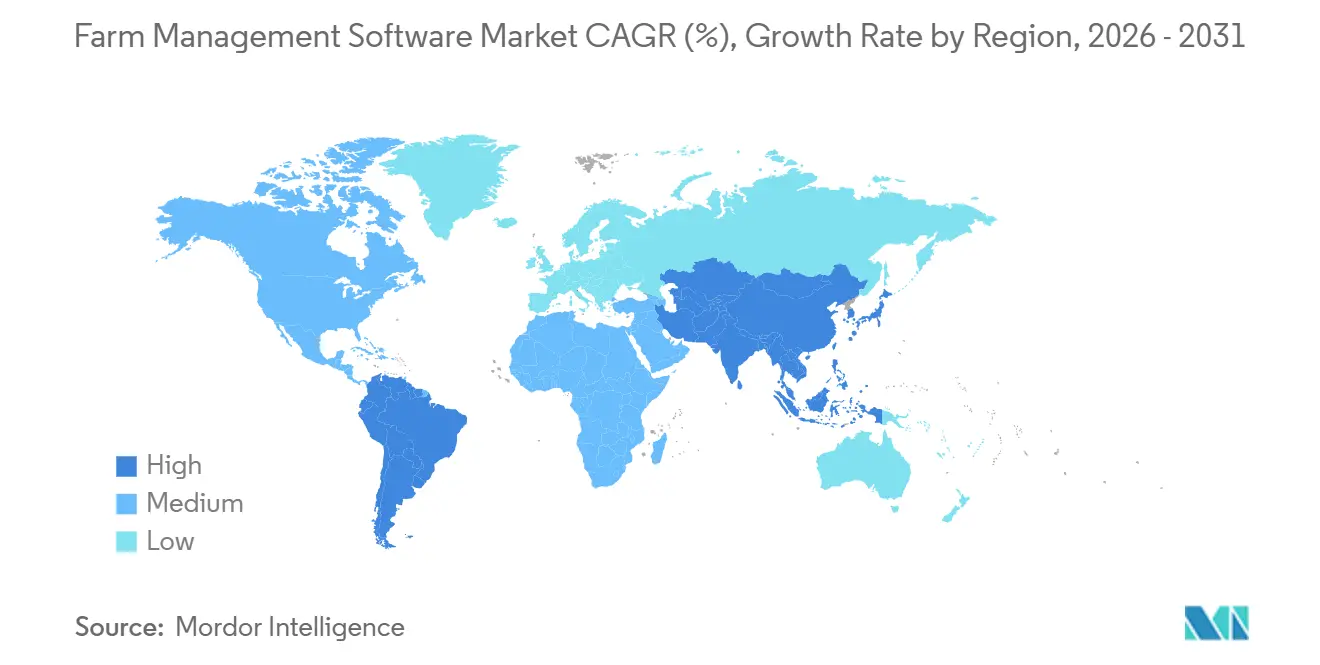
| Fastest Growing Market | Asia Pacific |
| Largest Market | North America |
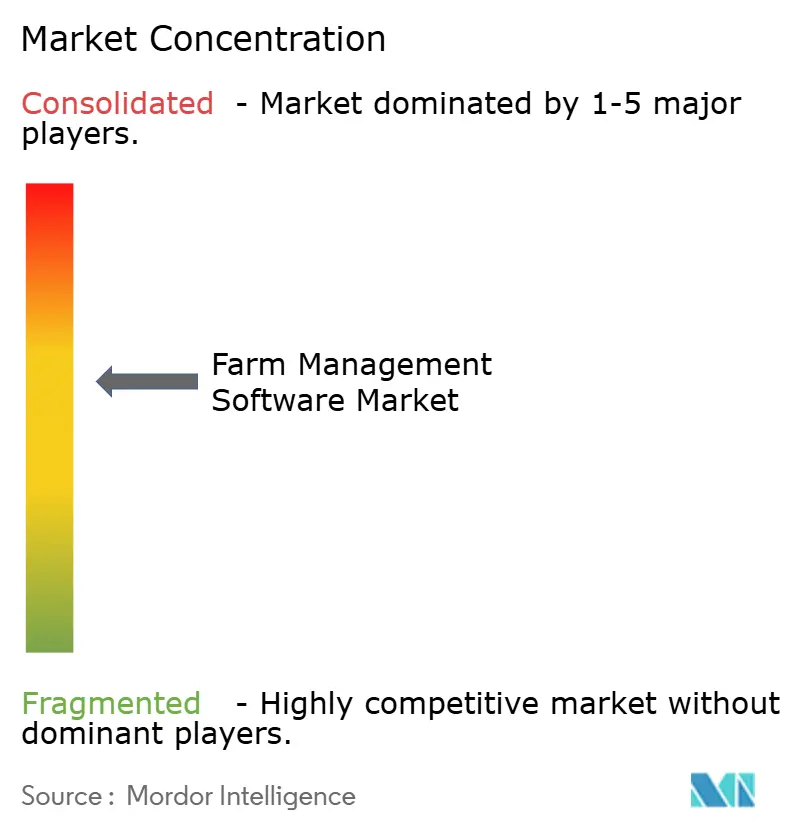
| Market Concentration | Medium |
Major Players *Disclaimer: Major Players sorted in no particular order Image © Mordor Intelligence. Reuse requires attribution under CC BY 4.0. | |
Farm Management Software Market Analysis by Mordor Intelligence
The farm management software market size is projected to grow from USD 2.91 billion in 2025 to USD 3.25 billion in 2026 and is forecast to reach USD 5.64 billion by 2031 at 11.66% CAGR over 2026-2031. This growth reflects the industry's shift from intuition-based decision-making to data-driven workflows. Factors such as structural labor shortages, government-led digitization initiatives, and the expansion of rural connectivity are driving farmers to adopt integrated cloud platforms over traditional record-keeping methods. Market players are enhancing their offerings by incorporating satellite imagery, predictive analytics, and compliance tools, while venture capital funding accelerates innovation cycles that previously dominated established companies. Although interoperability standards are developing slowly, mixed-fleet farms are increasingly adopting ecosystems with extensive options for third-party connectors. Price-sensitive smallholders in regions such as Asia-Pacific and Africa are gaining access to subsidized mobile applications with offline functionality, thereby opening up new market opportunities.
Key Report Takeaways
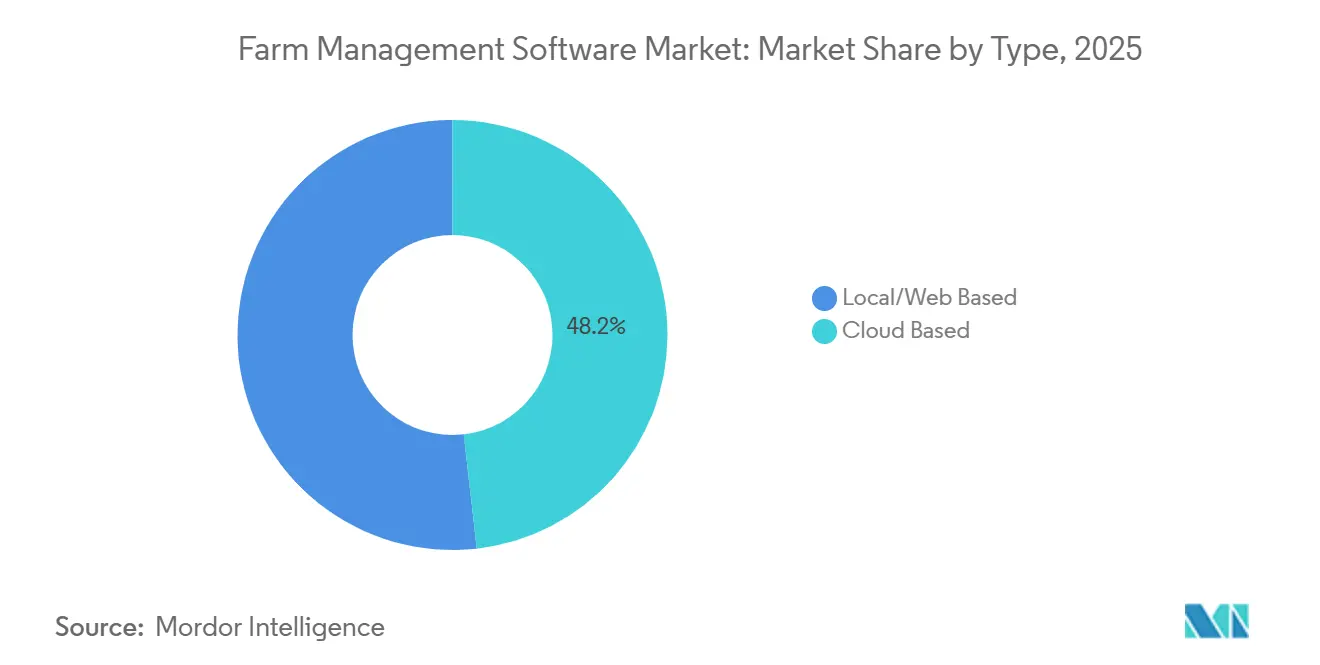
- By type, cloud-based platforms captured 48.2% of the farm management software market share in 2025, and they are forecast to expand at a 12.8% CAGR through 2031.
- By farm size, large farms held 40.2% of the farm management software market size in 2025, while smallholder operations are projected to post a 15.6% CAGR to 2031.
- By application, precision farming led with 38.5% of 2025 spending, and aquaculture is projected to grow at a 13.5% CAGR to 2031.
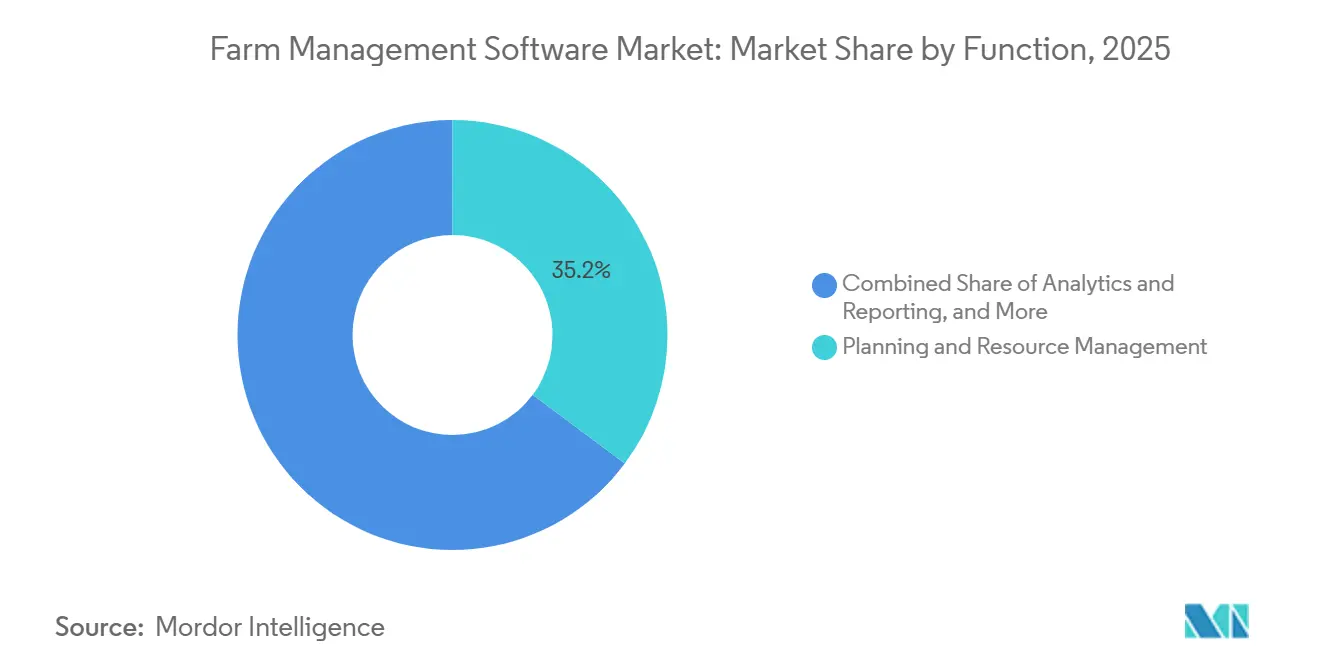
- By function, planning and resource management represented 35.2% of 2025 deployments, whereas analytics and reporting modules are projected to advance at a 12.2% CAGR.
- By delivery platform, desktop interfaces retained 50.4% of the 2025 revenue, while mobile applications are anticipated to rise at an 11.9% CAGR.
- By geography, North America generated 37.2% of the 2025 revenue, and the Asia-Pacific region is set to grow the fastest at an 11.4% CAGR through 2031.
- The top five vendors, Deere & Company, Bayer AG (Climate LLC), CNH Industrial N.V. (Raven Industries LLC), AGCO Corporation (Trimble Inc.), and BASF SE (BASF Digital Farming GmbH), controlled a majority of the 2025 global revenue, underscoring moderate concentration that still leaves ample space for regional specialists.
Note: Market size and forecast figures in this report are generated using Mordor Intelligence’s proprietary estimation framework, updated with the latest available data and insights as of January 2026.
Global Farm Management Software Market Trends and Insights
Drivers Impact Analysis*
| Driver | (~) % Impact on CAGR Forecast | Geographic Relevance | Impact Timeline |
|---|---|---|---|
| Farm labor shortages and aging farmer population | +2.0% | Global, acute in North America, Europe, and Japan | Medium term (2-4 years) |
| Decreasing arable land driving yield optimization | +1.7% | Global, concentrated in Asia-Pacific and Middle East | Long term (≥ 4 years) |
| Rapid integration of precision agriculture IoT sensors | +1.9% | North America, Europe, Australia, spillover to Brazil and Argentina | Short term (≤ 2 years) |
| Government digital-agriculture incentives and mandates | +1.6% | Asia-Pacific, Europe, and Africa | Medium term (2-4 years) |
| Ultra-high-resolution satellite imagery proliferation | +1.1% | Global, early adoption in North America and Europe | Short term (≤ 2 years) |
| Surge in venture capital funding for agriculture software scale-ups | +1.0% | Global, concentrated in North America and Europe, expanding to India | Short term (≤ 2 years) |
| Source: Mordor Intelligence | |||
Farm Labor Shortages and Aging Farmer Population
The average age of principal operators surpassed 58 years in the United States and 68 years in Japan in 2024, creating a knowledge gap that is driving digital adoption among new entrants who favor mobile-first tools[1]Source: United States Department of Agriculture, “Farm Labor,” USDA.gov. Seasonal labor availability in California’s Central Valley declined by 22% between 2024 and 2025, prompting vegetable growers to adopt task-management modules that enable real-time crew allocation. In Europe, digital field journals have become mandatory for subsidy eligibility, requiring over one million farms to implement compliance-ready software by 2027. This transition has made software an operational necessity for farms exceeding 500 hectares, where manual oversight is no longer feasible. Labor shortages are increasing the demand for platforms capable of processing guidance data from autonomous tractors, ensuring traceability for operator-free tasks.
Decreasing Arable Land Driving Yield Optimization
Global arable land per capita is projected to decline to 0.19 hectares by 2025, increasing the need to enhance agricultural yields[2]Source: Food and Agriculture Organization, “FAOSTAT – Land Use,” FAO.org. In 2024, China lost 1.1 million hectares of farmland due to urban expansion, leading to the enforcement of mandatory precision nutrient management for subsidized grain producers. India’s soil health card program now integrates laboratory results with geo-tagged recommendations, resulting in an 18% reduction in fertilizer costs and a 12% increase in yields in pilot districts. In the water-scarce Middle East, farms utilize scheduling algorithms that activate drip irrigation only when sensors detect a need, resulting in a 30% reduction in water usage in Saudi Arabia. In response, software vendors are incorporating crop models that simulate the effects of nutrient timing, seed density, and fungicide application intervals, transforming raw data into actionable insights.
Rapid Integration of Precision Agriculture IoT Sensors
The number of installed farm sensors is projected to exceed 85 million units by 2025, generating continuous data streams that require centralization. These sensors play a critical role in modernizing agricultural practices by providing real-time insights into soil conditions, crop health, and equipment performance. Brazilian sugarcane producers have integrated drone imagery with nutrient data to identify deficiencies up to three weeks earlier than traditional human scouting methods, leading to an 8% increase in sugar recovery. This integration highlights the growing importance of precision agriculture in improving yield and efficiency. However, limited equipment standardization remains a challenge, as it complicates the seamless integration of various technologies. Farms that invest in custom connectors are achieving rapid returns on investment, demonstrating the potential benefits of tailored solutions in overcoming compatibility issues.
Surge in Venture Capital Funding for Agricultural Software Scale-Ups
Global venture funding for agricultural software reached USD 4.2 billion in 2024, with 62% of the allocation directed towards farm management platforms. CropIn secured USD 120 million in June 2025 to expand its AI-based crop monitoring services across Africa and South America, aiming to enhance productivity and sustainability in these regions. Taranis raised USD 40 million three months earlier to scale its sub-millimeter imagery technology, establishing agreements with eight agrochemical companies to improve precision agriculture practices. European startups attracted USD 1.2 billion in 2024, as investors focused on water- and carbon-related solutions that address critical environmental challenges. While capital investment accelerates feature development, it also heightens expectations for profitability, driving vendors toward subscription models that integrate analytics, hardware leasing, and agronomic advisory services.
Restraints Impact Analysis*
| Restraint | (~) % Impact on CAGR Forecast | Geographic Relevance | Impact Timeline |
|---|---|---|---|
| Fragmented smallholder farm ownership | -1.6% | Asia-Pacific, Africa, and South America | Long term (≥ 4 years) |
| High upfront software, hardware and training costs | -1.4% | Global, acute in South Asia and Sub-Saharan Africa | Medium term (2-4 years) |
| Interoperability issues with legacy on-farm hardware | -0.9% | North America, Europe, and Australia | Short term (≤ 2 years) |
| Limited rural broadband connectivity | -1.2% | South Asia, Sub-Saharan Africa, South America interior regions | Medium term (2-4 years) |
| Source: Mordor Intelligence | |||
Fragmented Smallholder Farm Ownership
Farms smaller than two hectares constitute 84% of the world’s 570 million agricultural holdings in 2021, but contribute only 35% of global farm revenue[3]Source: World Bank, “Agriculture Overview,” WorldBank.org. This limits vendors' incentives to localize software and provide tailored support. In India, the average farm size decreased to 1.08 hectares in 2024, with 86% of farmers earning less than USD 1,200 annually, reducing their ability to afford annual subscriptions priced at USD 60 or more. In Sub-Saharan Africa, communal land tenure complicates digital record-keeping, as 68% of farmers lack formal title deeds required for credit scoring. Replication remains slow due to trust issues and low digital literacy levels. To address these challenges, vendors are offering freemium tiers and voice-based interfaces, which compress profit margins and delay breakeven timelines.
Interoperability Issues with Legacy On-Farm Hardware
Proprietary data formats compel growers to repeatedly input field boundaries and yield maps across multiple systems, resulting in inefficiencies and a higher risk of errors. This repetitive process not only consumes valuable time but also increases the likelihood of data management discrepancies. In 2025, ISOBUS-compliant equipment accounted for only 38% of new machinery sales in Europe, as manufacturers prioritized closed ecosystems to protect their aftermarket revenue streams. The limited adoption of ISOBUS standards highlights the challenges in achieving interoperability across different equipment and software platforms. Australian grain producers are estimated to lose 120 hours of productivity annually due to the need for remapping data between consoles and software platforms. This significant loss of time highlights the operational inefficiencies resulting from the lack of standardized data formats. Open-source initiatives face obstacles due to the lack of dealer networks, which allows proprietary ecosystems to maintain their dominance. The absence of robust support structures for open-source solutions further reinforces the stronghold of proprietary systems in the market.
*Our forecasts treat driver/restraint impacts as directional, not additive. The impact forecasts reflect baseline growth, mix effects, and variable interactions.
Segment Analysis
By Type: Cloud Platforms Reshape Deployment Economics
Cloud solutions accounted for 48.2% of the farm management software market share in 2025, establishing themselves as the leading deployment model in the market. The segment's compound annual growth rate (CAGR) of 12.8% reflects the appeal of improved connectivity and subscription-based pricing among both large and mid-sized operators. Local and web-based installations remain relevant, particularly in the United States and Europe, where large farms continue to express concerns about data sovereignty and latency. Hybrid edge architectures address these challenges by caching data on-site and synchronizing it when bandwidth permits, thereby enhancing vendor retention.
The flexibility of cloud solutions also supports geographic expansion, as Software-as-a-Service (SaaS) platforms reduce server maintenance costs for users such as Brazilian soy producers and Indian rice cooperatives. Bayer’s FieldView expanded to 14 additional countries in 2025, demonstrating how multi-tenant architectures enable rapid scaling of features. With regulators increasingly requiring digital records, cloud solutions offer a straightforward path to automated compliance.


By Farm Size: Smallholders Accelerate Digital Adoption
Large farms exceeding 500 hectares accounted for 40.2% of the farm management software market size in 2025, driven by economies of scale and the presence of in-house agronomic teams. These farms benefit from the adoption of advanced technologies, enabling efficient resource management and higher productivity. Their ability to invest in premium software solutions further strengthens their market position. Subsidized smartphone distribution in countries such as India and Kenya, combined with tailored freemium models, has helped lower financial barriers and foster digital adoption. This initiative has been instrumental in introducing technology to previously underserved regions, laying the groundwork for broader market penetration.
The fastest growth is projected from smallholder farms under 10 hectares, with a forecasted CAGR of 15.6%. Cooperative aggregation models, such as Safaricom’s DigiFarm, have shown that bundled services, including weather alerts, advisory support, and microcredit, can increase yields by 15% within two growing seasons. Medium-sized farms present a moderate growth opportunity, often starting with modular point solutions before transitioning to comprehensive software suites. Vendors are increasingly adopting land-agnostic pricing models that decouple features from acreage, encouraging upgrades without disadvantaging smaller plots. The market share of farm management software for smallholders is projected to increase as governments direct subsidies toward this group to address food security and emission reduction objectives.
By Application: Aquaculture Emerges as High-Growth Vertical
Precision farming accounted for 38.5% of spending in 2025, establishing its position as the largest application segment within the farm management software market. These tools enable farmers to make data-driven decisions, enhancing productivity and reducing waste. Row-crop producers utilize variable-rate seeding, spraying, and yield mapping to optimize resource use and meet sustainability audit requirements. Precision farming tools facilitate the monitoring of soil health, weather patterns, and crop conditions, enabling timely interventions and improved yield outcomes. The increasing need for sustainable farming practices and compliance with environmental regulations further drives the adoption of these tools. Livestock monitoring ranks second, with wearables and RFID systems significantly reducing veterinary costs, particularly in European dairy herds.
Aquaculture platforms, though currently representing a smaller market share, are anticipated to grow at a CAGR of 13.5% through 2031. This growth is driven by shrimp, salmon, and tilapia operators adopting real-time water quality monitoring systems. Norway has already achieved 85% coverage of marine cages, while India’s coastal states report increased pond yields after implementing sensor-linked feeding systems. Mandatory traceability requirements for seafood exports further support the aquaculture segment of the farm management software market. While greenhouse and forestry applications contribute to market diversity, aquaculture presents the most significant growth potential due to the immediate return on investment (ROI) from addressing dissolved oxygen deficiencies and disease outbreaks.
By Function: Analytics Modules Gain Strategic Priority
Planning and resource management accounted for 35.2% of 2025 deployments, underscoring its importance as a foundation for broader adoption. These tools are critical for optimizing resource allocation, scheduling, and operational efficiency, enabling organizations to streamline processes and reduce costs. Their widespread adoption reflects the growing need for effective management systems to handle complex workflows and ensure scalability. Recordkeeping and financial tools ranked next, driven by the need for accurate subsidy documentation and seamless integrations with enterprise resource planning systems. These tools play a crucial role in maintaining compliance, enhancing financial transparency, and supporting informed decision-making processes within enterprises.
Analytics and reporting are projected to achieve the highest growth, with a CAGR of 12.2%. The Australian wheat and Brazilian sugar industries already utilize models that integrate soil moisture data, climate forecasts, and satellite indices to optimize harvest logistics. These advanced analytics solutions enable precise decision-making, helping farmers and producers mitigate risks and improve yield outcomes. While machine learning adoption remains limited, it is gradually increasing as venture-backed vendors incorporate anomaly detection capabilities. This technology enhances the ability to identify irregularities and improve operational accuracy. Regulatory carbon markets are driving demand, as analytics provide the essential measurement, reporting, and verification framework required for generating carbon credits. These frameworks are becoming increasingly important as industries strive to meet sustainability goals and comply with environmental regulations.
By Delivery Platform: Mobile Interfaces Capture Field Workflows
Desktop platforms accounted for 50.4% of the 2025 revenue in the farm management software market, primarily due to their suitability for season-end analysis and multi-year planning. These platforms are particularly valued for their ability to handle large datasets and provide detailed insights, which are essential for making informed decisions in agricultural operations. They remain critical for tasks that require keyboard input and large displays to handle complex operations, such as generating comprehensive reports, analyzing historical trends, and planning resource allocation. Despite the growing adoption of mobile solutions, desktop platforms continue to play a significant role in regions and use cases where precision and extensive data processing are necessary. 78% of Brazilian soybean managers already utilize mobile apps for tasks such as photographing pest damage, geo-tagging soil samples, and assigning tractor operations, highlighting the increasing reliance on mobile technology for on-the-go farm management.
Mobile usage in the farm management software market is projected to grow at a CAGR of 11.9%, becoming the primary interface in emerging markets by 2031. The convenience and accessibility of mobile devices make them an attractive option for farmers, particularly in regions with limited access to desktop infrastructure. Progressive web applications that operate offline and synchronize data later address bandwidth limitations, ensuring functionality even in areas with poor internet connectivity. Features such as voice assistance and image recognition reduce literacy barriers, enabling a broader range of users to adopt these technologies. These advancements not only enhance operational efficiency but also empower small-scale farmers to participate in modern agricultural practices. As these technologies advance, mobile platforms are anticipated to capture over 55% of the market share in developing regions, prompting vendors to prioritize small-screen optimization in user experience strategies to meet the evolving needs of their customer base.
Geography Analysis
North America accounted for 37.2% of the farm management software market share in 2025. In the United States, 68% of farms larger than 400 hectares deployed software, incorporating carbon-credit measurement tools as an additional income source. In Canada, the prairie provinces achieved a 16% reduction in nitrogen use across 14 million hectares by using variable-rate prescriptions. Mexico's protected agriculture sector enhanced water efficiency by 31% by integrating greenhouse controls with farm management dashboards. The region benefits from 82% rural broadband penetration, proximity to dealers, and widespread use of precision agriculture hardware. The market focus is shifting toward specialty crops, mid-sized growers, and livestock operators.
The Asia-Pacific region is projected to lead future market growth with a compound annual growth rate (CAGR) of 11.4%. In China, digital traceability is mandated for 80% of fruit and vegetable production. Japan's aging rice farming population has adopted drone scouting and autonomous tractors, resulting in a 35% reduction in labor requirements. In Australia, 22 million hectares of cotton and grain fields utilize satellite-driven irrigation systems, achieving a 28% reduction in water usage. South Korea's smart farm initiative is investing USD 450 million in subsidies for greenhouse and livestock monitoring, aiming to accelerate adoption among 12,000 producers by 2027.
Europe has captured significant revenue due to Common Agricultural Policy reforms, which require environmental metrics to be logged through compliant software[4]Source: European Commission, “Common Agricultural Policy Digital Transition,” EC.europa.eu. German arable farms have integrated nitrogen models to comply with fertilizer caps, resulting in an 18% reduction in surplus. In the United Kingdom, the Environmental Land Management Scheme has driven 78% software penetration among English farms. French vineyards have reduced their use of fungicides by 32% through the use of drone-guided spraying. South America has contributed to the market, driven by Brazilian soybean production and Argentine cattle farming. In contrast, the Middle East and Africa face challenges such as fragmented land tenure and limited connectivity. The region is poised for growth as satellite broadband prices decline, enabling broader adoption of farm management software.

Competitive Landscape
The farm management software market exhibits moderate concentration, with the top five vendors, Deere & Company, Bayer AG (Climate LLC), CNH Industrial N.V. (Raven Industries LLC), AGCO Corporation (Trimble Inc.), and BASF SE (BASF Digital Farming GmbH) accounting for a significant share of the 2025 global revenue. These key players dominate the market, leaving room for regional and niche specialists. Deere & Company and CNH Industrial N.V. integrate hardware telematics with proprietary cloud platforms, increasing switching costs for row-crop producers. Bayer’s Climate LLC and BASF Digital Farming position their software as an input enhancer, offering subsidized subscriptions that encourage the use of branded seeds and crop protection products. AGCO Corporation’s partnership with Trimble in 2024 highlights the co-development strategy adopted by machinery manufacturers to expedite market entry without developing complete software stacks independently.
Emerging competitors are leveraging artificial intelligence to differentiate their products and services, enhancing their offerings and gaining a competitive edge. CropIn’s image recognition technology identifies 87 crop diseases and 34 pest species using smartphone photos, enabling cooperatives in regions like India and Africa to address agronomist shortages. Taranis provides sub-millimeter aerial imagery capable of detecting individual larvae, allowing agrochemical partners to reduce fungicide application by 24% while maintaining yield levels. Open-source initiatives, such as the Open Ag Data Alliance, aim to promote interoperability, but they often lack the marketing resources of proprietary ecosystems.
Regulatory changes are influencing competitive strategies. Europe’s proposed Agricultural Data Regulation imposes stricter controls on cross-border data flows and mandates farmer consent for the secondary use of data, prompting vendors to invest in region-specific data centers. Market consolidation accelerated, with Deere & Company acquiring See and Spray for USD 305 million. These moves indicate a trend toward vertically integrated solutions that combine hardware, software, and biologics. White-space opportunities remain in areas such as aquaculture, greenhouse automation, and livestock genomics, where tailored interfaces and sensor integrations are still underdeveloped. These segments present potential for growth as vendors address the specific needs of these markets.
Farm Management Software Industry Leaders
Deere & Company
Bayer AG (Climate LLC)
CNH Industrial N.V. (Raven Industries LLC)
AGCO Corporation (Trimble Inc.)
BASF SE (BASF Digital Farming GmbH)
- *Disclaimer: Major Players sorted in no particular order

Recent Industry Developments
- September 2025: BASF SE (BASF Digital Farming GmbH) has expanded the global rollout of its xarvio FIELD MANAGER for AgBusiness, introducing the platform in Argentina and Brazil. Although the platform aims to enhance yield and profitability for key crops such as soybeans, official 2025 reports on its performance in South America emphasize its commercial availability and operational advantages rather than highlighting the 12% yield increase observed during pilot trials in Argentina and Uruguay.
- July 2025: Topcon Agriculture has introduced the UC7 Plus, the latest version of its boom height control system, designed to enhance accuracy and efficiency in agricultural spraying. Leveraging the foundation of Norac technology, the system automates boom adjustments to align with terrain contours, thereby minimizing operator fatigue and stress.
- March 2025: Bushel, a farm management software company, has expanded its platform by introducing enhanced financial tools for farmers and agribusinesses. Bushel Farm now includes a digital wallet, offering a comprehensive solution to manage both farm operations and finances. This integration aims to streamline financial and operational management for farmers.
- February 2025: Valmont Industries, through its Valley Irrigation brand, officially launched AgSense 365. This integrated platform combines four legacy irrigation technology systems to simplify operations for growers. AgSense 365 offers enhanced features for monitoring and controlling irrigation equipment, providing growers with real-time data and improved decision-making capabilities. The platform aims to optimize water usage, reduce operational costs, and increase overall efficiency in agricultural practices.


Research Methodology Framework and Report Scope
Market Definitions and Key Coverage
Our study defines the farm management software market as all digitized platforms, whether cloud, web, or hybrid, that enable growers to plan, monitor, analyze, and record agronomic, livestock, aquaculture, and greenhouse tasks across pre-production, in-field, and post-harvest stages. Revenues reflect net license, subscription, and connected service fees, exclusive of stand-alone hardware and outsourced farm-labor contracts.
Scope exclusion: Stand-alone drone hardware, generic ERP suites, or precision hardware sold without embedded software are excluded.
Segmentation Overview
- By Type
- Local / Web-based
- Cloud-based
- Software as a Service (SaaS)
- Platform as a Service (PaaS)
- By Farm Size
- Smallholder Farms
- Medium Farms
- Large Farms
- By Application
- Precision Farming
- Livestock Monitoring
- Smart Greenhouse
- Aquaculture
- Other Applications
- By Function
- Planning and Resource Management
- Record Keeping
- Financial Management
- Inventory and Supply Chain Management
- Analytics and Reporting
- By Delivery Platform
- Desktop
- Mobile Applications
- By Geography
- North America
- United States
- Canada
- Mexico
- Rest of North America
- Europe
- Germany
- United Kingdom
- France
- Spain
- Italy
- Russia
- Rest of Europe
- Asia-Pacific
- China
- India
- Japan
- Australia
- South Korea
- Rest of Asia-Pacific
- South America
- Brazil
- Argentina
- Rest of South America
- Middle East
- Saudi Arabia
- United Arab Emirates
- Turkey
- Rest of Middle East
- Africa
- South Africa
- Kenya
- Nigeria
- Rest of Africa
- North America
Detailed Research Methodology and Data Validation
Primary Research
Mordor analysts interview agronomists, digital-platform product managers, grower cooperatives, and regional extension officers across North America, Europe, Latin America, and Asia-Pacific. These discussions validate pricing corridors, typical user counts per license tier, adoption inhibitors, and likely regulation-driven demand shifts.
Desk Research
We first compile macro and sector data from tier-1 public sources such as FAO agricultural land statistics, USDA ERS farm income tables, Eurostat agri-tech adoption surveys, OECD digital-ag policy databases, and peer-reviewed studies indexed on IEEE Xplore. Company filings, IPO prospectuses, and trade-association briefs (e.g., AEM, CEMA) enrich competitive intelligence, while D&B Hoovers and Dow Jones Factiva supply revenue splits and funding trails for private vendors. Patent trends gathered via Questel highlight emerging modules like carbon-credit tracking. The sources listed illustrate but do not exhaust the secondary reservoir tapped by analysts.
Market-Sizing & Forecasting
A top-down model translates cultivated hectares and livestock headcounts into a software addressable pool, applying region-specific penetration ratios that are then stress-tested with sampled average selling price multiplied by active-farm estimates (bottom-up cross-check). Key variables include arable land trends, smartphone and cellular IoT penetration, government digital-ag subsidy outlays, precision equipment shipments, and commodity-price indexed farm profitability. Multivariate regression projects each driver, with scenario bands refined through expert consensus. Where supplier roll-ups under-report emerging SaaS entrants, interpolation fills gaps before final triangulation.
Data Validation & Update Cycle
Outputs undergo anomaly screening, senior analyst review, and variance checks against independent metrics; we refresh every twelve months and re-open the model after material events, ensuring clients receive the latest vetted baseline.
Why Mordor's Farm Management Software Baseline Commands Reliability
Published values often diverge because firms stretch or shrink scope, mix currencies, or freeze assumptions. By centering only on monetizable software and by re-checking drivers yearly, Mordor delivers a balanced figure stakeholders can confidently defend.
Key gap drivers include rival inclusion of precision hardware revenue, wider agriculture analytics suites, one-off installation fees, or five-year-old currency conversions that inflate totals.
Benchmark comparison
| Market Size | Anonymized source | Primary gap driver |
|---|---|---|
| USD 2.80 B (2025) | Mordor Intelligence | |
| USD 3.40 B (2024) | Global Consultancy A | Includes hardware and on-farm sensors in scope; uses 2023 FX rates without annual rebasing |
| USD 4.76 B (2025) | Trade Journal B | Treats broader "farm analytics" platforms, counts multi-year service bundles upfront |
| USD 3.20 B (2025) | Industry Association C | Applies optimistic penetration to smallholders and projects at constant 2024 prices |
Taken together, the comparison shows that when duplicate revenue streams and static assumptions are stripped away, the Mordor Intelligence baseline remains the most transparent, current, and repeatable foundation for decision-making.


Key Questions Answered in the Report
How large is the farm management software market in 2026?
The farm management software market reached USD 3.25 billion in 2026.
Which deployment model leads current spending?
Cloud-based platforms hold 48.2% of 2025 revenue and are the fastest-growing model due to subscription pricing and rural connectivity improvements.
What segment is expanding the quickest?
Aquaculture management tools are forecast to rise at a 13.5% CAGR through 2031 as seafood producers adopt real-time water quality monitoring for export traceability.
How do smallholders benefit from digital adoption?
Subsidized mobile apps and cooperative programs help small farms increase yields up to 15% while lowering input costs by double digits, accelerating a projected 15.6% CAGR for the segment.
What keeps adoption from accelerating even faster?
High upfront costs, fragmented land tenure, limited broadband, and interoperability problems with legacy machinery remain the chief obstacles.
Page last updated on:


