
Market Overview
| Study Period | 2020 - 2031 |
|---|---|
| Forecast Data Period | 2026 - 2031 |
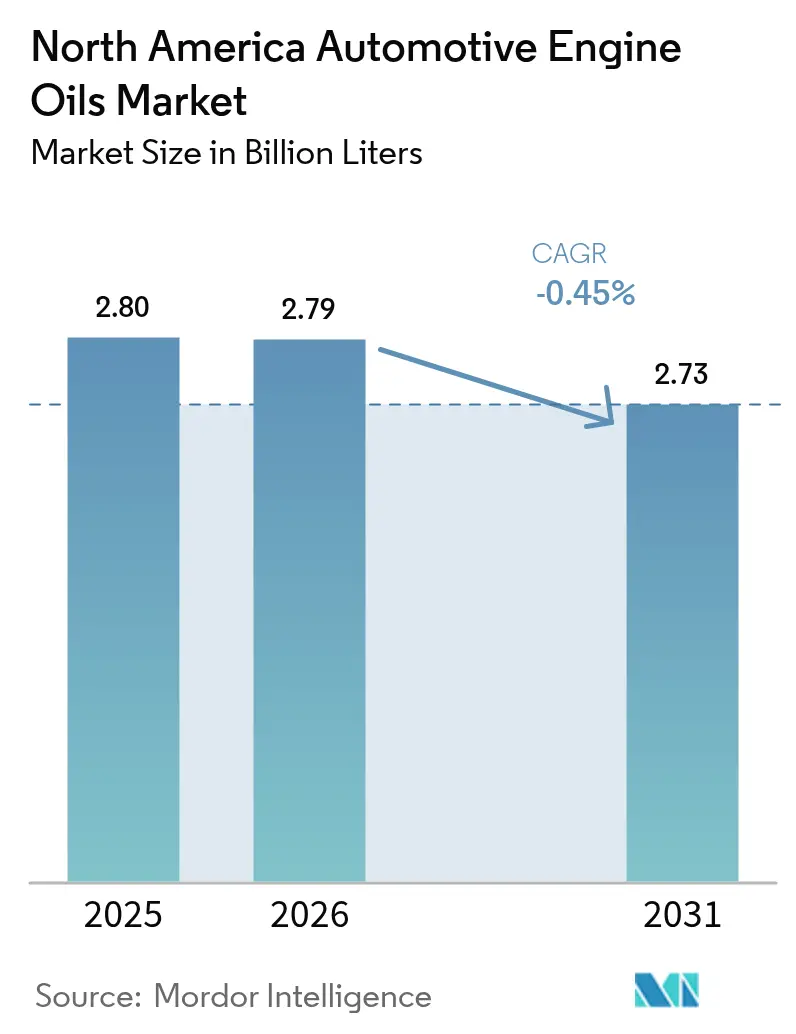
| Base Year Market Size (2025) | 2.80 Billion Liters |
| Market Volume (2026) | 2.79 Billion Liters |
| Market Volume (2031) | 2.73 Billion Liters |
| Growth Rate (2026 - 2031) | -0.45 % |
| Market Concentration | Medium |
Major Players *Disclaimer: Major Players sorted in no particular order Image © Mordor Intelligence. Reuse requires attribution under CC BY 4.0. | |
North America Automotive Engine Oils Market Analysis by Mordor Intelligence
The North America Automotive Engine Oils Market size is expected to grow from 2.80 Billion Liters in 2025 to 2.79 Billion Liters in 2026 and is forecast to reach 2.73 Billion Liters by 2031 at -0.45% CAGR over 2026-2031. This negative growth trajectory is shaped by faster electrification, longer drain intervals, and rigorous CAFÉ and greenhouse-gas rules that collectively trim lubricant volumes while shifting demand toward premium synthetics. Regulatory actions, such as the Environmental Protection Agency’s 2027 heavy-duty standards, which require roughly 75% lower NOx and 50% lower particulate emissions, are prompting formulators to develop low-viscosity 0W-XX and 10W-30 products that improve fuel economy while reducing consumption per service. At the same time, the Department of Energy’s target of 55 million plug-in vehicles on US roads by 2032 materially erodes the internal-combustion parc, which has historically consumed the most engine oils. Against this backdrop, premium synthetic producers benefit from higher per-unit value, rapid OEM factory-fill transitions, and opportunities in re-refined base stocks that align with corporate ESG goals. Competitive intensity remains high as integrated oil majors, specialist blenders, and sustainability-focused newcomers all vie for a share in a shrinking market. Consolidation—epitomized by Aramco’s USD 2.65 billion purchase of Valvoline’s global products unit—illustrates the pivot toward scale efficiencies and portfolio focus amid structural headwinds.
Key Report Takeaways
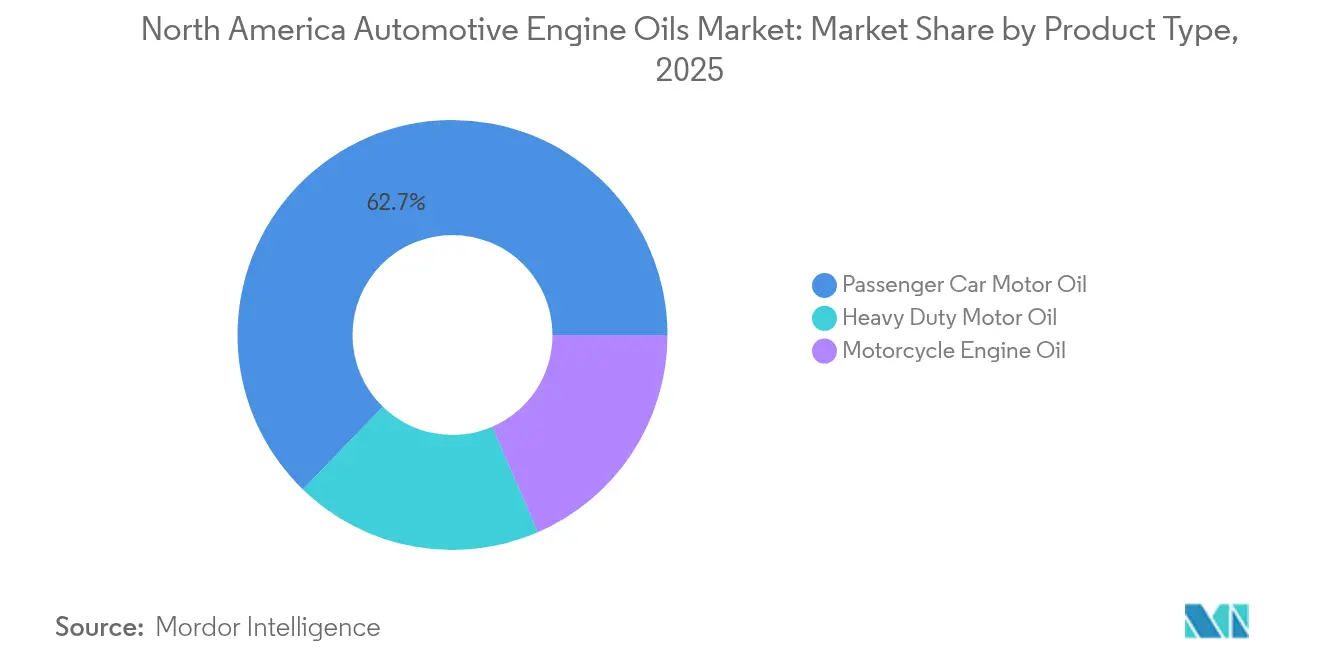
- By product type, passenger car motor oil led with 62.75% of the North America automotive engine oils market share in 2025. Motorcycle engine oil is forecast to record the mildest decline at a -0.35% CAGR through 2031.
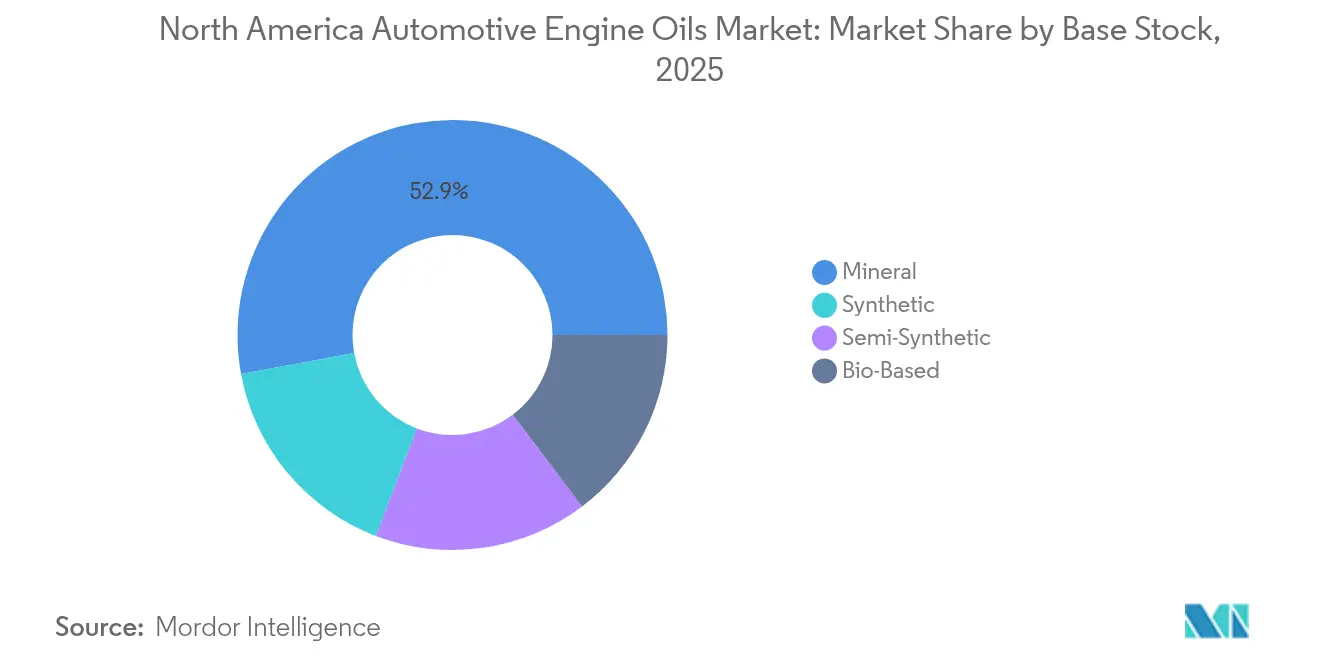
- By base stock, mineral oils accounted for 52.90% of the North America automotive engine oils market size in 2025, whereas full synthetics post the smallest drop at a -0.21% CAGR.
- By geography, the United States commanded 86.20% of the North America automotive engine oils market share in 2025, while Canada shows the slowest contraction at a -0.06% CAGR out to 2031.
Note: Market size and forecast figures in this report are generated using Mordor Intelligence’s proprietary estimation framework, updated with the latest available data and insights as of 2026.
Market Trends and Insights
Drivers Impact Analysis of North America Automotive Engine Oils Market*
| Driver | (~) % Impact on CAGR Forecast | Geographic Relevance | Impact Timeline |
|---|---|---|---|
| Tightening CAFÉ and GHG regulations driving demand for low-viscosity, high-performance oils | +0.8% | Global, with strongest impact in US and Canada | Medium term (2-4 years) |
| OEM factory-fill shift toward synthetics and 0W-XX grades | +0.6% | North America core, spill-over to Mexico | Long term (≥ 4 years) |
| Rising average vehicle age boosting aftermarket oil consumption | +0.4% | US and Canada primarily | Short term (≤ 2 years) |
| Growing ride-hailing and last-mile delivery fleet miles | +0.3% | Urban centers across North America | Medium term (2-4 years) |
| ESG-driven uptake of re-refined base-oil blends | +0.2% | US and Canada, early adoption markets | Long term (≥ 4 years) |
| Source: Mordor Intelligence | |||
Tightening CAFÉ and GHG Regulations Drive Premium Oil Demand
The Environmental Protection Agency’s Phase 3 greenhouse-gas program compels OEMs to cut heavy-duty CO₂ by roughly 50% by 2045, prompting lubricant makers to commercialize lower-viscosity PC-12 heavy-duty oils in 2026 that can unlock up to 3% fuel savings in fleet trials[1]. Similar efficiency imperatives under ILSAC GF-7 for passenger cars are driving demand for 0W-16 and 0W-20 synthetics, which offer improved high-temperature shear stability. Field data from CITGARD tests confirm a 2.1% fuel-economy gain when fleets switch from 15W-40 to optimized 10W-30 formulations. As state and federal carbon-reduction policies converge, the regulatory cascade secures a durable premium segment, even as aggregate volumes decline. Blenders able to validate performance under the American Petroleum Institute’s new durability tests are positioned to capture share.
OEM Factory-Fill Synthetic Adoption Reshapes Product Mix
North American vehicle makers are embedding synthetic specifications in factory fill to meet warranty extensions and thermal load demands in turbocharged engines. General Motors’ dexos1 Gen3 specification imposes tighter sludge and LSPI limits, effectively standardizing the use of full synthetic 0W-20 or 5W-30 in new cars. In the heavy-duty sector, leading truck OEMs are now approving 10W-30 FA-4 oils, which is accelerating aftermarket acceptance. ExxonMobil forecasts 80% growth in high-value performance lubricants by 2030 and is expanding PAO output to support OEM partnerships. Synthetics command a higher price-mix even as drain intervals lengthen, cushioning revenue decline for suppliers with advanced base-stock capacity.
Rising Average Vehicle Age Boosts Aftermarket Consumption
The region’s average light-vehicle age rose to 12.6 years in 2025, the highest on record, a trend that keeps older engines in circulation longer and supports demand for higher-viscosity 5W-30 and 10W-40 grades formulated for wear control in legacy hardware. Independent repair shops report an increased use of high-mileage synthetics containing seal conditioners, while fleet operators retain trucks for longer depreciation cycles, which require incremental oil changes before retirement. Although electrification tempers long-term prospects, the near-term parc mix adds a modest uplift to lubricant-service occasions.
Growing Ride-Hailing and Last-Mile Delivery Miles
Urban mobility platforms and e-commerce logistics have expanded annual vehicle kilometers, particularly for light vans and hybrid sedans. Higher utilization translates to accelerated oil-change frequency even with extended-drain synthetics, offsetting part of the demand lost to efficiency gains. Major platform operators prescribe OEM-approved 0W-20 synthetics to minimize downtime, reinforcing premium-grade penetration. As last-mile fleets prioritize total cost of ownership, formulators that can document fuel economy and durability benefits capture contractual supply deals.
Restraints Impact Analysis of North America Automotive Engine Oils Market*
| Restraint | (~) % Impact on CAGR Forecast | Geographic Relevance | Impact Timeline |
|---|---|---|---|
| Accelerating BEV and hybrid penetration lowering oil demand | -1.2% | Global, with US leading adoption | Medium term (2-4 years) |
| Extended OEM drain-interval recommendations | -0.7% | North America and global markets | Short term (≤ 2 years) |
| Supply-chain pressure on API Group III/IV base stocks | -0.4% | Global supply chains affecting North America | Short term (≤ 2 years) |
| Source: Mordor Intelligence | |||
Accelerating BEV and Hybrid Penetration Reduces Oil Demand
Plug-in sales reached new highs in 2024, and the Department of Energy projects 55 million EVs by 2032, displacing a substantial fraction of oil consumption. Hybrids still require lubricant, but at lower volumes because engines operate intermittently and at optimized loads. State-level zero-emission mandates—California’s Advanced Clean Cars II being a notable example—further compress the serviceable market. While new fluids for e-axles and thermal management emerge, fill-for-life designs and smaller sump volumes render these a fraction of traditional demand.
Extended OEM Drain-Interval Recommendations
As synthetic-technology resilience improves, automakers are pushing oil-change guidance from the traditional 5,000-mile regime to 10,000–15,000 miles for mainstream cars and up to 25,000 miles in select premium products from Castrol and Mobil 1[2]. On-board oil-life monitors refine intervals based on duty cycle, thereby reducing the need for aftermarket visits. Heavy-duty fleets deploying FA-4 synthetics achieve 70,000–100,000-mile drain intervals under oil-analysis programs, reducing annual lubricant needs per truck.
*Our forecasts treat driver/restraint impacts as directional, not additive. The impact forecasts reflect baseline growth, mix effects, and variable interactions.
North America Automotive Engine Oils Market Segment Analysis
By Product Type:
Passenger Car Oils Lose Volume but Retain ValuePassenger car motor oil currently accounts for 62.75% of the total volume, yet the adoption of electric vehicles sets the segment on a downward slope. The North America automotive engine oils market recorded its peak PCMO consumption during 2019–2024, after which volumes started to shrink as battery-only cars expanded their share. Despite that contraction, synthetics aligned with ILSAC GF-7 continue to capture market share, allowing suppliers to defend their revenue. OEM factory-fill mandates for Dexos1 Gen3 and GF-7 spark stronger pull-through at dealerships, while quick-lube chains upsell 0W-20 full synthetic oils to maintain ticket size.
Heavy-duty motor oil ranks second by liters and benefits from freight growth, even as efficiency programs temper volume. Fleet pilots have shown that switching to new FA-4 10W-30 oils can unlock fuel-economy gains of 1–4%, supporting price premiums. Over the forecast period, motorcycle engine oil is expected to slip least, with a -0.35% CAGR, owing to the growing popularity of electric motorcycles, scooters, and e-bikes. Improvements in battery life, charging infrastructure, and overall performance have made electric two-wheelers a more affordable, practical, and attractive option for consumers.

By Base Stock:
Synthetics Edge Ahead as Specifications TightenMineral oils are expected to retain a 52.90% share in 2025, but every new vehicle entering service requires at least a synthetic blend, accelerating the shift. The North America automotive engine oils market size for mineral grades is projected to decline faster than the overall decline as environmental regulations cap VOC emissions from solvent-refined Group I production. Semi-synthetics remain a budget bridge product, mixing Group II with 10–30% Group III to hit mid-tier price points.
Full synthetics, powered by Group III and Group IV, achieve the shallowest drop at -0.21% CAGR to 2031. The demand for synthetic engine oil in North America is predicted to decline in the coming years, primarily due to the accelerated adoption of electric vehicles (EVs). Integrated producers Chevron and ExxonMobil leverage their GTL and PAO capacities to secure supply. CHEVRON.COM. Bio-based lubricants, although small, are gaining traction with municipal fleets seeking to reduce lifecycle carbon emissions by up to 50%. Castrol’s re-refined blends under the MoreCircular banner exemplify how ESG targets translate into purchasing criteria.
Geography Analysis
United States Automotive Engine Oils Market
The United States dominates the North America automotive engine oils market, accounting for 86.20% of the 2025 volume. Federal CAFÉ standards and EPA Phase 3 rules require lower-viscosity formulations that enhance synthetic penetration while reducing liters. Domestic base-oil production from Baytown, Pascagoula, and Richmond refineries underpins supply security, though upcoming Group III investments lag Asian capacity builds. Connected-car data streams funnel service traffic to dealerships, pressuring independent quick-lube operators but opening channels for OEM-branded oils. State-level ZEV mandates accelerate electrification, reducing future demand while catalyzing the development of proprietary EV driveline fluids.
Canada Automotive Engine Oils Market
Canada, though smaller, contracts the least due to its severe winters, which necessitate premium 0W-20 and 5W-30 synthetics with pour points below -40°C. Rural resource-extraction vehicles and off-road machinery sustain diesel-engine oil volumes. Ottawa’s goal to sell only zero-emission light vehicles by 2035 coexists with heavy-duty exemptions in mining and forestry that still require high-TBN 15W-40 oils. Provincial VOC limits encourage low-sulfur base stocks, aligning with US formulations and enabling cross-border supply synergies.
Mexico Automotive Engine Oils Market
Mexico contributes the smallest share but benefits from automotive manufacturing and a younger vehicle parc that continues to rely on internal-combustion powertrains. PEMEX’s Olmeca refinery brings 340,000 bpd of capacity that can back-integrate Group II base oils, reducing import reliance. Electrification adoption lags, affording mineral-oil volumes a longer runway. Nevertheless, planned alignment with US emissions regulations will progressively elevate synthetic demand over the next decade.
Regulatory Landscape
Regulatory requirements in North America influence engine-oil viscosity trends and performance testing, which links lubricant formulations to vehicle fuel economy and emissions compliance. In the United States, EPA and NHTSA rules for light-duty vehicles through model years 2024-2026, and EPA heavy-duty engine standards for MY 2027 and later, reinforce the push toward lower-viscosity, higher-performance PCMO and HDMO grades, including greater use of SAE 0W-XX and 10W-30, to help OEMs manage GHG and criteria-pollutant targets. In July 2026, EPA issued an NPRM proposing revisions to useful life and warranty periods for MY 2027 and later heavy-duty highway engines, with provisions extending the applicability of MY 2026 standards through 2029, shaping how long emissions-related durability is demonstrated and, in turn, oil performance requirements across longer service periods.
Industry standards and Canadian ZEV policy also affect product mix and labeling. API 1509 governs licensing and marketing of API-certified engine oils, while ILSAC GF-7A/GF-7B and API SQ became available for licensing effective March 31, 2025, aligning gasoline engine-oil performance with newer engine hardware, including turbocharged and GDI applications, and fuel-economy objectives. In Canada, amendments to the Passenger Automobile and Light Truck Greenhouse Gas Emission Regulations (SOR/2023-275) set ZEV sales targets beginning in model year 2026 and rising toward 100% by 2035, tightening the technical and documentation bar for lubricants sold into OEM and service channels as ICE growth faces structural pressure.
Value Chain Analysis
The value chain begins with base oils, predominantly Group II in North America alongside increasing Group III availability, and additive packages, then moves to blending, packaging, distribution, and end-use channels including OEM factory fill, dealerships, quick-lube chains, independent workshops, and fleets. North American base-oil capacity is estimated at about 14.95 million metric tons per year, with the United States at about 13.26 million t/y. Much of this supply is integrated with U.S. Gulf Coast refinery systems, supporting large-volume PCMO and HDMO production, while some specialty synthetics and co-base oils remain more exposed to supply tightness.
Midstream players include integrated majors and independent blenders that use custom additive packages, toll blending, and regional logistics to manage grade complexity and OEM approvals. Toll and contract manufacturing supports flexibility for smaller brands, while trade and technical bodies, notably API licensing, function as a gatekeeper for category claims and retail labeling. Upstream specialization is also expanding, with King Industries reporting in March 2026 that its alkylated naphthalene production facility in Waterbury, Connecticut became fully operational, reflecting investment in high-performance co-base oils that can help formulators meet newer low-viscosity, extended-drain, and deposit-control requirements.
Competitive Landscape
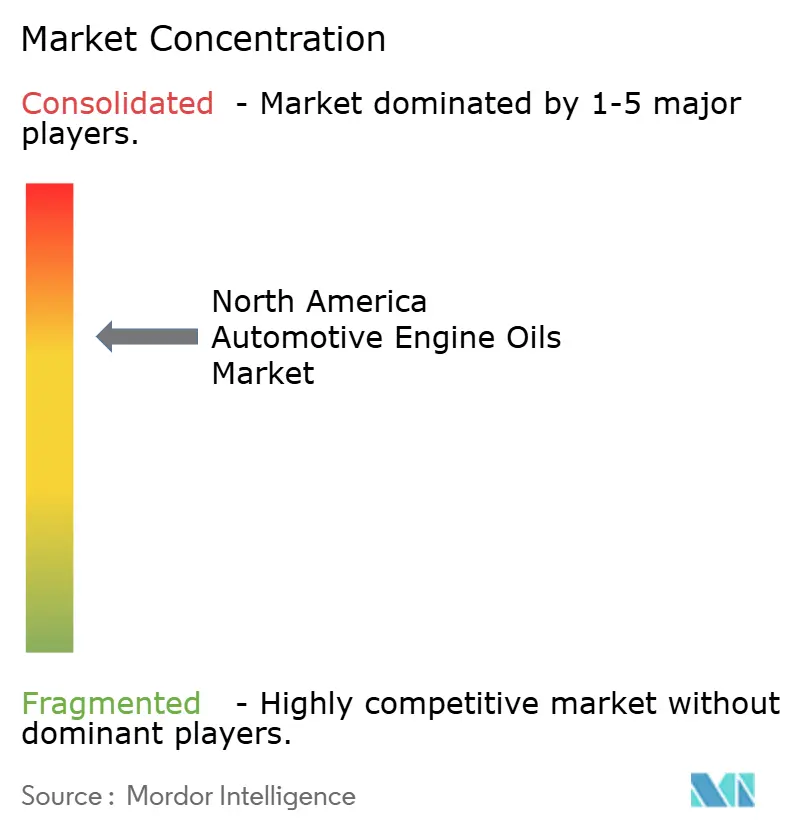
The North America Automotive Engine Oils Market is consolidated. Competition centers on integrated majors—ExxonMobil, Chevron, Shell, and BP Castrol—leveraging crude-to-molecule scale, captive PAO/GTL assets, and direct OEM relationships. Their broad portfolios span PCMO, HDDO, and emerging EV fluids, enabling cross-segment resilience. API’s licensing framework and OEM approval matrices remain formidable entry barriers, but data-driven maintenance platforms and private-label programs furnish new avenues for challenger brands seeking share.
North America Automotive Engine Oils Industry Leaders
-
Chevron Corporation
-
ExxonMobil Corporation
-
Shell plc
-
BP p.l.c.
-
Saudi Arabian Oil Co.
- *Disclaimer: Major Players sorted in no particular order
North America Automotive Engine Oils Market Companies Covered in this Report
- AMSOIL INC.
- BP plc
- Chevron Corporation
- CITGO Petroleum Lubricants
- Exxon Mobil Corporation
- FUCHS
- HollyFrontier (Petro-Canada Lubricants)
- Idemitsu Lubricants America
- Kendall Motor Oil
- LIQUI MOLY
- Lucas Oil Products, Inc.
- Motul
- Phillips 66 Lubricants
- Shell plc
- TotalEnergies
- Saudi Arabian Oil Co.
Read Analysis of North America Automotive Engine Oils Companies
Market Opportunities and Future Outlook
Near-term opportunity centers on premium, specification-driven engine oils and the supply chain that supports them, even as total liters decline. The March 31, 2025 availability of ILSAC GF-7A/GF-7B and API SQ licensing reinforces a reset of passenger-car formulations toward newer performance tests and lower-viscosity grades. That shift creates time-sensitive whitespace for blenders and marketers to secure approvals and transition inventories across retail and installer channels. In heavy-duty oils, regulatory direction tied to EPA standards and durability expectations has focused attention on HDMO viscosity shifts, including wider adoption of 10W-30 FA-4 type products, which increases demand for additive systems and base stocks that maintain wear control and oxidation stability across longer drain programs.
An additional opportunity is tied to higher-quality domestic base-stock supply to reduce reliance on imported Group III and improve availability for synthetic and synthetic-blend engine oils. In June 2026, Vertex Energy announced an expansion project at its Mobile, Alabama refinery to add 6,000 bpd of conventional Group III base-oil production using existing hydrocracker infrastructure. Chevron also communicated plans for full-scale Group III+ output, NEXBASE 4 XP, at Pascagoula, Mississippi in 4Q 2026. Both moves support in-region sourcing for GF-7 and API SQ-aligned formulations. As API 1509 licensing guidance was updated in July 2026, and the GF-6 to GF-7 overlap period ended in October 2026, channel conversion activity, including inventory management, installer recommendations, and private-label reformulations, becomes a practical near-term lever for suppliers that can align packaging, claims, and approvals across the United States, Canada, and Mexico.
Recent Industry Developments in North America Automotive Engine Oils Market
- June 2026: Vertex Energy announced an expansion project at its Mobile, Alabama refinery to add 6,000 barrels per day of conventional Group III base oil production capacity using existing hydrocracker infrastructure. The move increases domestic availability of higher-performance base stocks used in premium passenger car and heavy-duty engine oils. Greater in-region Group III supply supports GF-7/API SQ-aligned formulations and can reduce import exposure for North American blenders.
- December 2025: Catalys Lubricants announced a distribution agreement with Chevron Canada Limited to supply products across Saskatchewan and Manitoba. The agreement expands Chevron-branded lubricant reach in the Canadian Prairies through a local distributor footprint. Wider regional coverage strengthens installer access to OEM- and API-licensed grades, supporting mix shift toward higher-spec products.
- March 2024: Shell highlighted Shell Helix Ultra positioning around the newer API SQ standard for gasoline engine oils. The communication emphasized alignment with updated performance requirements tied to modern engine hardware and efficiency needs. By promoting premium, specification-forward PCMO, major brands reinforced the ongoing migration toward higher-value synthetics as category standards tighten.
North America Automotive Engine Oils Market Report Scope and Research Methodology
Market Definition and Coverage
For this study, the market covers finished automotive engine oil consumed in North America for on-road vehicles, counted as the volumes sold for engine lubrication during regular service and maintenance cycles.
Scope exclusions: We exclude industrial lubricants, marine and aviation oils, factory fill that is not separately sold through the aftermarket, and non-engine automotive fluids such as ATF, gear oils, greases, and coolants.
Segments Covered in This Report
- By Product Type
- Passenger Car Motor Oil (PCMO)
- 0W-XX
- 5W-XX
- 10W-XX
- 15W-XX
- Monogrades
- Other Grades
- Heavy Duty Motor Oil (HDMO)
- 0W-XX
- 5W-XX
- 10W-XX
- 15W-XX
- Monogrades
- Other Grades
- Motorcycle Engine Oil (MCO)
- 0W-XX
- 5W-XX
- 10W-XX
- 15W-XX
- Monogrades
- Other Grades
- Passenger Car Motor Oil (PCMO)
- By Base Stock
- Mineral
- Synthetic
- Semi-Synthetic
- Bio-Based
- By Geography
- United States
- Canada
- Mexico
Data Sources, Market Sizing, and Validation
Desk Research
Desk work starts with building a clean demand picture for the region, and then we cross-check it with vehicle activity and lubricant indicators. Public sources such as the US Energy Information Administration lubricants supply series, US Bureau of Transportation Statistics vehicle activity indicators, and Statistics Canada transport and industry tables help us sanity check direction and scale. For the Mexico view, we refer to national statistics and trade releases such as INEGI, and we also use UN Comtrade-style trade statistics to understand import and export movement patterns for lubricant products.
On top of that, we review engine oil specification bodies and test sequence references (such as API and SAE publications) so we can link viscosity and service category shifts to real drain interval behavior. Company annual reports, investor decks, and reputable press coverage are used to validate product mix moves (synthetic versus conventional) and channel changes. Where needed, we also use paid subscriptions for company financials and shipment-level trade data to tighten assumptions around pricing and flows. These are examples of what we checked, and we used additional sources to confirm inputs, validate totals, and close remaining questions.
Primary Interviews and Surveys
Primary work is used to pressure test the desk assumptions that usually drive the most variance in engine oil sizing, and we also use it to confirm what is truly counted as engine oil sales in each country. We spoke with a mix of blenders, distributors, retailers, and service channel participants, and then we also covered fleet and workshop viewpoints to validate drain intervals, pack size mix, and synthetic adoption. Since the study is regional, inputs were gathered across the United States, Canada, and Mexico so that local channel structures and pricing dynamics were not averaged too early.
Distribution of primary research fieldwork respondents
| Company type | Respondent position |
|---|---|
| Top tier: 37% | CXOs: 15% |
| Mid tier: 47% | Functional/Unit leaders: 36% |
| Smaller Players: 16% | Managers: 49% |
Market-Sizing & Forecasting
Sizing is built using a top-down demand pool, where vehicle parc and utilization signals are translated into oil change events, which are then converted into liters through typical sump fill and drain interval patterns. Key inputs we track include on-road vehicle parc by country, average annual miles driven, oil drain intervals by vehicle age and duty cycle, synthetic penetration trends, and the shift in viscosity grades tied to newer engine requirements. Because pricing can move the totals meaningfully, we also run a simple price ladder by pack type and sales channel to keep the value view consistent when the data allows it.
The totals are then corroborated with selective bottom-up checks, like rolling up sampled channel volumes and using sampled average selling price times volume for representative packs, followed by adjustments where coverage gaps show up. If an indicator is missing for a smaller country slice or a niche vehicle type, we bridge it using proxy ratios, such as parc share, service intensity, and channel mix, and then we confirm the reasonableness with interview feedback. For forecasting, we lean on scenario analysis anchored to expected parc change, electrification impact on internal combustion service demand, and drain interval progression, and those scenarios are narrowed using expert consensus gathered in the primary work.
Data Validation & Update Cycle
After the model is built, we run consistency checks across countries and years so any sharp jumps can be explained by a real signal, not an input error. Outputs are compared against independent indicators such as lubricants supply trends, trade movements, and vehicle activity series, and then flagged variances are reviewed by another analyst before sign-off. When a mismatch cannot be explained cleanly, respondents are re-contacted to confirm whether it is a channel shift, a pricing change, or a scope interpretation issue.
The report is refreshed on an annual cycle, and interim updates are made if there is a material event that changes demand, pricing, or regulation assumptions. Right before delivery, we do a final refresh pass so the published numbers reflect the latest available public releases and field feedback.
Mordor Intelligence's North America Automotive Engine Oils Market Size Compared With Other Published Estimates
Published market numbers for North America automotive engine oils can look far apart, even when they describe a similar end use. This usually happens because the scope line is drawn differently, and because demand drivers such as drain intervals and synthetic mix are not treated with the same discipline.
Some sources report a value figure that blends engine oil with wider automotive lubricants, and then it is pushed further by aggressive price growth assumptions. In that split, Mordor Intelligence counts only finished automotive engine oils in North America and anchors volume to parc, miles driven, and service intervals before any pricing layer is applied.
Benchmark comparison
| Source | Market Size | Gaps in Research Methodology |
|---|---|---|
| Mordor Intelligence | USD 0.00 B (2025) | |
| Trade Journal A | USD 2.93 B (2024) | Often presented as a revenue view with limited visibility on liters, and it can reflect a blended product bucket where engine oil sits alongside adjacent lubricant products, which inflates the comparable total. |
| Industry Publisher B | USD 9.91 B (2025) | This estimate is specific to synthetic engine oils, and it commonly assumes steady premium pricing across the forecast, which cannot be compared directly to a total engine oil market that also includes conventional and semi-synthetic volumes. |
The table shows that most of the spread comes from scope selection first, then from how price is carried forward. When the market is anchored to a clear demand pool (vehicles, usage, and service behavior) and only then translated into value, the result is easier to audit and repeat year to year.
Key Questions Answered in the Report
What is the current volume of the North America automotive engine oils market?
The North America Automotive Engine Oils Market size is estimated at 2.79 Billion Liters in 2026, and is expected to decline to 2.73 Billion Liters by 2031.
How fast is the market expected to shrink?
Volume is forecast to decline at a -0.45% CAGR from 2026 to 2031.
Which product category retains the largest share?
Passenger car motor oil accounts for 62.75% of total volume in 2025.
Why are synthetics gaining mix even as overall liters fall?
OEM factory-fill mandates, extended drain intervals, and CAFÉ rules require the performance advantages of synthetic base stocks.
How will electrification affect lubricant demand by 2031?
Plug-in and hybrid adoption is projected to strip approximately 1.2 percentage points from the market CAGR, accelerating volume decline.