Fresh Pumpkin Market Size and Share
Fresh Pumpkin Market Analysis by Mordor Intelligence
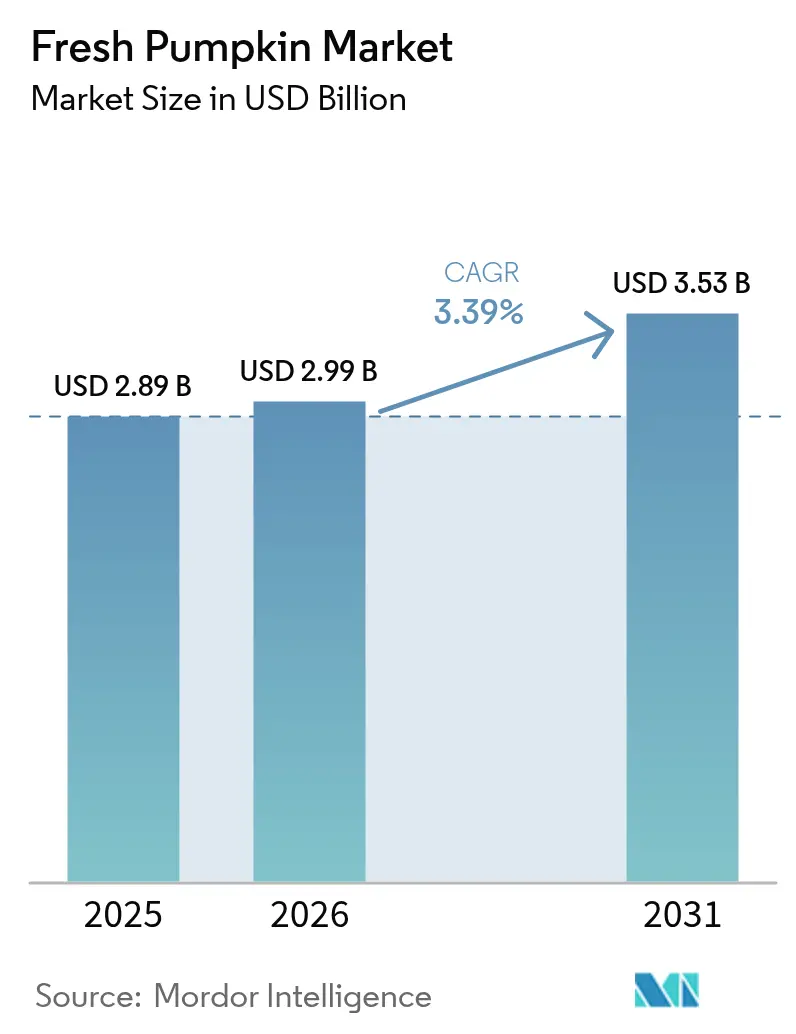
The fresh pumpkin market size is expected to grow from USD 2.89 billion in 2025 to USD 2.99 billion in 2026 and is forecast to reach USD 3.53 billion by 2031 at 3.39% CAGR over 2026-2031. This growth is driven by a shift in demand from whole-fruit sales to processed formats, functional ingredients, and industrial feedstocks. The Asia-Pacific region, led by China's significant production, accounts for half of the current consumption. Africa is experiencing the highest regional growth, supported by increased smallholder production, the establishment of new cold-chain facilities in Egypt and South Africa, and the scaling of seed exports from Malawi. Innovations in processing, such as seed-protein isolation and stand-up-pouch puree, are reducing reliance on autumn seasonality and enabling year-round production. Competitive dynamics remain uneven, with Libby’s single hub in Morton, Illinois, dominating canned pumpkin supply, while numerous fresh fruit and seed growers operate in fragmented spot markets.
Key Report Takeaways
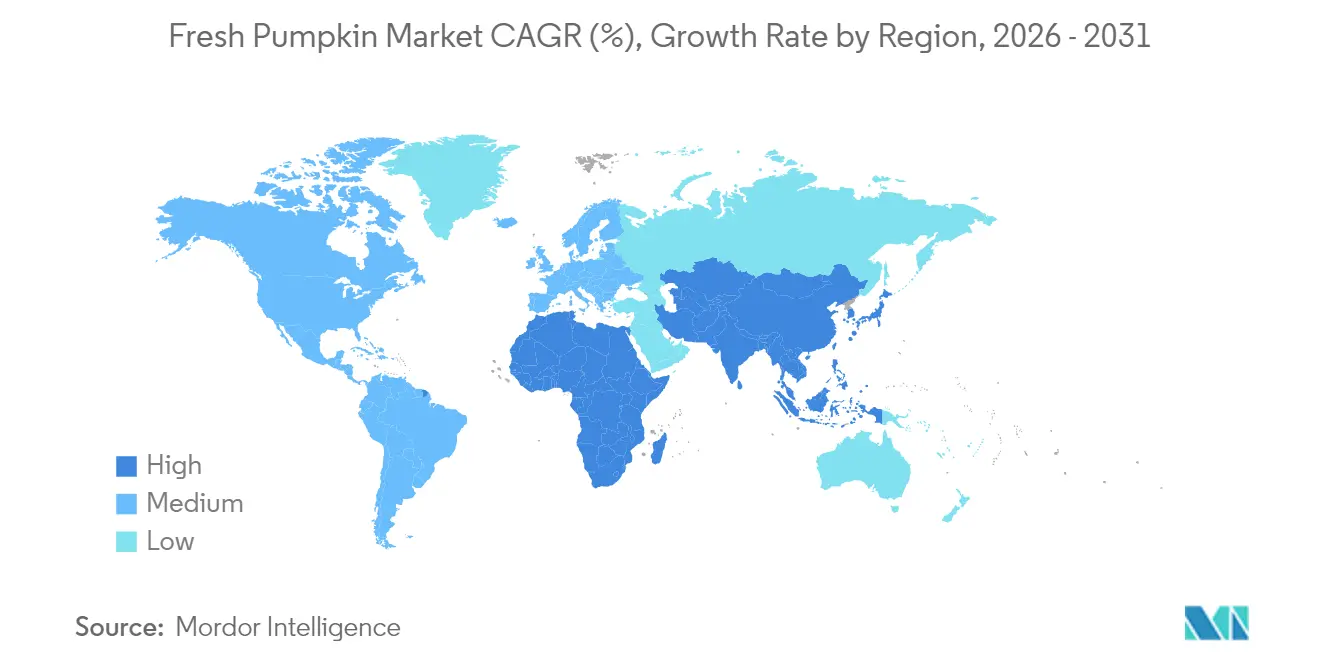
- By geography, the Asia-Pacific captured 50.20% of the fresh pumpkin market share in 2025, and Africa is projected to expand at a 3.88% CAGR through 2031, the fastest among all regions.
Note: Market size and forecast figures in this report are generated using Mordor Intelligence’s proprietary estimation framework, updated with the latest available data and insights as of 2026.
Global Fresh Pumpkin Market Trends and Insights
Drivers Impact Analysis*
| Driver | (~) % Impact on CAGR Forecast | Geographic Relevance | Impact Timeline |
|---|---|---|---|
| Surging Demand from Health-Conscious Consumers | +0.80% | North America and Europe, spillover in Asia | Medium term (2-4 years) |
| Popularity of Cultural and Seasonal Events | +0.60% | North America dominant, rising in Europe and urban Asia | Short term (≤ 2 years) |
| Growth in Processed Pumpkin Demand | +0.70% | North America processing hubs, Asia-Pacific consumption | Medium term (2-4 years) |
| Rising Pet-Food Formulations Using Pumpkin Fiber | +0.40% | North America and Europe | Medium term (2-4 years) |
| Government Support for Nutrient-Dense Crops | +0.30% | Asia-Pacific and Africa | Long term (≥ 4 years) |
| Use of Pumpkin Residue in Bio-Based Plastics | +0.20% | Europe and North America | Long term (≥ 4 years) |
| Source: Mordor Intelligence | |||
Surging Demand from Health-Conscious Consumers
Wellness positioning has transformed pumpkin into a year-round functional ingredient within the fresh pumpkin market. Seed-protein isolates achieve extraction yields of 25%–35%, while ultrasound combined with pH-shift treatments enhances solubility to 69.1%, comparable to that of soy protein [1]Source: Adebowale K., “Enhancing Techno-Functionality of Pumpkin Seed Protein,” sciencedirect.com. Pumpkin purée's low glycemic index enables bakers to reduce refined sugar without compromising texture, and its high carotenoid content supports front-of-pack vitamin A claims. In North America, retail buyers increasingly request detailed nutrient profiles during category reviews, driving the adoption of pumpkin seed protein in plant-based meat and dairy products.
Popularity of Cultural and Seasonal Events
Halloween and Thanksgiving continue to sustain the visibility of the fresh pumpkin market, though the seasonal demand period is expanding. In the United States, pumpkin-flavored product launches now commence as early as late August, with restaurants incorporating pumpkin spice into cocktails, pasta dishes, and breakfast menus. Illinois remains the leader in pumpkin processing. In Europe, urban centers are experiencing double-digit growth in the adoption of carved-pumpkin traditions, while social media drives increased experimentation with pumpkin-based recipes. To capitalize on this visibility, suppliers are emphasizing premium, organic, and heirloom varieties and leveraging direct-to-consumer shipping models to minimize their reliance on commodity pricing.
Growth in Processed Pumpkin Demand
Processed formats are contributing to an increasing farm-gate value within the fresh pumpkin market. Pumpkin seed oil is valued in both cosmetic and culinary applications due to its high content of linoleic acid and tocopherols. The use of combined enzymatic and ultrasound extraction methods enhances yields to over 40% while maintaining flavor integrity[2]Vinay Kumar Pandey and coauthors, “Current Strategies to Modify Functional Properties of Pumpkin Seed Protein,” horticulturae.org. For pumpkin purée, autoclave sterilization at 121°C for 10 to 30 minutes effectively eliminates microbial load but impacts volatile compounds, requiring careful adjustment of dwell time to achieve optimal sensory quality. Ambient-stable stand-up pouches reduce dependence on cold-chain logistics, making purée more accessible in emerging markets with limited refrigerated infrastructure. Additionally, by-product seed cake is being repurposed into protein concentrates and biodegradable films, supporting circular economy initiatives.
Rising Pet-Food Formulations Using Pumpkin Fiber
Digestive health claims are a key driver in pet nutrition, with pumpkin fiber's combination of soluble and insoluble properties providing motility support without the need for additives. Premium pet food brands in North America and Europe are enhancing their formulations by incorporating pumpkin, sustaining ingredient demand even during periods of reduced human consumption. Brand owners prioritize suppliers that offer complete farm-to-bag traceability and ensure the absence of heavy metals, following recalls involving other plant fibers. Additionally, cross-channel exposure supports human snacking brands like SuperSeedz, which have expanded through national natural-food distributors.
Restraint Impact Analysis*
| Restraint | (~) % Impact on CAGR Forecast | Geographic Relevance | Impact Timeline |
|---|---|---|---|
| High Post-Harvest Losses in Developing Regions | -0.50% | Africa, South Asia, rural South America | Short term (≤ 2 years) |
| Seasonality Constraining Year-Round Supply | -0.40% | Temperate zones worldwide | Medium term (2-4 years) |
| Price Pressure from Substitute Squash Varieties | -0.30% | Processed-purée and fresh-retail segments | Medium term (2-4 years) |
| Fragmented Grower Base Limiting Scale | -0.30% | Africa and South Asia, smallholder Europe segments | Long term (≥ 4 years) |
| Source: Mordor Intelligence | |||
High Post-Harvest Losses in Developing Regions
Up to 30% of harvested pumpkins in Africa and South Asia spoil before reaching markets due to inadequate rural roads, limited access to cold storage facilities, and insufficient availability of fungicides. According to the FAO, reducing such waste by half could lower agricultural greenhouse gas emissions by 4% and decrease food prices by up to 10% in low-income countries[3]Food and Agriculture Organization of the United Nations, “FAOSTAT Commodity Data,” fao.org. Pilot initiatives, such as solar-powered cold rooms and ventilated crates, have reduced losses to single-digit percentages. Additionally, fragmented extension services hinder training on techniques such as rapid drying and mildew prevention. Reducing post-harvest losses is therefore a critical cost-saving measure, but it requires the development of integrated infrastructure and agronomic support.
Seasonality Constraining Year-Round Supply
Temperate growing cycles limit most pumpkin cultivation to late-summer planting and autumn harvesting, requiring processors to store purée and inventory for up to nine months. In the United States, 95% of processing pumpkins are sourced from central Illinois, a 45-mile region susceptible to rainfall fluctuations that can delay planting. Counter-seasonal production in countries like Brazil and South Africa helps address supply gaps. Trials in controlled-environment agriculture show potential but are constrained by significant energy costs. Companies adopting latitude diversification strategies or transitioning to shelf-stable packaging can reduce the capital tied up in storage.
*Our forecasts treat driver/restraint impacts as directional, not additive. The impact forecasts reflect baseline growth, mix effects, and variable interactions.
Geography Analysis
By geography, the Asia-Pacific captured 50.20% of the fresh pumpkin market share in 2025. The Asia-Pacific region dominates the fresh pumpkin market, with China accounting for a significant share of global production and consuming most of its harvest in fresh and dried forms. India and Indonesia have expanded cultivation areas through nutrition-focused subsidy programs. Although inconsistent monsoons and limited irrigation constrain yield potential. In China, advancements in ultrasound protein extraction technology have enhanced localized value addition, reducing raw seed exports.
North America ranks second in value, largely due to a cultural attachment to autumn rituals. Fields in Illinois, located within 45 miles of Morton, produce yields that are 5,000–25,000 pounds higher per acre than the national average, contributing to Libby’s cost advantage. Europe's market remains fragmented. Germany's Styria region holds a protected geographical indication (PGI) status for premium pumpkin seed oil. Additionally, pilot biorefineries in Germany and the Netherlands are converting processing residues into bio-composite films. The European Union's sustainability due diligence directive requires importers to document smallholder traceability, increasing compliance costs while benefiting certified exporters.
Africa, growing at a 3.88% CAGR, is supported by the intensification of Egypt's Nile Delta and seed-export corridors from Malawi. In South Africa, commercial farms are adopting drip irrigation and solar-powered cold rooms to reduce spoilage and meet regional export demand. South America and the Middle East are niche yet strategically significant regions. In the Middle East, Turkey dominates production, catering to domestic culinary needs, while Saudi Arabia is experimenting with greenhouse pumpkin cultivation as part of its food security initiatives, despite water scarcity issues.


Competitive Landscape
The fresh pumpkin remain fragmented. Libby’s, a brand owned by Nestlé, dominates the canned pumpkin market with a significant share. The company sources over 90% of its raw pumpkin within a 45-mile radius of Morton, Illinois. This vertically integrated model enhances logistical efficiency but increases vulnerability to localized climate risks. Seneca Foods operates a smaller cannery in Princeville, Illinois, primarily serving private-label contracts.
The fresh pumpkin supply chain in regions like Africa and South Asia is fragmented, involving numerous small-scale farmers who often lack access to cold storage and collective bargaining mechanisms. As a result, premium retailers in the United States and Europe depend on a limited number of certified growers to meet organic standards. This reliance creates supply bottlenecks and price volatility, particularly during holiday demand peaks.
Strategic opportunities lie in counter-seasonal sourcing from regions such as Brazil and South Africa, enzymatic seed-protein extraction, and licensing bio-plastic feedstock technologies. Chinese patent holders specializing in ultrasound extraction methods and European startups developing residue-to-film technologies are well-positioned to generate royalty income as sustainability regulations become stricter. Producers that integrate farming, processing, and branded sales are better equipped to manage commodity price fluctuations and capture higher margins across the value chain.
Recent Industry Developments
- January 2025: A study published in Food Chemistry demonstrated that ultrasound and pH-shift processing increased pumpkin seed protein solubility to 69.1%, enabling new applications for plant-based proteins.
- November 2024: Investigative reporting revealed that Libby holds an 80% share of the canned pumpkin market and relies on a single production site in Morton, Illinois, emphasizing the climate-related concentration risk associated with this dependency.


Global Fresh Pumpkin Market Report Scope
| North America | United States | Production Analysis (Volume) |
| Consumption Analysis (Value and Volume) | ||
| Import Analysis (Value and Volume) | ||
| Export Analysis (Value and Volume) | ||
| Price Trend Analysis | ||
| Canada | Production Analysis (Volume) | |
| Consumption Analysis (Value and Volume) | ||
| Import Analysis (Value and Volume) | ||
| Export Analysis (Value and Volume) | ||
| Price Trend Analysis | ||
| Mexico | Production Analysis (Volume) | |
| Consumption Analysis (Value and Volume) | ||
| Import Analysis (Value and Volume) | ||
| Export Analysis (Value and Volume) | ||
| Price Trend Analysis | ||
| Europe | Germany | Production Analysis (Volume) |
| Consumption Analysis (Value and Volume) | ||
| Import Analysis (Value and Volume) | ||
| Export Analysis (Value and Volume) | ||
| Price Trend Analysis | ||
| Spain | Production Analysis (Volume) | |
| Consumption Analysis (Value and Volume) | ||
| Import Analysis (Value and Volume) | ||
| Export Analysis (Value and Volume) | ||
| Price Trend Analysis | ||
| Italy | Production Analysis (Volume) | |
| Consumption Analysis (Value and Volume) | ||
| Import Analysis (Value and Volume) | ||
| Export Analysis (Value and Volume) | ||
| Price Trend Analysis | ||
| France | Production Analysis (Volume) | |
| Consumption Analysis (Value and Volume) | ||
| Import Analysis (Value and Volume) | ||
| Export Analysis (Value and Volume) | ||
| Price Trend Analysis | ||
| Russia | Production Analysis (Volume) | |
| Consumption Analysis (Value and Volume) | ||
| Import Analysis (Value and Volume) | ||
| Export Analysis (Value and Volume) | ||
| Price Trend Analysis | ||
| Asia-Pacific | China | Production Analysis (Volume) |
| Consumption Analysis (Value and Volume) | ||
| Import Analysis (Value and Volume) | ||
| Export Analysis (Value and Volume) | ||
| Price Trend Analysis | ||
| India | Production Analysis (Volume) | |
| Consumption Analysis (Value and Volume) | ||
| Import Analysis (Value and Volume) | ||
| Export Analysis (Value and Volume) | ||
| Price Trend Analysis | ||
| Indonesia | Production Analysis (Volume) | |
| Consumption Analysis (Value and Volume) | ||
| Import Analysis (Value and Volume) | ||
| Export Analysis (Value and Volume) | ||
| Price Trend Analysis | ||
| Philippines | Production Analysis (Volume) | |
| Consumption Analysis (Value and Volume) | ||
| Import Analysis (Value and Volume) | ||
| Export Analysis (Value and Volume) | ||
| Price Trend Analysis | ||
| Australia | Production Analysis (Volume) | |
| Consumption Analysis (Value and Volume) | ||
| Import Analysis (Value and Volume) | ||
| Export Analysis (Value and Volume) | ||
| Price Trend Analysis | ||
| South America | Brazil | Production Analysis (Volume) |
| Consumption Analysis (Value and Volume) | ||
| Import Analysis (Value and Volume) | ||
| Export Analysis (Value and Volume) | ||
| Price Trend Analysis | ||
| Argentina | Production Analysis (Volume) | |
| Consumption Analysis (Value and Volume) | ||
| Import Analysis (Value and Volume) | ||
| Export Analysis (Value and Volume) | ||
| Price Trend Analysis | ||
| Peru | Production Analysis (Volume) | |
| Consumption Analysis (Value and Volume) | ||
| Import Analysis (Value and Volume) | ||
| Export Analysis (Value and Volume) | ||
| Price Trend Analysis | ||
| Africa | South Africa | Production Analysis (Volume) |
| Consumption Analysis (Value and Volume) | ||
| Import Analysis (Value and Volume) | ||
| Export Analysis (Value and Volume) | ||
| Price Trend Analysis | ||
| Malawi | Production Analysis (Volume) | |
| Consumption Analysis (Value and Volume) | ||
| Import Analysis (Value and Volume) | ||
| Export Analysis (Value and Volume) | ||
| Price Trend Analysis | ||
| Egypt | Production Analysis (Volume) | |
| Consumption Analysis (Value and Volume) | ||
| Import Analysis (Value and Volume) | ||
| Export Analysis (Value and Volume) | ||
| Price Trend Analysis | ||
| Middle East | Turkey | Production Analysis (Volume) |
| Consumption Analysis (Value and Volume) | ||
| Import Analysis (Value and Volume) | ||
| Export Analysis (Value and Volume) | ||
| Price Trend Analysis | ||
| Saudi Arabia | Production Analysis (Volume) | |
| Consumption Analysis (Value and Volume) | ||
| Import Analysis (Value and Volume) | ||
| Export Analysis (Value and Volume) | ||
| Price Trend Analysis | ||
| By Geography | North America | United States | Production Analysis (Volume) |
| Consumption Analysis (Value and Volume) | |||
| Import Analysis (Value and Volume) | |||
| Export Analysis (Value and Volume) | |||
| Price Trend Analysis | |||
| Canada | Production Analysis (Volume) | ||
| Consumption Analysis (Value and Volume) | |||
| Import Analysis (Value and Volume) | |||
| Export Analysis (Value and Volume) | |||
| Price Trend Analysis | |||
| Mexico | Production Analysis (Volume) | ||
| Consumption Analysis (Value and Volume) | |||
| Import Analysis (Value and Volume) | |||
| Export Analysis (Value and Volume) | |||
| Price Trend Analysis | |||
| Europe | Germany | Production Analysis (Volume) | |
| Consumption Analysis (Value and Volume) | |||
| Import Analysis (Value and Volume) | |||
| Export Analysis (Value and Volume) | |||
| Price Trend Analysis | |||
| Spain | Production Analysis (Volume) | ||
| Consumption Analysis (Value and Volume) | |||
| Import Analysis (Value and Volume) | |||
| Export Analysis (Value and Volume) | |||
| Price Trend Analysis | |||
| Italy | Production Analysis (Volume) | ||
| Consumption Analysis (Value and Volume) | |||
| Import Analysis (Value and Volume) | |||
| Export Analysis (Value and Volume) | |||
| Price Trend Analysis | |||
| France | Production Analysis (Volume) | ||
| Consumption Analysis (Value and Volume) | |||
| Import Analysis (Value and Volume) | |||
| Export Analysis (Value and Volume) | |||
| Price Trend Analysis | |||
| Russia | Production Analysis (Volume) | ||
| Consumption Analysis (Value and Volume) | |||
| Import Analysis (Value and Volume) | |||
| Export Analysis (Value and Volume) | |||
| Price Trend Analysis | |||
| Asia-Pacific | China | Production Analysis (Volume) | |
| Consumption Analysis (Value and Volume) | |||
| Import Analysis (Value and Volume) | |||
| Export Analysis (Value and Volume) | |||
| Price Trend Analysis | |||
| India | Production Analysis (Volume) | ||
| Consumption Analysis (Value and Volume) | |||
| Import Analysis (Value and Volume) | |||
| Export Analysis (Value and Volume) | |||
| Price Trend Analysis | |||
| Indonesia | Production Analysis (Volume) | ||
| Consumption Analysis (Value and Volume) | |||
| Import Analysis (Value and Volume) | |||
| Export Analysis (Value and Volume) | |||
| Price Trend Analysis | |||
| Philippines | Production Analysis (Volume) | ||
| Consumption Analysis (Value and Volume) | |||
| Import Analysis (Value and Volume) | |||
| Export Analysis (Value and Volume) | |||
| Price Trend Analysis | |||
| Australia | Production Analysis (Volume) | ||
| Consumption Analysis (Value and Volume) | |||
| Import Analysis (Value and Volume) | |||
| Export Analysis (Value and Volume) | |||
| Price Trend Analysis | |||
| South America | Brazil | Production Analysis (Volume) | |
| Consumption Analysis (Value and Volume) | |||
| Import Analysis (Value and Volume) | |||
| Export Analysis (Value and Volume) | |||
| Price Trend Analysis | |||
| Argentina | Production Analysis (Volume) | ||
| Consumption Analysis (Value and Volume) | |||
| Import Analysis (Value and Volume) | |||
| Export Analysis (Value and Volume) | |||
| Price Trend Analysis | |||
| Peru | Production Analysis (Volume) | ||
| Consumption Analysis (Value and Volume) | |||
| Import Analysis (Value and Volume) | |||
| Export Analysis (Value and Volume) | |||
| Price Trend Analysis | |||
| Africa | South Africa | Production Analysis (Volume) | |
| Consumption Analysis (Value and Volume) | |||
| Import Analysis (Value and Volume) | |||
| Export Analysis (Value and Volume) | |||
| Price Trend Analysis | |||
| Malawi | Production Analysis (Volume) | ||
| Consumption Analysis (Value and Volume) | |||
| Import Analysis (Value and Volume) | |||
| Export Analysis (Value and Volume) | |||
| Price Trend Analysis | |||
| Egypt | Production Analysis (Volume) | ||
| Consumption Analysis (Value and Volume) | |||
| Import Analysis (Value and Volume) | |||
| Export Analysis (Value and Volume) | |||
| Price Trend Analysis | |||
| Middle East | Turkey | Production Analysis (Volume) | |
| Consumption Analysis (Value and Volume) | |||
| Import Analysis (Value and Volume) | |||
| Export Analysis (Value and Volume) | |||
| Price Trend Analysis | |||
| Saudi Arabia | Production Analysis (Volume) | ||
| Consumption Analysis (Value and Volume) | |||
| Import Analysis (Value and Volume) | |||
| Export Analysis (Value and Volume) | |||
| Price Trend Analysis | |||


Key Questions Answered in the Report
How large is the fresh pumpkin market in 2026?
The fresh pumpkin market size is USD 2.99 billion in 2026 and is on track to reach USD 3.53 billion by 2031.
Which region leads pumpkin consumption?
Asia-Pacific holds 50.20% of worldwide consumption, driven by China’s scale and growing demand for functional foods.
What factors drive year-round demand beyond Halloween?
Growth stems from wellness-oriented seed proteins, purée in bakery reformulations, and pet-food fiber inclusion.
Why is Africa the fastest-growing region?
Smallholder intensification, new cold-chain links in Egypt and South Africa, and emerging seed export corridors propel a 3.88% CAGR.
What technologies raise pumpkin seed-protein yields?
Combined enzymatic and ultrasound extraction can push yields above 40% while maintaining functional quality.
Page last updated on:


