
Gooseberry Market Size and Share
Gooseberry Market Analysis by Mordor Intelligence
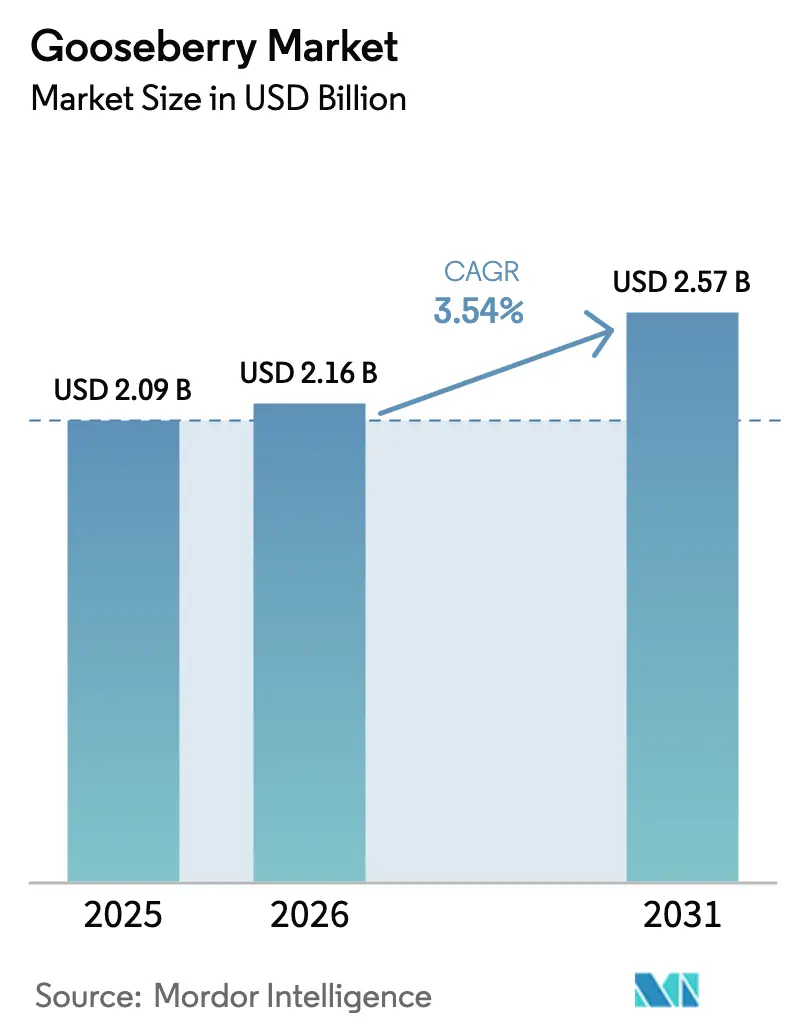
The gooseberry market size is projected to be USD 2.09 billion in 2025, USD 2.16 billion in 2026, and will reach USD 2.57 billion by 2031, reflecting a 3.54% CAGR. Steady topline growth reflects a realignment in the value chain, shifting fruit from niche fresh produce sections to higher-margin nutraceutical and cosmetic formulations. Pharmaceutical formulators and cosmetic ingredient buyers now compete directly with food processors, accelerating investments in freeze-drying, solvent extraction, and blockchain traceability. India anchors supply through contract-farming clusters, while Colombia scales certified organic plantations. E-commerce ingredient portals shorten discovery cycles, and mechanical harvesting pilots signal the next efficiency leap. Climate volatility remains the principal supply risk, but premium buyers have shown willingness to absorb higher costs in exchange for traceable material and strict residue compliance[1]Source: Food Safety and Standards Authority of India, “Revised Pesticide Residue Limits,” fssai.gov.in.
Key Report Takeaways
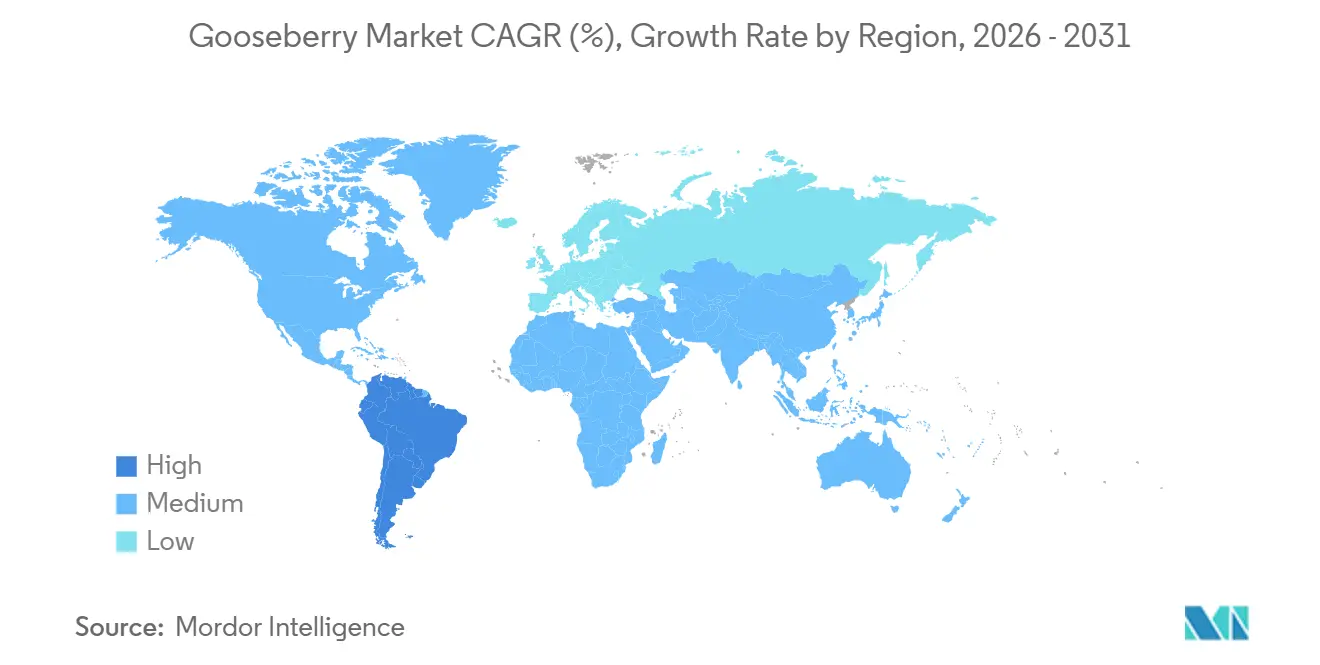
- By geography, Asia-Pacific held 48.2% gooseberry market share in 2025, while South America records the fastest 4.1% CAGR through 2031.
Note: Market size and forecast figures in this report are generated using Mordor Intelligence’s proprietary estimation framework, updated with the latest available data and insights as of January 2026.
Global Gooseberry Market Trends and Insights
Drivers Impact Analysis*
| Driver | (~) % Impact on CAGR Forecast | Geographic Relevance | Impact Timeline |
|---|---|---|---|
| Surge in ayurvedic and nutraceutical demand | +0.9% | Asia-Pacific core, spillover to North America and Europe | Medium term (2-4 years) |
| Cosmetic-grade natural vitamin-C sourcing boom | +0.7% | Global, with concentration in Europe and North America | Medium term (2-4 years) |
| Government export incentives for horticulture | +0.5% | Asia-Pacific (India), South America (Colombia, Brazil), Middle East (Turkey) | Short term (≤ 2 years) |
| Contract farming clusters scaling output | +0.6% | Asia-Pacific (India), South America (Colombia) | Long term (≥ 4 years) |
| E-commerce B2B ingredient marketplaces | +0.4% | Global, with early adoption in North America and Europe | Short term (≤ 2 years) |
| Mechanical harvesting and optical grading | +0.3% | Europe (Spain, Germany), Middle East (Turkey), early pilots in Asia-Pacific | Long term (≥ 4 years) |
| Source: Mordor Intelligence | |||
Surge in Ayurvedic and Nutraceutical Demand
Gooseberry has transitioned from a traditional remedy to a prominent supplement in global nutraceutical markets. Major brands now require extracts with specific tannin content, driving investments in advanced drying and extraction technologies. Regulatory requirements in key export markets mandate stringent identity testing and batch-level traceability, prompting smaller exporters to consolidate or adopt blockchain-based documentation systems[2]Source: Press Information Bureau, “India Ayurvedic Product Exports Reach USD 724 Million,” pib.gov.in. Buyers in the nutraceutical segment are generally less price-sensitive than those in fresh fruit markets, providing growers with financial stability during years of lower harvests. In some regions, cereal acreage is being converted into gooseberry orchards, supported by guaranteed minimum prices for processed amla powder. This shift is transforming agricultural landscapes and reinforcing gooseberries' role in health-oriented product portfolios.
Cosmetic-Grade Natural Vitamin-C Sourcing Boom
The clean-beauty movement is encouraging cosmetic companies in Europe and North America to replace synthetic vitamin C with natural botanical sources. Gooseberry has emerged as a preferred option due to its high ascorbic acid content and superior oxidative stability compared to other fruits. Leading cosmetic brands have increased their reliance on botanical vitamin C, with gooseberry becoming one of their top inputs by volume. Strict residue and microbial standards, along with adherence to international cosmetic regulations, favor plantations with certifications such as organic and GLOBALG.A.P. (Global Good Agricultural Practice). Premium processors in regions like South Asia and South America are securing higher prices for certified gooseberry materials. This trend is establishing gooseberry as a key ingredient in the natural skincare and cosmetics industry.
Government Export Incentives for Horticulture
Governments in various countries are actively promoting gooseberry exports through subsidies and incentive programs. In India, initiatives have been launched to assist exporters in obtaining certifications and upgrading cold-chain infrastructure[3]Source: Agricultural and Processed Food Products Export Development Authority, “Market Access Initiative Guidelines 2025,” apeda.gov.in. In South America, cooperatives have received funding for irrigation systems and pack-house equipment to meet international standards. Turkey has introduced export rebates for fresh and processed gooseberry products targeting European and Gulf markets. These measures reduce financial barriers for mid-tier processors and enhance compliance with pesticide and food safety regulations. Collectively, these incentives are improving competitiveness and expanding the global market presence of gooseberry products.
Contract Farming Clusters Scaling Output
Contract farming models are increasingly being implemented to expand gooseberry production and reduce risks for growers. Large buyers provide seedlings, training, and guaranteed offtake agreements, encouraging farmers to adopt orchard cultivation. In India, major companies have contracted thousands of hectares, staggering harvests across regions to ensure continuous utilization of processing facilities. In Colombia, cooperatives have entered multi-year agreements with smallholders, offering price premiums in exchange for sustainability certifications. These arrangements reduce supply fragmentation and align production with buyer requirements. Consequently, contract farming clusters are emerging as a reliable mechanism for consistent output and quality assurance in the gooseberry market.
Restraints Impact Analysis*
| Restraint | (~) % Impact on CAGR Forecast | Geographic Relevance | Impact Timeline |
|---|---|---|---|
| High production and processing cost | -0.6% | Global, acute in Asia-Pacific and South America | Medium term (2-4 years) |
| Seasonal production constraints | -0.4% | Global, most severe in Asia-Pacific and Europe | Short term (≤ 2 years) |
| High post-harvest perishability | -0.5% | Asia-Pacific, South America, Africa | Medium term (2-4 years) |
| Climate-induced fruit drop volatility | -0.3% | Asia-Pacific (India), South America (Colombia), Europe (Spain) | Long term (≥ 4 years) |
| Source: Mordor Intelligence | |||
High Production and Processing Cost
Gooseberry cultivation and processing face significant cost challenges, limiting competitiveness against synthetic alternatives. Labor constitutes a substantial portion of orchard expenses, while energy-intensive freeze-drying further pressures margins. Rising industrial power rates have increased processing costs, reducing profitability for many operators. Additionally, cold-chain logistics add to distribution expenses, making gooseberry products more costly compared to synthetic inputs. These challenges are particularly pronounced in price-sensitive categories where affordability is a priority. Without efficiency improvements or premium positioning, producers may struggle to remain competitive in broader markets.
Seasonal Production Constraints
Gooseberry production is highly seasonal, with harvests concentrated in short regional windows. While different countries produce at varying times of the year, overall availability is limited to a few months. Buyers often need to finance long-term inventory to ensure year-round supply, which increases the risk of stockouts and higher costs. During shortages, some brands switch to synthetic vitamin C to maintain product continuity. Although controlled atmosphere storage can slightly extend shelf life, it adds costs and does not fully preserve nutrient levels. Seasonal production constraints remain a structural challenge, requiring careful planning and diversification to stabilize supply chains.
*Our forecasts treat driver/restraint impacts as directional, not additive. The impact forecasts reflect baseline growth, mix effects, and variable interactions.
Geography Analysis
The Asia-Pacific holds the largest share, 48.2% in the gooseberry market in 2025, driven by extensive cultivation in India, China, and Southeast Asia. In India, northern and central states are key contributors, with orchards increasingly replacing traditional cereal crops. Regulatory harmonization has enhanced export opportunities, particularly to European markets, spurring investments in processing facilities and cold-chain infrastructure. In China, provinces are reallocating vegetable acreage to gooseberry orchards to meet growing demand for nutraceutical and cosmetic applications. Indonesia, on the other hand, focuses on supplying local fresh-fruit markets, with gooseberries primarily consumed domestically rather than exported. The region benefits from robust agricultural capacity, supportive government initiatives, and increasing consumer awareness, solidifying Asia Pacific's position as the global leader in gooseberry production and trade.
South America is the fastest-growing region in the gooseberry market, with a 4.1% CAGR through 2031, led by Colombia and Brazil. Colombia’s high-altitude regions produce gooseberries with high vitamin C content, which fetch premium prices in international markets. A significant share of production is exported, either fresh or processed, with quick-freezing technologies preserving nutritional value and extending shelf life. In Brazil, southern and southeastern states are expanding cultivation to meet rising domestic demand for functional foods and cosmetic ingredients. The region also benefits from counter-seasonal production, enabling fresh shipments to Europe and North America during their off-season. This seasonal advantage strengthens South America’s position as a reliable supplier, while investments in cooperatives and processing facilities enhance competitiveness and support long-term market growth.
North America and Europe remain net importers of gooseberries, with demand concentrated in supplements, functional beverages, artisanal foods, and cosmetics. Regulatory challenges, such as novel-food authorizations, slow mainstream adoption, but niche markets continue to grow steadily. In the Middle East and Africa, production is smaller but expanding, with Turkey promoting acreage growth through export incentives. Pilot projects in Kenya and trials in South Africa focus on supplying domestic fresh markets, reflecting the early stages of development. Despite these constraints, the regions are gradually building production capacity, supported by consumer interest in natural vitamin C sources and functional nutrition. Collectively, these markets contribute incremental growth, complementing Asia Pacific's dominance and South America's rapid expansion in the global gooseberry industry.


Regulatory Landscape
Gooseberries move through a compliance regime that blends food safety and plant health controls, with import access often determined by pest risk analysis and phytosanitary systems approaches. In the United States, USDA APHIS has historically used Federal Register actions to authorize or assess market access for fresh cape gooseberry from specific origins (for example, Ecuador and Colombia). Requirements have included registered production sites under the origin NPPO, pest monitoring (including fruit fly trapping), inspections, and, in some cases, cold or irradiation treatment as an alternative pathway.
Plant health regulation also shapes nursery and planting material flows in temperate markets. In England and Wales, Ribes production for planting is tied to an APHA-administered certification scheme and plant passport issuance requirements focused on pest prevention and traceability. In Canada, CFIA phytosanitary import requirements for Ribes are origin-dependent, ranging from minimal requirements for select countries to mandatory phytosanitary certification for others. This affects exporter documentation burden and border clearance risk.
Value Chain Analysis
The gooseberry value chain starts with input supply (seedlings or planting material, fertilizers, and crop protection), followed by smallholder-dominant cultivation, aggregation (cooperatives, traders, or contract-farming clusters), and rapid post-harvest handling to manage high perishability. Farm-gate fruit typically goes to packhouses for sorting and specialized packaging, then into fresh channels (often requiring fast chilling and controlled handling within tight seasonal windows) or into processing pathways such as frozen, puree, powder, freeze-dried formats, and solvent-extracted ingredients used by nutraceutical, pharmaceutical, and cosmetic buyers.
Downstream value capture increasingly concentrates at processing and quality assurance nodes, where optical grading, near-infrared nutrient assessment, and batch traceability systems support residue and identity compliance for high-margin applications. International distribution depends on cold-chain logistics providers and re-export hubs in Europe, with the Netherlands functioning as an important logistics and redistribution center for currants and gooseberries trade flows. Bottlenecks remain concentrated in labor-intensive harvesting, cold-chain capacity, and standardization across fragmented grower bases, which is driving investment toward mechanical harvesting pilots and more scalable post-harvest infrastructure.
Competitive Landscape
Gooseberry production is primarily driven by numerous smallholders cultivating small plots, typically ranging from half a hectare to two hectares. These growers often face challenges in scaling their production individually, which has led to the establishment of cooperatives. By pooling resources and capital, cooperatives can invest in shared infrastructure and secure long-term supply agreements with international buyers. This collective approach enables smallholders to access premium markets that require certifications and consistent quality standards. Additionally, cooperatives help stabilize incomes, mitigate risks associated with fragmented production, and ensure growers remain competitive in a market increasingly influenced by advanced processing requirements.
Processing stakeholders include vertically integrated firms and specialized technology providers that are transforming the value chain. Companies are investing in captive freeze-drying facilities, organic certification programs, and blockchain traceability systems to differentiate their products and comply with global standards. Advanced technologies, such as optical grading and near-infrared nutrient assessment, are becoming critical tools, enabling real-time quality control and nutrient profiling. These innovations create barriers to entry, favoring processors with the financial capacity to adopt such technologies, while smaller operators often depend on partnerships or licensing agreements. Technology providers play a key role in enhancing industry standards and improving efficiency across the processing segment.
Regulatory bodies and emerging market stakeholders have a significant impact on the gooseberry industry. Compliance with botanical guidance, cosmetic regulations, and import tolerances requires processors to maintain in-house laboratories and implement robust testing protocols. This regulatory environment benefits established firms but also presents opportunities in regions with underdeveloped infrastructure. For instance, Africa and Southeast Asia offer potential for investment in processing facilities and cold-chain systems. Local governments and development agencies are increasingly supporting these initiatives, aiming to build capacity and integrate smallholders into global supply chains. Stakeholders in these regions represent a key area for future industry expansion.
Market Opportunities and Future Outlook
A key opportunity sits in structured value addition for underutilized and regionally grown gooseberry types, particularly where public-sector programs and local processors can commercialize shelf-stable formats (jams, sauces, juices) that reduce reliance on fragile fresh logistics. In April 2026, Kenya Agricultural and Livestock Research Organisation (KALRO) reported progress in developing local gooseberry value chains and supporting processing, which highlights whitespace for small and mid-sized processors to build branded domestic products and B2B ingredient supply for foodservice and retail.
On the export-oriented side, cape gooseberry trade activity provides a demand signal for investment in compliant packing, cold chain, and certified orchards, especially where counter-seasonal supply is a selling point. Colombian cape gooseberry exports were reported at USD 41.3 million (with references to growth in early 2026), reinforcing the role of organized export channels and quality protocols as a route to higher realizations. Across geographies, opportunities also center on traceable, certified supply (organic, GLOBALG.A.P.-aligned practices) for cosmetic-grade natural vitamin C sourcing, and on processing capacity (freeze-drying and extraction) that converts seasonal fruit into year-round ingredients for supplements and cosmetics.
Recent Industry Developments
- April 2026: Colombian exporters, referenced by industry bodies such as ANALDEX, reported growth in cape gooseberry exports in early 2026, reinforcing momentum behind standardized export programs. This strengthens incentives for investments in certified orchards, post-harvest handling, and cold-chain execution that support consistent export-grade supply.
- January 2026: Odisha exported a 1,050 kg shipment of Indian gooseberries (amla) to Dubai, supported by the Department of Agriculture and Farmers' Empowerment, Government of Odisha, with Villa Mart Pvt. Ltd. involved in the export facilitation. The shipment demonstrated a workable pathway for new grower clusters to access Middle Eastern demand and raises the importance of packhouse readiness and phytosanitary documentation for repeat exports.
- March 2025: Delight Gooseberries in Kenya expanded processed gooseberry offerings such as wine, juice, jam, and sauces and broadened distribution through retail channels including Naivas. The move underscores how local processing can stabilize offtake beyond short harvest windows and create differentiated products that pull demand through the domestic value chain.


Research Methodology Framework and Report Scope
Market Definition and Coverage
For this study, the gooseberry market is defined as the value generated from selling gooseberries and closely related processed forms for human use, counted at the point where the product is first sold into organized trade (fresh and as ingredients for processing).
Scope exclusions: Home garden consumption that is not sold, informal barter trade, and value added from downstream branded foods or supplements beyond the ingredient value are excluded.
Segmentation Overview
- By Geography
- North America
- United States
- Production Analysis (Area Harvested, Yield, and Production Volume)
- Consumption Analysis (Consumption Value and Volume)
- Import Market Analysis (Import Value, Volume, and Key Supplying Markets)
- Export Market Analysis (Export Value, Volume, and Key Destination Markets)
- Wholesale Price Trend Analysis and Forecast
- Regulatory Framework
- List of Key Players
- Logistics and Infrastructure
- Seasonality Analysis
- Canada
- Production Analysis (Area Harvested, Yield, and Production Volume)
- Consumption Analysis (Consumption Value and Volume)
- Import Market Analysis (Import Value, Volume, and Key Supplying Markets)
- Export Market Analysis (Export Value, Volume, and Key Destination Markets)
- Wholesale Price Trend Analysis and Forecast
- Regulatory Framework
- List of Key Players
- Logistics and Infrastructure
- Seasonality Analysis
- United States
- Europe
- Germany
- Production Analysis (Area Harvested, Yield, and Production Volume)
- Consumption Analysis (Consumption Value and Volume)
- Import Market Analysis (Import Value, Volume, and Key Supplying Markets)
- Export Market Analysis (Export Value, Volume, and Key Destination Markets)
- Wholesale Price Trend Analysis and Forecast
- Regulatory Framework
- List of Key Players
- Logistics and Infrastructure
- Seasonality Analysis
- Spain
- Production Analysis (Area Harvested, Yield, and Production Volume)
- Consumption Analysis (Consumption Value and Volume)
- Import Market Analysis (Import Value, Volume, and Key Supplying Markets)
- Export Market Analysis (Export Value, Volume, and Key Destination Markets)
- Wholesale Price Trend Analysis and Forecast
- Regulatory Framework
- List of Key Players
- Logistics and Infrastructure
- Seasonality Analysis
- United Kingdom
- Production Analysis (Area Harvested, Yield, and Production Volume)
- Consumption Analysis (Consumption Value and Volume)
- Import Market Analysis (Import Value, Volume, and Key Supplying Markets)
- Export Market Analysis (Export Value, Volume, and Key Destination Markets)
- Wholesale Price Trend Analysis and Forecast
- Regulatory Framework
- List of Key Players
- Logistics and Infrastructure
- Seasonality Analysis
- Germany
- Asia-Pacific
- China
- Production Analysis (Area Harvested, Yield, and Production Volume)
- Consumption Analysis (Consumption Value and Volume)
- Import Market Analysis (Import Value, Volume, and Key Supplying Markets)
- Export Market Analysis (Export Value, Volume, and Key Destination Markets)
- Wholesale Price Trend Analysis and Forecast
- Regulatory Framework
- List of Key Players
- Logistics and Infrastructure
- Seasonality Analysis
- India
- Production Analysis (Area Harvested, Yield, and Production Volume)
- Consumption Analysis (Consumption Value and Volume)
- Import Market Analysis (Import Value, Volume, and Key Supplying Markets)
- Export Market Analysis (Export Value, Volume, and Key Destination Markets)
- Wholesale Price Trend Analysis and Forecast
- Regulatory Framework
- List of Key Players
- Logistics and Infrastructure
- Seasonality Analysis
- Indonesia
- Production Analysis (Area Harvested, Yield, and Production Volume)
- Consumption Analysis (Consumption Value and Volume)
- Import Market Analysis (Import Value, Volume, and Key Supplying Markets)
- Export Market Analysis (Export Value, Volume, and Key Destination Markets)
- Wholesale Price Trend Analysis and Forecast
- Regulatory Framework
- List of Key Players
- Logistics and Infrastructure
- Seasonality Analysis
- China
- South America
- Brazil
- Production Analysis (Area Harvested, Yield, and Production Volume)
- Consumption Analysis (Consumption Value and Volume)
- Import Market Analysis (Import Value, Volume, and Key Supplying Markets)
- Export Market Analysis (Export Value, Volume, and Key Destination Markets)
- Wholesale Price Trend Analysis and Forecast
- Regulatory Framework
- List of Key Players
- Logistics and Infrastructure
- Seasonality Analysis
- Colombia
- Production Analysis (Area Harvested, Yield, and Production Volume)
- Consumption Analysis (Consumption Value and Volume)
- Import Market Analysis (Import Value, Volume, and Key Supplying Markets)
- Export Market Analysis (Export Value, Volume, and Key Destination Markets)
- Wholesale Price Trend Analysis and Forecast
- Regulatory Framework
- List of Key Players
- Logistics and Infrastructure
- Seasonality Analysis
- Brazil
- Middle East
- Turkey
- Production Analysis (Area Harvested, Yield, and Production Volume)
- Consumption Analysis (Consumption Value and Volume)
- Import Market Analysis (Import Value, Volume, and Key Supplying Markets)
- Export Market Analysis (Export Value, Volume, and Key Destination Markets)
- Wholesale Price Trend Analysis and Forecast
- Regulatory Framework
- List of Key Players
- Logistics and Infrastructure
- Seasonality Analysis
- Turkey
- Africa
- Kenya
- Production Analysis (Area Harvested, Yield, and Production Volume)
- Consumption Analysis (Consumption Value and Volume)
- Import Market Analysis (Import Value, Volume, and Key Supplying Markets)
- Export Market Analysis (Export Value, Volume, and Key Destination Markets)
- Wholesale Price Trend Analysis and Forecast
- Regulatory Framework
- List of Key Players
- Logistics and Infrastructure
- Seasonality Analysis
- South Africa
- Production Analysis (Area Harvested, Yield, and Production Volume)
- Consumption Analysis (Consumption Value and Volume)
- Import Market Analysis (Import Value, Volume, and Key Supplying Markets)
- Export Market Analysis (Export Value, Volume, and Key Destination Markets)
- Wholesale Price Trend Analysis and Forecast
- Regulatory Framework
- List of Key Players
- Logistics and Infrastructure
- Seasonality Analysis
- Kenya
- North America
Data Sources, Market Sizing, and Validation
Desk Research
Desk work starts with building the supply and demand picture using public agriculture and trade statistics, then checking whether the story matches price and consumption signals. Sources used include FAOSTAT for crop output trends, UN Comtrade for import export flows, national agriculture ministries for area and yield updates, and customs or horticulture boards where available.
We also review company filings, investor presentations, and reputable press to understand processing capacity moves and buyer requirements for fruit quality. Patent databases and peer reviewed journals are used selectively to track adoption of extraction, drying, and residue testing methods that can influence the usable supply pool. A few paid subscriptions are referenced only for company financials and intelligence, import export shipment level cuts, and patent lookups when public series are missing or delayed. These desk sources are illustrative, and many other references are used for data collection, validation, and research clarification.
Primary Interviews and Surveys
Primary interviews and surveys are used to confirm what desk sources cannot show clearly, including pack out losses, grade mix, and how much fruit is diverted into processing versus sold fresh. We speak with growers, aggregators, processors, exporters, and large buyers, and we balance views across major producing and consuming regions so the final assumptions reflect trading behavior and seasonal constraints.
Distribution of primary research fieldwork respondents
| Company type | Respondent position | Region |
|---|---|---|
| Top tier: 38% | CXOs: 12% | APAC: 49% |
| Mid tier: 41% | Functional/Unit leaders: 30% | EMEA: 29% |
| Smaller Players: 21% | Managers: 58% | Americas: 22% |
Market-Sizing & Forecasting
Sizing begins with a top-down build that reconstructs the value pool from production, trade, and wholesale price signals, then converts volumes into value using country level price ladders. Since gooseberries can move between fresh retail and processing intake, we apply allocation factors for fresh sales versus processing intake, which are refined through interviews and seasonal supply checks.
To keep the model practical, we use a small set of repeatable inputs such as harvested area and yield trends, import export volumes, wholesale price movements, processing penetration, and loss rates from farm gate to marketable grade. Where local data series are patchy, gaps are handled with proxy indicators from similar horticulture categories and with conservative interpolation, which is then tested in validation calls.
Forecasts are built using scenario analysis supported by light multivariate regression, where the key drivers are expected yield improvement, trade openness, price normalization after supply shocks, and demand pull from processing uses. Bottom-up approximations are used as a cross-check, such as rolling up sampled buyer volumes times typical contract prices, and channel checks with exporters, before the totals are adjusted and finalized.
Data Validation & Update Cycle
Outputs are checked in several steps so that big jumps are not accepted without a clear reason. We compare the modeled market value against independent signals like production changes, net trade direction, and wholesale price ranges, then we re-check outliers by country and by year until the variance is understood.
Before sign-off, the work is reviewed internally, followed by targeted re-contact with participants when new trade rules, weather events, or processing capacity changes could shift the numbers. Reports are refreshed annually, and material events trigger interim updates, then a final pre-delivery review is completed so clients receive the most current view available at release time.
Mordor Intelligence's Gooseberry Market Size Compared Against Other Published Estimates
Published market sizes for gooseberries can vary a lot, even when the topic name looks identical, because the counted products and the pricing points are not always the same. Differences also show up when one model leans more on production and trade math, while another is built around end use revenues or a narrower product list.
Key gap drivers in this market usually come from scope choices such as counting only fresh fruit versus adding extracts and packaged derivatives, and from how prices are treated across seasons and grades. Currency conversion timing, the handling of informal supply, and how often assumptions are refreshed can also shift the stated USD number for the same year.
By checking production and trade balances and refreshing wholesale price ladders, Mordor Intelligence keeps the 2025 value anchored to sellable volumes rather than downstream branded product revenues.
Benchmark comparison
| Source | Market Size | Gaps in Research Methodology |
|---|---|---|
| Mordor Intelligence | USD 2.09 B (2025) | |
| Global Research Publisher A | USD 1.80 B (2024) | Uses a different base year and explicitly folds in multiple processed forms and extracts, which shifts the value point from raw fruit trade into broader application driven revenues, making year to year comparison less direct. |
| Industry Research Publisher B | USD 0.79 B (2024) | Appears to use a narrower product and pricing boundary that may emphasize selected product types and channels, and it can undercount traded volumes when informal and cross border flows are not fully captured in the demand pool. |
Overall, the spread is largely explained by what is included, where pricing is taken in the chain, and which year is treated as the reference. Our approach stays traceable because the totals can be walked back to volumes, trade direction, and price ladders that are visible and can be re-checked during updates.


Key Questions Answered in the Report
How large is the global gooseberry market projected to be by 2031?
The gooseberry market size is projected to reach USD 2.57 billion by 2031, advancing at a CAGR of 3.54% between 2026 and 2031.
Which region holds the largest gooseberry market share?
Asia Pacific leads the market, accounting for 48.2%, supported by extensive cultivation in India and expanding orchard acreage in China.
Which region is growing fastest in the gooseberry market?
South America records the fastest growth, advancing at a 4.1% CAGR through 2031, driven by Colombia’s organic plantations and Brazil’s functional food demand.
What technology trends are reshaping gooseberry processing?
Freeze-drying, solvent extraction, blockchain traceability, and optical nutrient grading are transforming efficiency and quality assurance, while mechanical harvesting pilots address labor shortages.
Page last updated on:


 Your data is secure and never sold or shared.


