Food Service Market Size and Share
Market Overview
| Study Period | 2020 - 2030 |
|---|---|
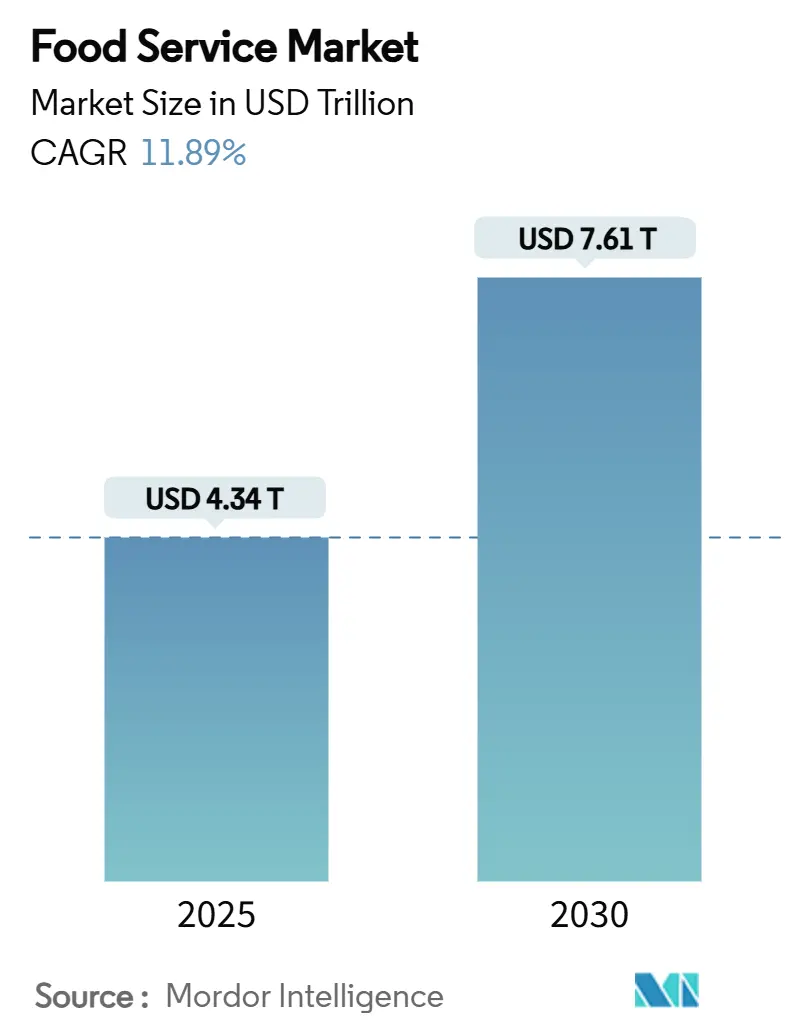
| Market Size (2025) | USD 4.34 Trillion |
| Market Size (2030) | USD 7.61 Trillion |
| Growth Rate (2025 - 2030) | 11.89% CAGR |
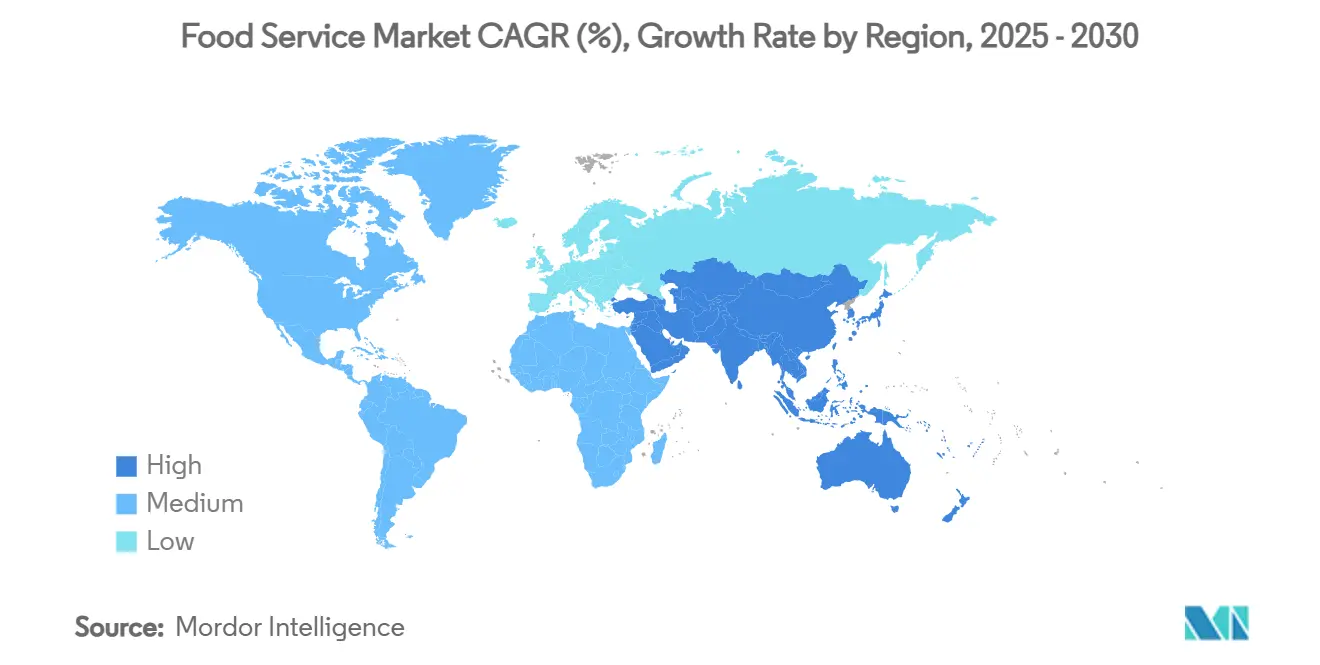
| Fastest Growing Market | Middle East |
| Largest Market | Asia Pacific |
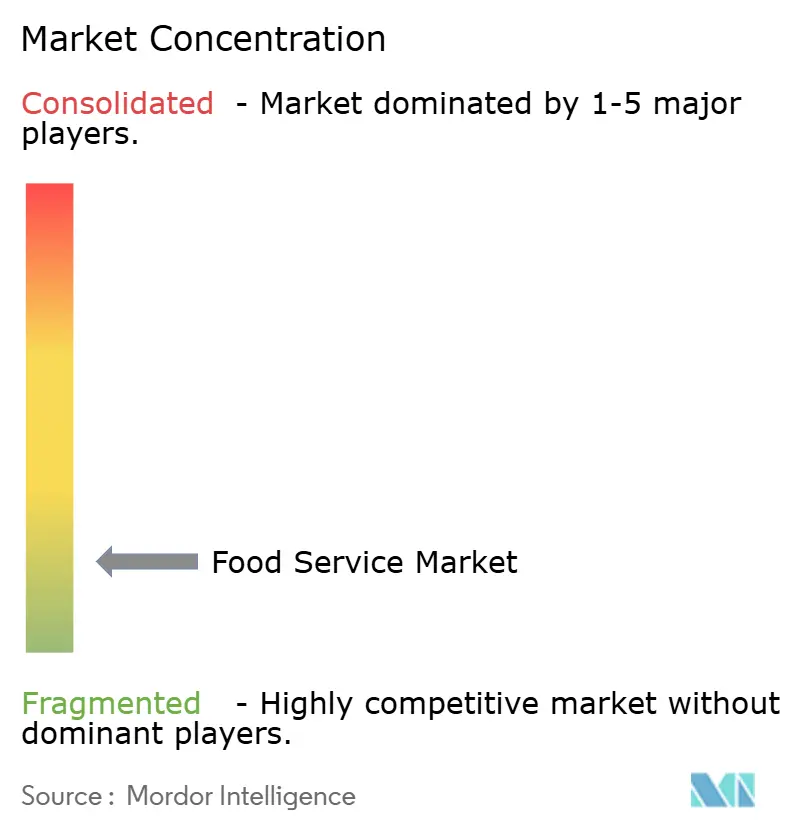
| Market Concentration | Low |
Major Players
*Disclaimer: Major Players sorted in no particular order Image © Mordor Intelligence. Reuse requires attribution under CC BY 4.0. |
|
Food Service Market Analysis by Mordor Intelligence
The global foodservice market size is estimated to be USD 4.34 trillion in 2025 and is forecast to touch USD 7.61 trillion by 2030, advancing at an 11.89% CAGR during the period (2025-2030). The growth in consumer demand for convenience and on-the-go meals increases the market share of food service, delivery applications, and takeaway operations. Also, the restaurant industry's employment growth of 200,000 positions in 2024 demonstrates market recovery in the food service segment. The Asia-Pacific market expansion continues through urbanization and government food-security programs, while Middle Eastern markets, specifically Saudi Arabia and the United Arab Emirates, grow through Vision 2030 capital investments. Additionally, digital integration becomes a core business function, with artificial intelligence drive-thru operations and autonomous delivery systems restructuring operational frameworks. Market analysis indicates increased consumer focus on value offerings, requiring operators to implement commodity risk management and supply chain optimization. Independent operators maintain market dominance in physical locations, while chain establishments utilize economies of scale to accelerate technology implementation and market expansion.
Key Report Takeaways
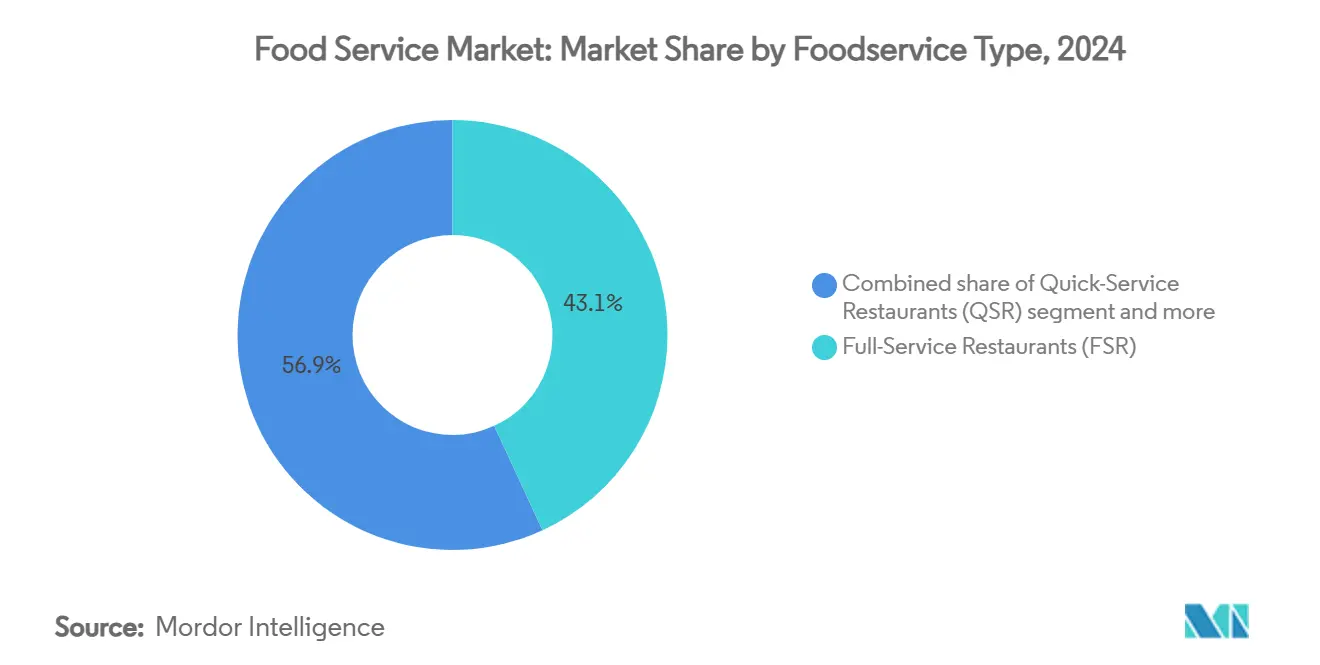
- By foodservice type, full-service restaurants led with 43.13% revenue share in 2024, whereas cloud kitchens are projected to expand at an 18.17% CAGR through 2030.
- By service model, dine-in accounted for 55.17% of the food service market size in 2024, while delivery is advancing at a 14.85% CAGR to 2030.
- By outlet, independent operators captured 71.48% of the food service market share in 2024, yet chained formats are growing at 12.35% CAGR on platform consolidation.
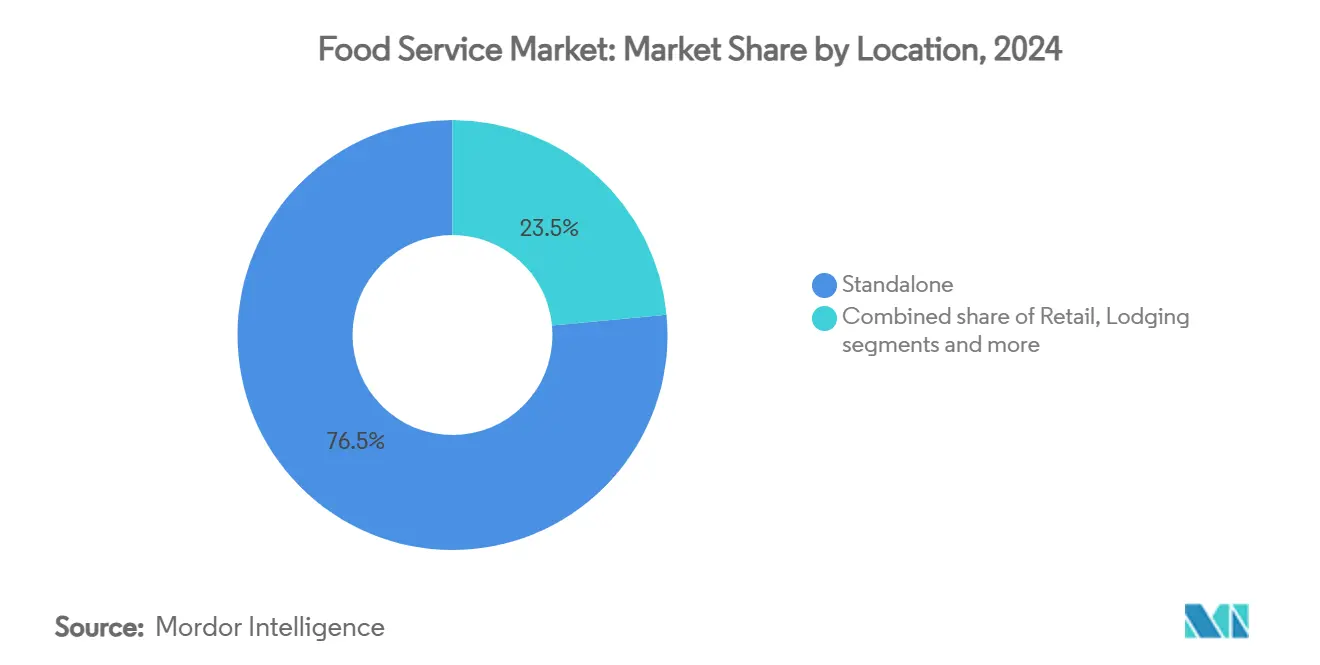
- By location, standalone sites retained a 76.51% share of spending in 2024; lodging venues are expected to post a 12.78% CAGR as travel recovers.
- By geography, Asia-Pacific held 43.81% of 2024 revenue; the Middle East is set to log the fastest 14.94% CAGR to 2030.
Note: Market size and forecast figures in this report are generated using Mordor Intelligence’s proprietary estimation framework, updated with the latest available data and insights as of January 2026.
Global Food Service Market Trends and Insights
Drivers Impact Analysis*
| Driver | (~) % Impact on CAGR Forecast | Geographic Relevance | Impact Timeline |
|---|---|---|---|
| Rising demand for convenience | +2.8% | Global, with urban concentration in North America, Europe, Asia-Pacific | Medium term (2-4 years) |
| Surge in health and wellness trends | +2.1% | North America and European Union leading, expanding to Asia-Pacific | Long term (≥ 4 years) |
| Rapid QSR footprint expansion in emerging Asia-Pacific and GCC | +3.2% | Asia-Pacific core, GCC expansion, spill-over to Africa | Short term (≤ 2 years) |
| Surge in digital ordering, delivery and "omni-channel" service | +2.9% | Global, with early gains in developed markets | Medium term (2-4 years) |
| Culinary globalization | +1.7% | Global, with fusion trends in metropolitan areas | Long term (≥ 4 years) |
| Growth of contract-fed micro-canteens inside logistics hubs | +1.4% | North America, Europe, Asia-Pacific industrial zones | Medium term (2-4 years) |
| Source: Mordor Intelligence | |||
Rising Demand for Convenience
The global food service market continues to expand as consumers increasingly prioritize convenient and on-the-go food options. People's busy schedules, city living, and modern work environments have created a need for easily accessible meals that fit into their daily lives. Companies have responded by enhancing their service offerings, with businesses like Panera Bread establishing widespread curbside pickup locations to serve their customers better. Restaurants like Sweetgreen and Chipotle have successfully adapted by offering quick, personalized meals with fresh ingredients, meeting the needs of health-conscious customers, particularly younger generations. Moreover, food delivery services saw remarkable growth in 2024 and 2025, as customers embraced the simplicity of ordering meals from home or work. Restaurants have invested in customer-friendly technology, such as easy-to-use mobile apps and smart ordering systems, to improve service quality and efficiency. For instance, in 2024, Chick-fil-A enhanced its customer service by dedicating specific staff members to curbside and delivery operations, while implementing mobile updates to keep customers informed. Restaurants that focus on providing convenient, adaptable, and technology-supported services continue to thrive in the food service market.
Surge in Health and Wellness Trends
The global food service market is undergoing substantial transformation due to rising consumer demand for health and wellness options, with customers requiring nutritious alternatives and ingredient transparency. Food service businesses are modifying their menus through the integration of plant-based proteins, reduced-sugar items, and nutrient-dense ingredients. For instance, in November 2024, Starbucks eliminated additional charges for non-dairy milk alternatives, enhancing market accessibility for customers requiring dairy substitutes. Similarly, McDonald's expanded its product portfolio in May 2025 by implementing McPlant products with Beyond Meat in Germany and France. Moreover, the market transformation encompasses supply chain modifications, with businesses prioritizing organic, local, and minimally processed ingredients. Besides, companies implementing these operational changes are capturing new market segments while reinforcing their market position and maintaining regulatory compliance. Food service operators offering health-oriented menu items are positioned to maintain market growth and increase customer retention rates.
Rapid QSR Footprint Expansion in Emerging Asia-Pacific and GCC
The quick-service restaurant (QSR) sector demonstrates growth in the Asia-Pacific and GCC markets, attributed to demographic changes, urbanization trends, and regulatory frameworks. In Saudi Arabia, Vision 2030 policies facilitate economic diversification and employment generation, enabling market expansion for domestic and international QSR operators. Besides, the Asia-Pacific region maintains market leadership in the global QSR segment for 2024, influenced by urbanization metrics, digital transformation in ordering systems, and regional menu adaptation by established operators, including McDonald's, KFC, and Domino's. Moreover, infrastructure investments, exemplified by IFFCO Group's manufacturing capacity expansion in Saudi Arabia (March 2025), enhance operational efficiency and market penetration across the GCC. Similarly, according to the Asian Development Bank's 2025 Economic Integration Report, Asian economies represent 52% of regional FDI, establishing a framework for QSR market development through corporate partnerships and technological implementation [1]Source: Asian Development Bank, "Asian Economic Integration Report 2025", adb.org.
Surge in Digital Ordering, Delivery and "Omni-Channel" Service
Digital ordering, delivery, and integrated service channels are transforming the global food service market, establishing customer experience optimization as a primary objective. Restaurants are implementing artificial intelligence and automation systems to enhance operational efficiency, order accuracy, and service customization. For instance, Wendy's deployment of AI-powered drive-thru systems in May 2025 demonstrated 85-95% order accuracy, indicating significant improvements in customer interaction and operational performance. Similarly, IHOP implemented AI-driven digital platforms in 2023, facilitating customized recommendations and integrated ordering capabilities across web, mobile, and third-party platforms. This integrated channel strategy enables customers to engage with brands through multiple touchpoints - on-premise dining, takeaway, or delivery services. Besides, food service operators are implementing these technological solutions to address consumer requirements, generating improved customer satisfaction metrics, revenue growth, and increased customer retention rates.
Restraints Impact Analysis*
| Restraint | (~) % Impact on CAGR Forecast | Geographic Relevance | Impact Timeline |
|---|---|---|---|
| Food-commodity price volatility and shrink-flation risk | -1.8% | Global, with acute impact in import-dependent regions | Short term (≤ 2 years) |
| Stringent regulatory compliance | -1.2% | Global, with varying intensity by jurisdiction | Long term (≥ 4 years) |
| Global labour shortages and mandated wage hikes | -2.1% | North America, Europe, developed Asia-Pacific markets | Medium term (2-4 years) |
| High operational costs | -1.6% | Global, with urban concentration | Medium term (2-4 years) |
| Source: Mordor Intelligence | |||
Food-Commodity Price Volatility and Shrink-Flation Risk
Food commodity price volatility continues to impact the global food service market's performance. Extreme weather conditions, geopolitical tensions, and supply chain disruptions result in fluctuating input costs. In 2025, commodity prices demonstrated significant increases - cocoa by 163%, coffee by 103%, and sunflower oil by 56%. These increases stemmed from reduced crop yields, climate events, and regional conflicts in key production regions. The volatility impacts operating margins, requiring businesses to implement menu modifications, supplier contract revisions, or cost adjustments. This frequently results in portion size reductions instead of price increases. The U.S. market recorded substantial increases in egg and beef prices due to avian flu outbreaks and supply chain constraints, impacting breakfast-oriented restaurants and quick-service operations. Food service operations must maintain adaptable business strategies to manage procurement and menu offerings while optimizing profitability and customer retention. Given the persistent risks from tariffs, trade disputes, and climate-related incidents, price fluctuations and portion adjustments will continue to impact market operations through 2025.
Stringent Regulatory Compliance
The global food service market faces increasing regulatory requirements, with 2025 introducing stricter food safety, labeling, and traceability standards. Food businesses are implementing advanced traceability systems, including blockchain technology, to monitor ingredient sources and supply chain movements for effective recall management and contamination prevention. Also, updated allergen labeling requirements now mandate clear identification of substances like sesame, which the United States recently classified as a major allergen. The industry must also comply with enhanced temperature control and sanitation protocols to reduce foodborne illness risks. The regulatory environment is complicated by varying federal, state, and local regulations, including state-specific bans on food additives and dyes, along with mandatory digital inspection records. Moreover, companies must maintain continuous staff training, regular certification updates, and detailed documentation to avoid penalties, reputation damage, or operational shutdown. For companies operating internationally, managing different regulatory standards across countries creates additional operational and legal challenges, requiring strategic compliance planning.
*Our forecasts treat driver/restraint impacts as directional, not additive. The impact forecasts reflect baseline growth, mix effects, and variable interactions.
Segment Analysis
By Foodservice Type: Cloud Kitchens Drive Digital Revolution
Full-service restaurants (FSRs) represent 43.13% of the food service market revenue in 2024, as customers continue to value dining experiences. These restaurants sustain their margins through premium pricing, personalized service, and wine selections, even as delivery becomes more popular. FSRs invest in creating welcoming environments and distinctive menus to build customer loyalty. Whereas, cloud kitchens market are growing at 18.17% annually through 2030, operating efficiently without dining rooms. These businesses run several restaurant brands from one kitchen, making the most of their equipment and testing new menu items. Qatar's introduction of Cloud Kitchen Regulation in 2025 set clear guidelines for food safety and labeling, helping businesses plan with confidence. This regulatory framework helps new companies use customer data to predict orders and design efficient delivery systems, helping them gain market share.
Moreover, FSRs are creating delivery-only brands that work with food delivery apps during quiet periods to keep their kitchens busy and protect their customer base. Cafés and bars continue to grow by offering specialty drinks in welcoming social spaces, but they grow more slowly than cloud kitchens because they need more staff. Quick-service restaurants use their franchise structure and consistent menus to grow, especially in the Asian and Gulf regions. Contract catering companies now offer small food service locations in industrial areas to serve workers, showing how food service is moving beyond traditional restaurants. These different business approaches give customers more choices and encourage people to eat out more often.


By Service Model: Delivery Acceleration Reshapes Operations
Restaurants continue to see most customers choosing to dine in, accounting for 55.17% of total spending in 2024, as people seek social dining experiences. Many restaurants have upgraded their facilities with better sound control and air monitoring systems to make guests feel more comfortable and secure. Food delivery is growing rapidly at 14.85% annually, as more customers use their phones to order and restaurants connect with delivery services. Besides, restaurants are carefully designing their menus with special attention to packaging to ensure food stays at the right temperature and arrives in good condition. While working with delivery platforms helps restaurants reach more customers, the high fees have led many restaurants to create their delivery apps to increase profits and better understand their customers. To meet customer expectations, restaurants now need to manage both their in-store sales systems and delivery operations effectively.
Take-away and drive-thru options offer a practical solution between dining in and delivery, with simpler technology requirements than full delivery services. For example, Chipotle has successfully added pickup windows to its restaurants without needing larger dining areas. In busy city areas, restaurants now offer curbside pickup spots and pickup lockers to help customers save on delivery costs. By offering these different ways to serve customers, restaurants can better handle economic changes compared to businesses that only sell through one channel.
By Location: Lodging Segment Captures Travel Recovery
Standalone restaurants continue to lead the market with a 76.51% share in 2024. These businesses succeed by choosing high-traffic locations, providing easy access for customers, and maintaining the flexibility to serve different customer groups effectively. Hotels and lodging businesses are growing the fastest at 12.78% CAGR as more people return to travel, seeking places that offer both comfortable stays and quality dining options. Standalone restaurants maintain their strong position by choosing the right locations, providing sufficient parking, and making quick business decisions to meet customer needs. These restaurants often become local landmarks that help build customer trust and repeat business.
Restaurants in retail centers, entertainment venues, and travel hubs serve specific customer groups with tailored dining options. The growth in hotel restaurants shows how the hospitality industry has recovered after COVID-19, with food services becoming a key source of income for hotels. Moreover, entertainment venues benefit when customers stay longer and spend more per visit. Restaurants in airports and transport stations can charge premium prices due to limited competition, though they must work within strict security rules and small spaces that affect how they serve customers.
By Outlet: Chained Operations Gain Standardization Advantage
Independent restaurants and small business owners maintain their position as market leaders in the global food service industry, representing 71.48% of the market share in 2024. These businesses excel through established community relationships, personalized customer service, and rapid response to evolving local preferences. Independent operators consistently develop new market offerings, including plant-based menu items, local ingredient sourcing programs, and innovative cuisine combinations, which larger restaurant groups subsequently implement. Their investment in distinctive dining experiences and location-specific operations generates sustained customer retention. Despite increased competition from established chains and digital food platforms, these businesses continue to ensure market diversification and resilience.
Restaurant chains are growing rapidly at 12.35% CAGR by investing in better systems, technology, and marketing strategies. Their size allows them to negotiate better prices with suppliers and implement customer-friendly technologies across multiple locations. Recent business moves show this trend - in 2024, Roark Capital bought Subway and its 37,000 restaurants worldwide, while investment firm Blackstone partnered with Jersey Mike's to help the sandwich chain open more locations and improve its customer service through new technology.
Geography Analysis
Asia-Pacific controls a 43.81% market share in 2024, benefiting from its young population, rapid urban development, and strong government support for food security and economic growth. The region's success comes from its expanding consumer base, rising household incomes, and business-friendly regulations that attract foodservice investments. The Middle East shows remarkable progress with a 14.94% growth rate, backed by Vision 2030 programs, new infrastructure projects, and its strategic role in global trade. The United Arab Emirates's food security plan for 2051 seeks to make the country a top 10 global leader, opening new opportunities for foodservice businesses.
North America and Europe continue to deliver reliable growth in their established markets, backed by well-developed systems, wealthy consumers, and sophisticated dining preferences. The United States remains a key player in food production and trade, with agricultural exports increased by USD 1.8 billion in 2024, showing a 1% improvement from the previous year [2]Source: U.S. Department of Agriculture, "U.S. Agricultural Import Values Outpaced Export Values Again in 2024", ers.usda.gov. South America offers new business prospects through its growing cities and economic progress, though businesses must navigate infrastructure gaps and complex regulations.
Moreover, the African food service market demonstrates strong growth as businesses adapt to serve an increasingly urban, tech-savvy population. Quick-service restaurants (QSRs) maintain a strong presence in metropolitan areas, while traditional restaurants and cloud kitchens respond to customers seeking both convenience and culinary variety. Local entrepreneurs and multinational companies operate side by side in this market, leveraging widespread mobile adoption to connect with customers through digital ordering platforms. Although businesses face operational challenges from limited infrastructure and unstable ingredient costs, companies continue to succeed by understanding local preferences and implementing practical solutions.
Mordor Intelligence provides coverage of the food service market across other key regional markets. Detailed country-level analysis extends to South Africa and Netherlands incorporating local coverage and market participation, as required.

Competitive Landscape
The global food service market remains highly fragmented. McDonald's maintains market leadership with 43,000 restaurants and USD 25.9 billion in 2024 revenue [3]Source: McDonald's Corporation, "McDonald's Form 10-K 2024", mcdonalds.com. Starbucks operates in 87 markets, with North America accounting for 75% of sales, while adapting beverage portfolios to regional preferences globally. The industry undergoes technological advancement as companies invest in AI-enabled drive-thru systems, computer-vision kitchen monitoring, and predictive procurement platforms for multi-unit operations.
Private equity firms pursue consolidation opportunities, selecting brands with proven unit economics and digital integration. Key 2024 transactions include Roark Capital's acquisition of Subway and Blackstone's investment in Jersey Mike's, demonstrating demand for the sandwich and quick-service restaurant segments. Cloud kitchen operators utilize operational efficiencies to launch multiple cuisine offerings without physical restaurant infrastructure. Plant-based manufacturers form partnerships with contract producers to increase production volume and certifications, influencing traditional restaurants to expand vegan menu options.
Moreover, major restaurant companies implement competitive pricing strategies, menu development initiatives, digital ordering systems, and service optimization to increase customer retention in the expanding food delivery market. Strategic agreements with delivery providers like Uber Eats and DoorDash, combined with in-house mobile applications, facilitate market expansion. Cloud kitchens and virtual restaurants continue to disrupt conventional dining operations, enhancing market competition and reducing operational expenses. Companies implement sustainable operations and health-conscious menu selections to address evolving consumer requirements.
Food Service Industry Leaders
-
McDonald's Corporation
-
Starbucks Corporation
-
Yum! Brands, Inc.
-
Restaurant Brands International Inc.
-
Domino's Pizza, Inc.
- *Disclaimer: Major Players sorted in no particular order

Recent Industry Developments
- June 2025: McDonald's launched a miniature Happy Meal toy collection targeting young consumers and collectors. The Lil McDonald's Happy Meal collection, introduced on July 1, featured 21 toys representing restaurant items, including miniature french fries, Happy Meal boxes, Boo Buckets, and checkout kiosks.
- May 2025: Starbucks implemented a new version of its flagship takeaway white cup in Europe. The company substituted the cup's plastic lining and plastic lids with mineral-based coating and fiber alternatives, enabling the cup to be both home compostable and recyclable.
- March 2025: Domino's Pizza Inc. launched Parmesan Stuffed Crust across its United States stores. The product featured buttery-flavored dough stuffed with mozzarella cheese, complemented with garlic seasoning and Parmesan.
- March 2025: Café Coffee Day established Coffee Day Square, its premium café concept, on Carter Road in Bandra, Mumbai, India. The outlet introduced a curated menu of specialty coffees alongside Indian, international, and fusion dishes to address local market demand.


Global Food Service Market Report Scope
| Cafés and Bars |
| Cloud Kitchens |
| Full-Service Restaurants (FSR) |
| Quick-Service Restaurants (QSR) |
| Dine-in | |
| Take-away/Drive-thru | |
| Delivery | Food Aggregators |
| Company Owned Platforms/App |
| Chained Outlets |
| Independent Outlets |
| Standalone |
| Leisure |
| Retail |
| Lodging |
| Travel |
| North America | United States |
| Canada | |
| Mexico | |
| Rest of North America | |
| Europe | Germany |
| United Kingdom | |
| Italy | |
| France | |
| Spain | |
| Netherlands | |
| Poland | |
| Belgium | |
| Sweden | |
| Rest of Europe | |
| Asia-Pacific | China |
| India | |
| Japan | |
| Australia | |
| Indonesia | |
| South Korea | |
| Thailand | |
| Singapore | |
| Rest of Asia-Pacific | |
| South America | Brazil |
| Argentina | |
| Colombia | |
| Chile | |
| Peru | |
| Rest of South America | |
| Middle East | United Arab Emirates |
| Saudi Arabia | |
| Qatar | |
| Kuwait | |
| Bahrain | |
| Oman | |
| Rest of Middle East | |
| Africa | Egypt |
| South Africa | |
| Algeria | |
| Nigeria | |
| Morocco | |
| Kenya | |
| Rest of Africa |
| By Foodservice Type | Cafés and Bars | |
| Cloud Kitchens | ||
| Full-Service Restaurants (FSR) | ||
| Quick-Service Restaurants (QSR) | ||
| By Service Model | Dine-in | |
| Take-away/Drive-thru | ||
| Delivery | Food Aggregators | |
| Company Owned Platforms/App | ||
| By Outlet | Chained Outlets | |
| Independent Outlets | ||
| By Location | Standalone | |
| Leisure | ||
| Retail | ||
| Lodging | ||
| Travel | ||
| By Geography | North America | United States |
| Canada | ||
| Mexico | ||
| Rest of North America | ||
| Europe | Germany | |
| United Kingdom | ||
| Italy | ||
| France | ||
| Spain | ||
| Netherlands | ||
| Poland | ||
| Belgium | ||
| Sweden | ||
| Rest of Europe | ||
| Asia-Pacific | China | |
| India | ||
| Japan | ||
| Australia | ||
| Indonesia | ||
| South Korea | ||
| Thailand | ||
| Singapore | ||
| Rest of Asia-Pacific | ||
| South America | Brazil | |
| Argentina | ||
| Colombia | ||
| Chile | ||
| Peru | ||
| Rest of South America | ||
| Middle East | United Arab Emirates | |
| Saudi Arabia | ||
| Qatar | ||
| Kuwait | ||
| Bahrain | ||
| Oman | ||
| Rest of Middle East | ||
| Africa | Egypt | |
| South Africa | ||
| Algeria | ||
| Nigeria | ||
| Morocco | ||
| Kenya | ||
| Rest of Africa | ||


Key Questions Answered in the Report
What is the current size of the global food service market?
The food service market was valued at USD 4.34 trillion in 2025 and is forecast to reach USD 7.61 trillion by 2030.
Which region leads the food service market in revenue?
Asia-Pacific holds the largest 43.81% share of 2024 revenue, propelled by urbanisation and supportive government policies.
Which segment is expanding fastest within the food service market?
Cloud Kitchens are projected to grow at an 18.17% CAGR to 2030 as digital-only brands leverage low-overhead delivery models.
How fast is delivery revenue growing compared with dine-in?
Delivery services are advancing at a 14.85% CAGR, outpacing dine-in growth as consumers prioritise convenience.
Page last updated on:


