
Food Encapsulation Market Size and Share
Market Overview
| Study Period | 2021 - 2031 |
|---|---|
| Market Size (2026) | USD 15.82 Billion |
| Market Size (2031) | USD 24.82 Billion |
| Growth Rate (2026 - 2031) | 9.42 % |
| Fastest Growing Market | Asia Pacific |
| Largest Market | North America |
| Market Concentration | Medium |
Major Players *Disclaimer: Major Players sorted in no particular order Image © Mordor Intelligence. Reuse requires attribution under CC BY 4.0. | |
Food Encapsulation Market Analysis by Mordor Intelligence
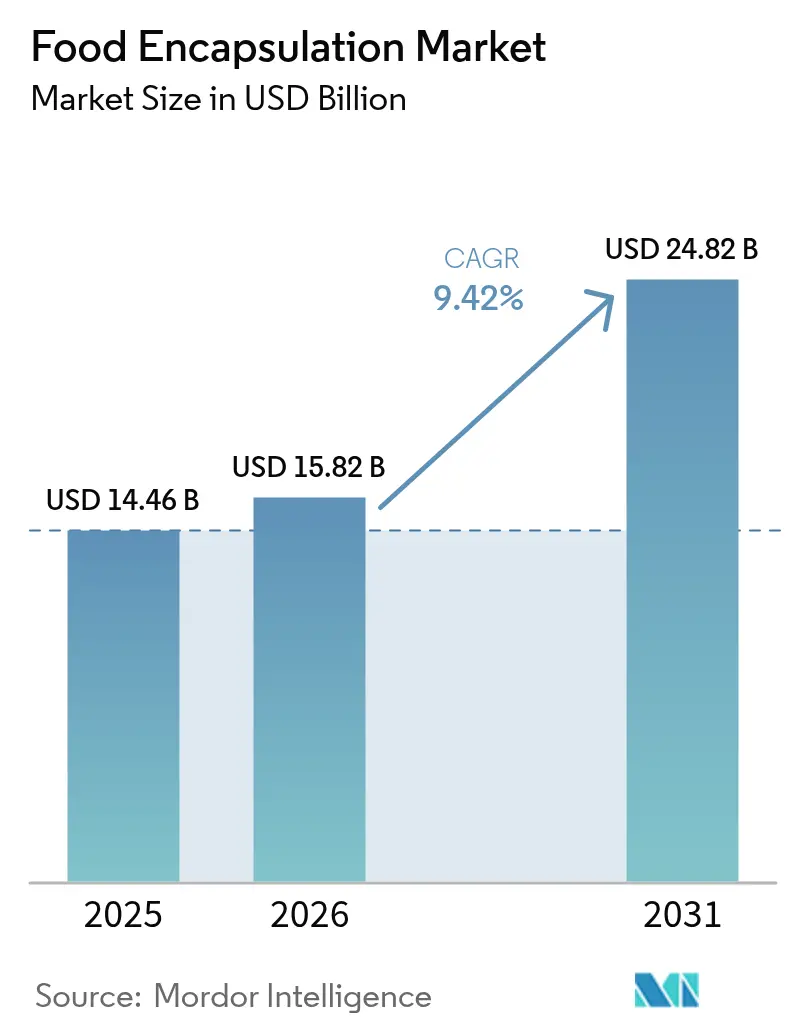
Food encapsulation market size in 2026 is estimated at USD 15.82 billion, growing from 2025 value of USD 14.46 billion with 2031 projections showing USD 24.82 billion, growing at 9.42% CAGR over 2026-2031. The market growth is driven by increasing consumer demand for functional foods, regulatory requirements for clean-label formulations, and advancements in delivery systems. The market expansion responds to requirements for protecting bioactive compounds during processing, extending product shelf life, and masking unwanted flavors of nutritional ingredients. The rising adoption of microencapsulation techniques in the food industry enables manufacturers to enhance product stability and bioavailability. These technologies protect ingredients from oxidation, moisture, and temperature variations while maintaining their nutritional properties. The dairy and bakery sectors are significant users of encapsulation technologies, particularly for probiotics and omega-3 fatty acids. Additionally, the beverage industry increasingly utilizes these technologies for flavor retention and controlled release of functional ingredients. Emerging technologies like electrospinning and nanoencapsulation are gaining traction for their precision and efficiency. The market also sees growing demand for plant-based coating materials and sustainable encapsulation processes, aligning with environmental concerns and clean-label trends.
Key Report Takeaways
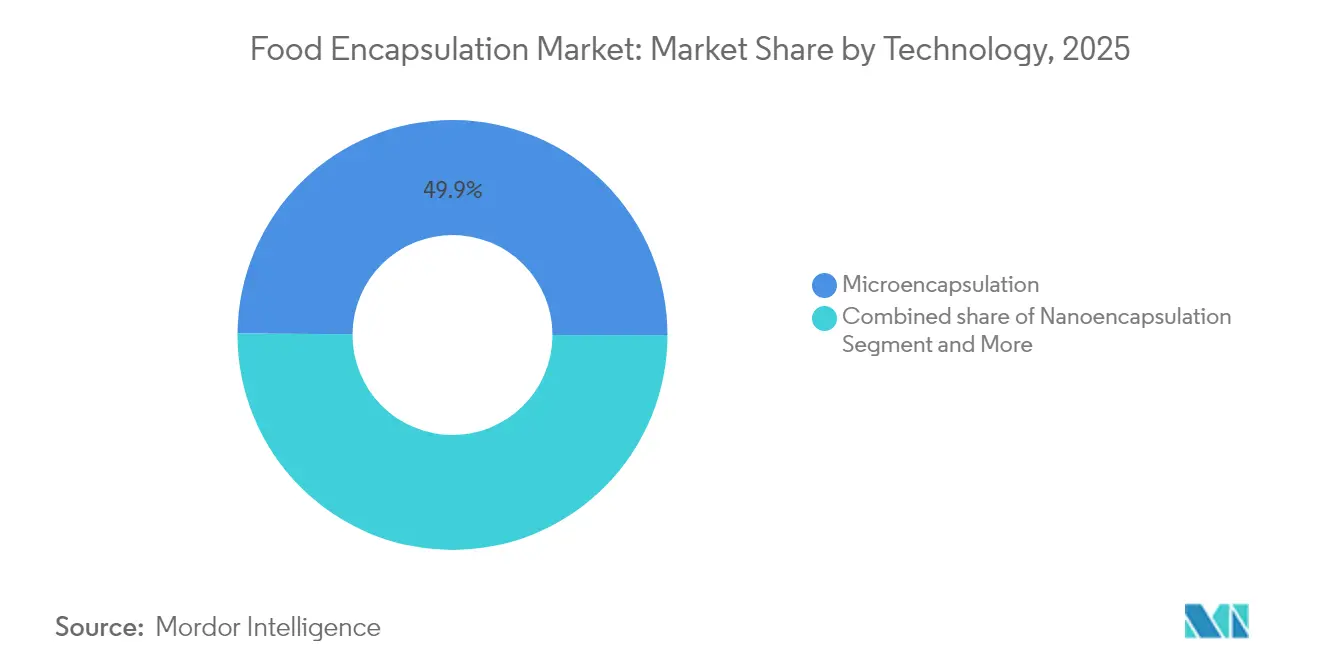
- By technology, microencapsulation held a 49.88% food encapsulation technologies market share in 2025, and hybrid systems are projected to expand at a 12.44% CAGR from 2026-2031.
- By material type, polysaccharides led with 39.92% share in 2025, while protein-based walls are set to grow at 12.63% CAGR through 2031.
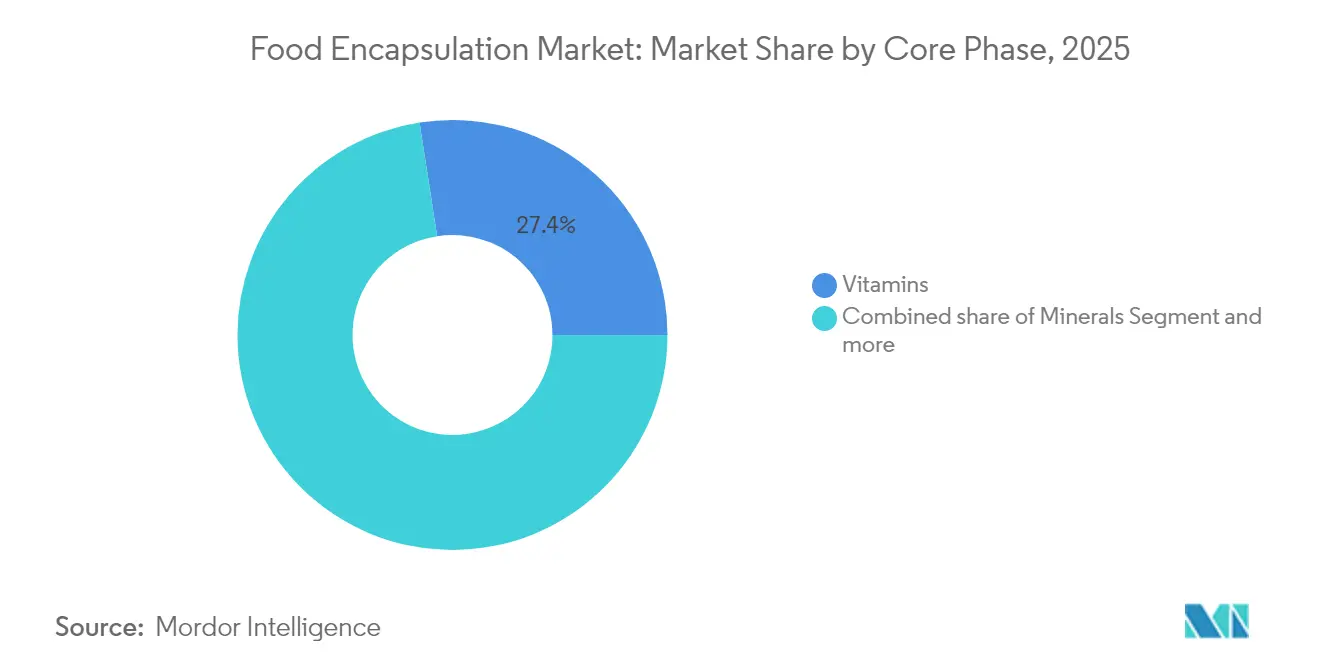
- By core phase, vitamins accounted for 27.45% of the food encapsulation technologies market size in 2025; probiotics is expected to register the fastest 11.66% CAGR to 2031.
- By application, foods and beverages dominated with 66.62% revenue share in 2025; dietary supplements rise at a 13.02% CAGR over the forecast period.
- By region, North America commanded 34.20% share in 2025, whereas Asia-Pacific is forecast to post a 12.42% CAGR to 2031.
Note: Market size and forecast figures in this report are generated using Mordor Intelligence’s proprietary estimation framework, updated with the latest available data and insights as of 2026.
Market Trends and Insights
Drivers Impact Analysis of Food Encapsulation Market*
| Driver | (~) % Impact on CAGR Forecast | Geographic Relevance | Impact Timeline |
|---|---|---|---|
| Rising demand for controlled release and improved stability of active ingredients during food processing | +2.1% | Global, with concentration in North America & Europe | Medium term (2-4 years) |
| Increasing demand for functional foods and dietary-supplement fortification | +2.8% | Global, led by Asia-Pacific and North America | Long term (≥ 4 years) |
| Growing adoption of encapsulation technologies to extend product shelf life and preserve ingredient efficacy | +1.9% | Global, particularly emerging markets | Medium term (2-4 years) |
| Increasing use of encapsulation in masking unpleasant flavors and odors of active ingredients | +1.4% | Global, with emphasis on dietary supplements sector | Short term (≤ 2 years) |
| Expanding use of encapsulation for targeted nutrient delivery in personalized nutrition and medical foods | +2.2% | North America & Europe, expanding to Asia-Pacific | Long term (≥ 4 years) |
| Technological advancements in encapsulation techniques | +1.8% | Global, led by developed markets | Medium term (2-4 years) |
| Source: Mordor Intelligence | |||
Rising demand for controlled release and improved stability of active ingredients during food processing
The imperative for controlled release systems has intensified as food manufacturers grapple with increasingly complex processing environments that can degrade sensitive nutrients. Advanced encapsulation techniques now enable precise timing of ingredient release, with some systems achieving 95% retention of bioactive compounds during thermal processing compared to 60% for unencapsulated ingredients. Single-cell encapsulation technologies, termed "Armor Probiotics," represent a paradigm shift by providing individual cellular protection rather than bulk encapsulation, dramatically improving survival rates in harsh processing conditions. The technology proves particularly valuable in high-temperature applications where traditional encapsulation fails, enabling manufacturers to fortify products previously incompatible with heat-sensitive nutrients. This precision approach reduces ingredient waste by up to 40% while ensuring consistent bioavailability across different processing methods. The trend toward personalized nutrition amplifies demand for controlled release systems that can deliver specific nutrients at predetermined rates throughout digestion.
Increasing demand for functional foods and dietary-supplement fortification
Consumer health consciousness has evolved beyond basic nutrition to targeted wellness outcomes, driving unprecedented demand for fortified products that deliver measurable health benefits. Regulatory bodies increasingly recognize encapsulated nutrients as superior delivery mechanisms. The growing application of encapsulation in dietary supplements reflects consumers' willingness to pay premium prices for enhanced bioavailability and targeted delivery. Encapsulation enables the combination of previously incompatible ingredients in single formulations, creating synergistic effects that amplify health benefits. This trend particularly benefits the aging population seeking convenient, effective nutritional interventions for age-related health concerns.
Growing adoption of encapsulation technologies to extend product shelf life and preserve ingredient efficacy
Supply chain disruptions and sustainability concerns have elevated shelf life extension from a convenience feature to a business imperative, with encapsulation technologies offering solutions that reduce food waste while maintaining nutritional integrity. Recent innovations in bacterial nanocellulose encapsulation demonstrate remarkable thermal stability improvements, with vitamin B complex degradation temperatures increasing from 207°C to 340°C for B1 and similar enhancements across other vitamins. Smart packaging integration with encapsulated ingredients creates active preservation systems that respond to environmental changes, extending fresh produce shelf life compared to traditional packaging. The technology proves especially valuable in emerging markets where cold chain infrastructure remains limited, enabling broader distribution of nutritious products. Manufacturers increasingly view encapsulation as insurance against supply chain volatility, with protected ingredients maintaining potency even under suboptimal storage conditions. The convergence of encapsulation with IoT sensors creates predictive preservation systems that optimize release timing based on real-time environmental data.
Technological advancements in encapsulation techniques
The encapsulation field experiences rapid innovation as traditional boundaries between nano and microencapsulation blur, giving rise to hybrid systems that optimize protection and release characteristics for specific applications. Electrospinning techniques now achieve encapsulation efficiencies exceeding 97% while maintaining probiotic viability under extreme thermal stress, with gelatin-dextran nanofibers protecting Lactobacillus plantarum at temperatures up to 72°C. Protein-polysaccharide conjugation represents another breakthrough, with rice protein-inulin complexes demonstrating 96.99% encapsulation efficiency and superior gastrointestinal survival compared to native proteins. Machine learning algorithms now optimize encapsulation parameters in real-time, reducing development cycles from months to weeks while improving consistency. The integration of natural biopolymers with synthetic materials creates biodegradable encapsulation systems that address environmental concerns while maintaining performance. These technological leaps enable previously impossible applications, such as encapsulating volatile compounds that require precise release timing during mastication.
Restraints Impact Analysis of Food Encapsulation Market*
| Restraint | (~) % Impact on CAGR Forecast | Geographic Relevance | Impact Timeline |
|---|---|---|---|
| High capital and processing costs | -1.8% | Global, particularly impacting smaller manufacturers | Short term (≤ 2 years) |
| Storage and shelf-life limitations of encapsulated ingredients | -1.2% | Global, with greater impact in tropical regions | Medium term (2-4 years) |
| Raw material cost fluctuations | -1.1% | Global, with acute impact in emerging markets | Short term (≤ 2 years) |
| Thermal and mechanical instability of encapsulated ingredients during advanced food processing methods | -0.9% | Global, concentrated in high-temperature processing sectors | Medium term (2-4 years) |
| Source: Mordor Intelligence | |||
High capital and processing costs
The substantial capital requirements for advanced encapsulation equipment create significant barriers to entry, particularly for smaller manufacturers seeking to compete with established players who benefit from economies of scale. Spray-drying systems capable of producing consistent microencapsules require high investments. Raw material costs compound the challenge, with specialized wall materials like modified proteins commanding premium prices that can increase ingredient costs by 200-400% compared to conventional alternatives. The complexity of process optimization requires specialized expertise that commands high salaries, further inflating operational costs. Energy-intensive processes like freeze-drying for sensitive probiotics can increase production costs by 50-80% compared to conventional preservation methods. These cost pressures force manufacturers to focus on high-margin applications, limiting the technology's penetration into mass-market products where price sensitivity remains paramount.
Storage and shelf-life limitations of encapsulated ingredients
Despite protection benefits, encapsulated ingredients often exhibit shorter shelf lives than anticipated, creating inventory management challenges and limiting product development flexibility for manufacturers. Moisture sensitivity remains a critical vulnerability, with many encapsulated probiotics losing viability within 6-12 months under typical storage conditions, compared to 24-36 months for freeze-dried alternatives. Temperature fluctuations during transportation and storage can compromise capsule integrity, leading to premature release and ingredient degradation that undermines the encapsulation investment. The requirement for specialized storage conditions increases supply chain complexity and costs, particularly problematic for global distribution networks. Quality control becomes more challenging as encapsulated ingredients require sophisticated analytical methods to verify integrity and potency throughout their lifecycle. These limitations force manufacturers to maintain larger safety stocks and implement more frequent quality testing, increasing working capital requirements and operational complexity.
*Our forecasts treat driver/restraint impacts as directional, not additive. The impact forecasts reflect baseline growth, mix effects, and variable interactions.
Food Encapsulation Market Segment Analysis
By Technology:
Hybrid Systems Drive InnovationHybrid encapsulation technologies grow at 12.44% CAGR through 2031, while microencapsulation holds 49.88% market share in 2025, indicating a market shift toward advanced multi-layer protection systems. This trend emerges as manufacturers recognize the limitations of single-technology approaches in meeting the stability and release requirements of functional ingredients. Microencapsulation maintains market leadership through its established reliability and cost-effectiveness, particularly in vitamin and mineral fortification applications. Nanoencapsulation advances in premium segments requiring improved bioavailability, with lipid-based systems demonstrating effectiveness for fat-soluble compounds.
Hybrid technologies gain prominence by combining nanoencapsulation's quick release properties with microencapsulation's protective features, enabling customized delivery profiles. Patent applications show technical advancement in multi-layer systems, incorporating pH-responsive elements and time-release mechanisms designed for specific digestive conditions. These systems prove essential in probiotic applications, providing protection during manufacturing and controlled release in the intestinal environment. While current costs restrict hybrid systems to high-value products, ongoing improvements in manufacturing efficiency indicate wider adoption as equipment expenses decrease.



By Material Type:
Protein Innovation AcceleratesProtein-based encapsulation materials are growing at 12.63% CAGR through 2031, while polysaccharides hold 39.92% market share in 2025, driven by clean-label demands and superior functional properties for specific applications. This acceleration reflects the food industry's broader shift toward recognizable, naturally-derived ingredients that resonate with health-conscious consumers. Polysaccharides retain their leadership through versatility and cost-effectiveness, with alginate and chitosan particularly valued for their film-forming properties and biocompatibility. Lipids serve specialized roles in moisture barrier applications, while emulsifiers enable complex formulations requiring stability across diverse pH and temperature conditions.
The protein segment's rapid growth stems from recent breakthroughs in modification techniques that enhance solubility and encapsulation efficiency, with enzyme-modified proteins achieving encapsulation rates exceeding 96% . Whey protein complexes with polysaccharides demonstrate superior thermal stability, maintaining probiotic viability at temperatures up to 72°C compared to 55°C for unmodified proteins. Plant-based proteins gain momentum as manufacturers seek allergen-free alternatives, with pea and rice proteins showing comparable performance to dairy-derived options. The regulatory environment increasingly favors protein-based systems as GRAS-approved materials, accelerating their adoption in novel food applications. Other shell materials, including synthetic polymers and hybrid composites, occupy niche roles where specific performance characteristics justify their higher costs.
By Core Phase:
Probiotics Lead Growth RevolutionThe probiotics segment is projected to grow at a CAGR of 11.66% through 2031, while vitamins hold a 27.45% market share in 2025. The rapid growth of probiotics reflects increasing consumer awareness of gut health benefits and their role in functional foods. Scientific research supporting the connection between gut microbiome health and overall wellness drives this expansion. Vitamins maintain market leadership due to their proven effectiveness and regulatory compliance, especially in fortification applications where enhanced bioavailability supports encapsulation investments.
Single-cell encapsulation technologies revolutionize probiotic delivery by providing individual cellular protection rather than bulk encapsulation, dramatically improving survival rates during processing and storage. Prebiotics increasingly complement probiotic formulations, creating synbiotic systems that enhance overall efficacy. Other core materials, including peptides and botanical extracts, expand as personalized nutrition drives demand for targeted bioactive delivery.
By Application:
Dietary Supplements Surge AheadThe dietary supplements segment is projected to grow at a CAGR of 13.02% through 2031, while foods and beverages hold 66.62% of the market share in 2025. Consumers demonstrate increased acceptance of premium pricing for supplements offering targeted health benefits and enhanced bioavailability. The supplement industry justifies encapsulation costs through improved efficacy and consumer education. Foods and beverages maintain market leadership through widespread applications in fortification and functional food development, enabling new nutrient combinations through encapsulation technology.
The dietary supplements market expansion is driven by clear regulations for encapsulated ingredients and increased consumer understanding of bioavailability benefits. Innovations in softgel technology, including carrageenan and pectin-based plant alternatives, meet clean-label requirements while maintaining product effectiveness. In the foods and beverages segment, encapsulation technology masks ingredient flavors, increasing consumer acceptance of fortified products. Bakery and confectionery applications show high adoption rates due to processing requirements for ingredient protection, while processed meat alternatives use encapsulation for texture and flavor improvements.
Geography Analysis
North America Food Encapsulation Market
North America holds 34.20% market share in 2025, supported by its robust regulatory framework and consumer acceptance of premium-priced functional foods. The region's dominance is based on well-established food innovation infrastructure and widespread adoption of encapsulation technologies by major food manufacturers. The FDA's clear guidelines on encapsulated ingredients encourage manufacturer investment in product development, while consumer understanding of bioavailability benefits supports higher pricing. The FDA's decision to eliminate PFAS in food contact materials creates new opportunities for bio-based encapsulation systems . The region's strong dietary supplement market, where encapsulation yields high margins, maintains its market position despite lower growth rates.
APAC Food Encapsulation Market
Asia-Pacific demonstrates the fastest growth at 12.42% CAGR through 2031. Increasing disposable incomes and health awareness drive demand for premium functional foods, while urban expansion creates preservation challenges that encapsulation addresses through improved shelf life. China's regulations now support more encapsulated ingredients, allowing functional delivery through various formats, including candies, beverages, and chocolates. India and Japan contribute through their combination of traditional medicine with modern food technology, developing new applications for encapsulated herbal ingredients. The region's lower manufacturing costs enable wider implementation of encapsulation technologies in mainstream products.
Europe Food Encapsulation Market
Europe shows consistent growth through strict quality requirements and increased adoption of novel food regulations favoring encapsulated ingredients. EFSA's new guidance, effective February 2025, simplifies approval processes for innovative delivery systems . The region's focus on clean-label products increases demand for natural encapsulation materials, especially protein-based systems. Germany and the United Kingdom lead in adoption through their developed food processing sectors, while Mediterranean countries specialize in encapsulating traditional ingredients like olive oil compounds. The aging European population sustains demand for nutritional products using encapsulation for targeted delivery. UK manufacturers have increased encapsulation adoption to address Brexit-related supply chain changes.
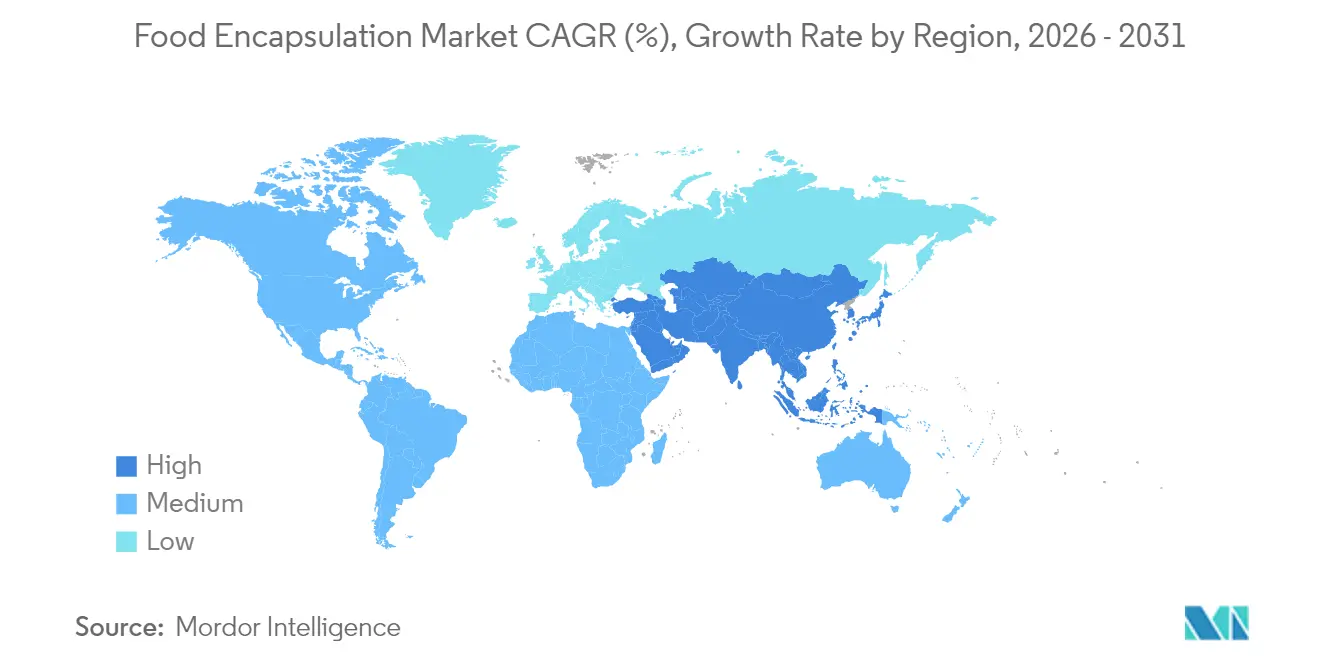
Note: Regional shares of all individual regions will be available upon report purchase

Regulatory Landscape
Food encapsulation sits within food additive, novel food, and processing-aid frameworks, with requirements shaped by both the encapsulated active and the wall or support material. In the European Union, EFSA guidance for dossiers (including for food enzymes that use immobilization or encapsulation supports) shapes data expectations on support materials and processing chemicals. In parallel, the EU additives framework (Regulation (EC) No 1333/2008, as amended) anchors authorizations and specifications for many commonly used encapsulation materials. The report base year (2025) aligns with EFSA guidance changes referenced in the report context (effective February 2025) that streamline parts of approval workflows for innovative delivery systems, which reinforces the need for well-documented characterization and exposure assessment for encapsulated ingredients.
In the United States, the FDA regulates many encapsulated ingredients through food additive pathways and GRAS routes, and encapsulated food enzymes can fall under secondary direct food additive provisions in 21 CFR 173. FDA guidance on submitting chemical and technological data for food additive petitions, along with the agency's public tracking of petitions under active review (maintained through at least May 2026), keeps dossier quality and analytical substantiation central for encapsulation-related innovation. These regulatory expectations raise the bar for ingredient identity, purity, and performance documentation, particularly when particle size, immobilization supports, or new delivery architectures are used to achieve controlled release.
Value Chain Analysis
The value chain starts with raw-material suppliers providing wall materials (polysaccharides, proteins, lipids, emulsifiers, and other shells) and core bioactives (vitamins, minerals, probiotics, enzymes, organic acids, and essential oils). Formulation and process development then take place with encapsulation technology providers and ingredient houses. Commercial-scale manufacture relies on unit operations such as spray drying, extrusion, and freeze drying, with choices driven by stability targets, release profiles, and cost constraints. Downstream, encapsulated ingredients are sold B2B to food and beverage, dietary supplement, and animal nutrition manufacturers for integration into finished products.
Commercialization and distribution increasingly combine platform IP with established ingredient channels. For example, in May 2026, RFI Ingredients announced a partnership with Aventus Innovations to distribute the NutraJIT sustained-release delivery platform in the United States, showing how delivery technology developers, ingredient distributors, and brand manufacturers coordinate to scale adoption. Regulatory and quality gates (GRAS or food additive compliance in the US, and EU novel food or additive requirements where applicable, including particle-technical characterization for certain materials) add service layers around testing, documentation, and claims substantiation, which can be a bottleneck for smaller firms facing high capital and analytical costs.
Competitive Landscape
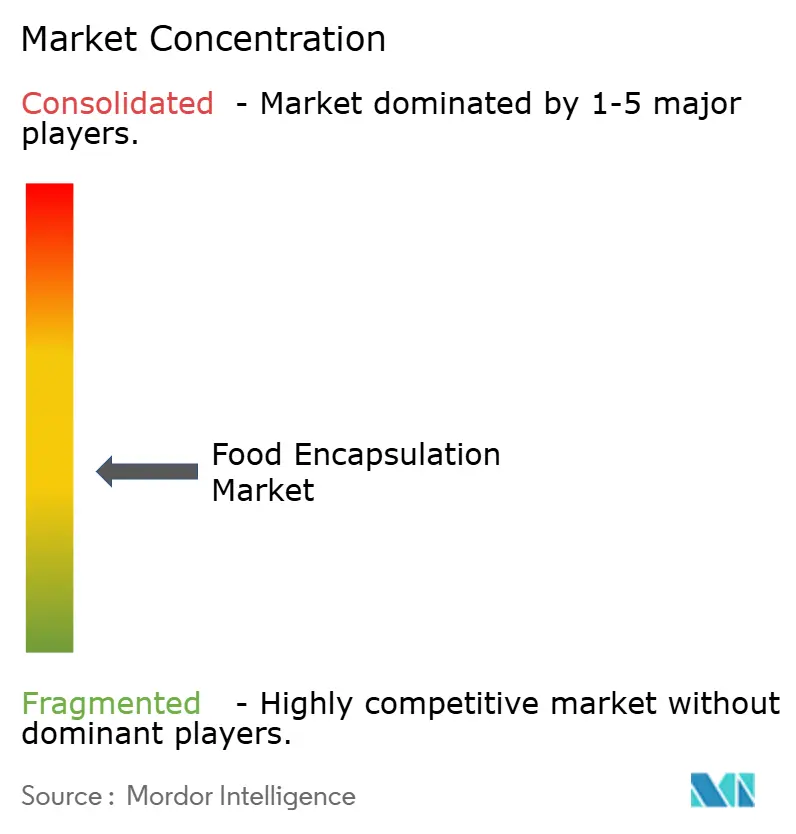
The food encapsulation market demonstrates moderate fragmentation. Established ingredient suppliers are acquiring specialized encapsulation capabilities to provide integrated solutions with higher margins. This strategic move enables these suppliers to cater to the growing demand for advanced and customized ingredient delivery systems across various industries, including food, pharmaceuticals, and cosmetics. The market structure enables both large-scale manufacturers and niche players to coexist, fostering innovation and specialized product development. This coexistence drives competition and encourages the continuous evolution of encapsulation technologies to meet diverse consumer needs.
Key market players include BASF SE, Cargill Incorporated, Kerry Group plc, Royal FrieslandCampina N.V., and Ingredion Incorporated. These companies maintain their competitive positions through extensive distribution networks, diverse product portfolios, and strategic partnerships. Companies' market positions are increasingly determined by their technological capabilities, with significant investments in proprietary encapsulation platforms that enhance protection and release properties.
Patent activities focus on hybrid encapsulation systems and new wall materials, particularly multi-layer approaches that integrate multiple encapsulation technologies for enhanced performance. Market leaders are strengthening their research and development capabilities to develop innovative solutions, while also pursuing strategic acquisitions to expand their technological expertise and geographical presence.
Food Encapsulation Industry Leaders
BASF SE
Cargill, Incorporated
Kerry Group plc
Royal FrieslandCampina N.V.
Ingredion Incorporated
- *Disclaimer: Major Players sorted in no particular order
Food Encapsulation Market Companies Covered in this Report
- BASF SE
- Cargill, Incorporated
- Kerry Group plc
- Royal FrieslandCampina N.V.
- Ingredion Incorporated
- GAT Food Essentials GmbH
- TasteTech
- Advanced Bionutrition Corp
- DSM-Firmenich AG
- Balchem Corporation
- Glatt GmbH
- Symrise AG
- AVEKA
- Tate & Lyle PLC
- Sphera Encapsulation
- Lycored Ltd.
- Ashland Global Holdings Inc.
- International Flavors & Fragrances Inc.
- Sensient Technologies
- Innovia

Market Opportunities and Future Outlook
Use cases that require sensory management and time-release functionality create near-term whitespace for encapsulation as a product-design tool, not just a protection step. A specific example is RAPS (Germany), which highlighted its Flavocaps microencapsulation approach for controlled and delayed flavor release in February 2026, positioned for bakery, snacks, and meat applications where salt and sugar reduction initiatives put pressure on taste delivery. This connects to the report's demand drivers around masking off-notes, improving stability of actives during processing, and expanding controlled-release systems across foods, beverages, and supplements.
Demand is also shifting toward higher-precision and next-generation processes that improve retention and gastrointestinal targeting while meeting clean-label preferences for recognizable wall materials. Protein-based walls, including plant proteins such as pea and rice highlighted in the report context, support tunable release profiles and allergen-management strategies, complementing ongoing shifts toward hybrid systems that combine multi-layer protection with tailored release. Scale-up constraints and compliance documentation for advanced methods (including electrohydrodynamic techniques and particle-characterization requirements where relevant) leave room for suppliers that pair validated processing know-how with analytical substantiation and application support for probiotics, vitamins, and other sensitive actives used across dairy, bakery, beverages, and dietary supplements.
Recent Industry Developments in Food Encapsulation Market
- July 2026: Microcaps AG announced a strategic collaboration with Givaudan that included an equity investment, centered on deploying Microcaps' microfluidic encapsulation technology for fragrance and beauty applications. The collaboration highlights accelerating interest in microfluidic platforms and can support technology transfer and scale-up know-how relevant for precision-controlled release solutions across adjacent ingredient markets.
- May 2026: Lonza Capsugel published peer-reviewed research in Pharmaceutics on its Licaps DUOCAP capsule-in-capsule technology, reporting higher enzyme activity delivery in the upper small intestine versus standard immediate-release capsules. The findings strengthen the evidence base for multi-compartment delivery architectures and show how performance data can be used to differentiate encapsulated formats in health-focused nutrition applications.
- June 2024: Big Idea Ventures launched BioCloak, Inc. through its Generation Food Rural Partners Fund to develop and commercialize bio-based encapsulation technologies aimed at reducing microplastics while improving protection and performance of active ingredients. The launch adds venture-backed momentum behind alternative, bio-based encapsulation approaches that align with sustainability and clean-label positioning.


Food Encapsulation Market Report Scope and Research Methodology
Market Definition and Coverage
This market is sized as the value of food-grade encapsulation solutions used to protect, stabilize, and deliver sensitive ingredients in food and beverage products, where the encapsulation material and process are part of the finished ingredient offering.
Scope exclusions: We exclude pharmaceutical drug delivery encapsulation and non-food industrial encapsulation uses even if similar techniques are used.
Segments Covered in This Report
- By Technology
- Microencapsulation
- Nanoencapsulation
- Hybrid Technologies
- By Material Type
- Polysaccharides
- Proteins
- Lipids
- Emulsifiers
- Other Shell Materials
- By Core Phase
- Vitamins
- Minerals
- Enzymes
- Organic Acids
- Additives
- Probiotics
- Prebiotics
- Essential Oils
- Other Core Materials
- By Application
- Foods and Beverages
- Bakery and Confectionery
- Snacks Products
- Processed Meat, Seafood and Meat Alternatives
- Other Food and Beverages
- Dietary Supplements
- Animal Feed and Pet Nutrition
- Other Applications
- Foods and Beverages
- By Geography
- North America
- United States
- Canada
- Mexico
- Rest of North America
- Europe
- Germany
- United Kingdom
- Italy
- France
- Spain
- Netherlands
- Rest of Europe
- Asia-Pacific
- China
- India
- Japan
- Australia
- Rest of Asia-Pacific
- South America
- Brazil
- Argentina
- Rest of South America
- Middle East and Africa
- South Africa
- Saudi Arabia
- Rest of Middle East and Africa
- North America
Data Sources, Market Sizing, and Validation
Desk Research
Desk work starts by mapping how encapsulation is used in real food formulations, then linking that use to measurable indicators that can be checked. We typically lean on public sources such as the USDA and the US FDA, EFSA publications, FAO food statistics, UN Comtrade trade flows for key ingredient categories, and peer-reviewed food science journals that describe adoption of microencapsulation and nanoencapsulation techniques.
After that, we review company annual reports, investor decks, technical brochures, and credible press to understand product mix shifts such as probiotics, vitamins, and essential oils, plus how clean-label pressure affects shell material choices. When needed, we also reference paid subscriptions for company financials and intelligence, patent databases, and shipment-level trade databases so assumptions on participation and pricing can be cross-checked. The examples listed above are indicative only, and many additional sources were also reviewed for data collection, validation, and clarification.
Primary Interviews and Surveys
Primary work is used to pressure-test the desk assumptions that move the model most, especially typical pricing ranges, adoption intensity by application, and which encapsulation technologies are actually commercial at scale. We speak with a mix of ingredient suppliers, encapsulation solution providers, food and beverage manufacturers, and distribution-side experts across APAC, EMEA, and the Americas so regional demand patterns and formulation trends are reflected rather than assumed.
Distribution of primary research fieldwork respondents
| Company type | Respondent position | Region |
|---|---|---|
| Top tier: 36% | CXOs: 14% | APAC: 49% |
| Mid tier: 50% | Functional/Unit leaders: 32% | EMEA: 29% |
| Smaller Players: 14% | Managers: 54% | Americas: 22% |
Market-Sizing & Forecasting
Sizing is built using a top-down and bottom-up approach, where the top-down track reconstructs demand from food ingredient consumption and production signals, then applies an encapsulation adoption and value-add factor by major use areas. In practice, we translate indicators such as functional food launches, probiotics and vitamin fortification intensity, shelf-life extension requirements, and emulsifier and lipid system usage into a reasonable demand pool that can be priced.
To keep the totals realistic, the model is corroborated with selective bottom-up checks, such as sampling supplier revenues where they disclose food encapsulation exposure, channel feedback on volumes, and sanity checks using typical price bands for encapsulated ingredients. When full visibility is not possible for smaller participants, gaps are handled through share-based allocation anchored to capacity signals, patenting activity, and regional demand proxies, then adjusted only if interview feedback points to overcounting.
Forecasts are developed using scenario analysis, with short-term assumptions guided by expected changes in clean-label reformulation, stability requirements for sensitive actives, technology mix shifts between microencapsulation and newer formats, and regional food processing growth. Each scenario is reviewed with experts so the final forecast reflects how adoption and pricing are likely to move together, rather than being driven by one single trend.
Data Validation & Update Cycle
Validation is done by checking the model outputs against independent signals like trade movement of relevant ingredient categories, capacity and expansion announcements, and consistency of implied pricing versus interview ranges. Any sharp variances by region or technology are flagged, reviewed by another analyst, and then traced back to the exact input that caused the jump before the number is finalized.
The study is refreshed on an annual cycle, and we also trigger interim updates when material events happen, such as major regulatory changes affecting food additives, sharp raw material price moves, or large capacity additions. Before delivery, a fresh review pass is completed so the figures reflect the latest available public information and the most recent expert feedback.
Mordor Intelligence's Food Encapsulation Market Size Compared With Other Published Estimates
It is normal to see different market values for food encapsulation because publishers do not always count the same revenue streams, and they also pick different base years and pricing logic. Differences also show up when one estimate leans more on stated supplier narratives, and another uses demand-side checks tied to food production and ingredient usage.
Some published figures appear to use a broader basket that blends adjacent functional ingredient revenues even when encapsulation is not clearly priced as a separate value-add. In Mordor Intelligence sizing, revenue is counted only when the offering is a food-grade encapsulated ingredient or encapsulation solution sold into food and beverage use, and non-food encapsulation applications are kept out so the total stays traceable to real adoption indicators.
Benchmark comparison
| Source | Market Size | Gaps in Research Methodology |
|---|---|---|
| Mordor Intelligence | USD 15.82 B (2026) | |
| Trade Publisher A | USD 14.40 B (2024) | Uses a different base year and a shorter horizon, and the page-level scope is mainly geography-led with limited detail on how technology and core-phase mix are priced, which can shift the counted value. |
| Industry Research Group B | USD 14.68 B (2025) | Anchors on a 2025 base and emphasizes high-level drivers, but provides limited clarity on what portion is attributed to encapsulation value-add versus broader functional ingredient sales, which can expand or compress the total. |
Taken together, the spread is mainly explained by year selection and what is treated as encapsulation revenue versus adjacent ingredient value. By keeping the market tied to observable adoption signals and pricing checks that can be repeated, the final number stays practical for planning and benchmarking across regions and applications.


Key Questions Answered in the Report
What is the projected size of the food encapsulation technologies market by 2031?
The food encapsulation technologies market size is forecast to reach USD 24.82 billion by 2031, growing at a 9.42% CAGR over 2026-2031.
Which technology segment is expected to grow the fastest?
Hybrid encapsulation systems are set to expand at a 12.44% CAGR as their multilayer designs combine nano- and micro-scale benefits.
Why is Asia-Pacific considered the key growth engine?
Double-digit functional-food demand, supportive regulations and cost-efficient manufacturing hubs drive a 12.42% CAGR in Asia-Pacific.
Which core phase shows the highest growth potential?
Probiotics lead growth with an 11.66% CAGR, supported by advanced single-cell encapsulation techniques that enhance shelf life and digestion-targeted release.
Page last updated on:





