Market Overview
| Study Period | 2021 - 2031 |
|---|---|
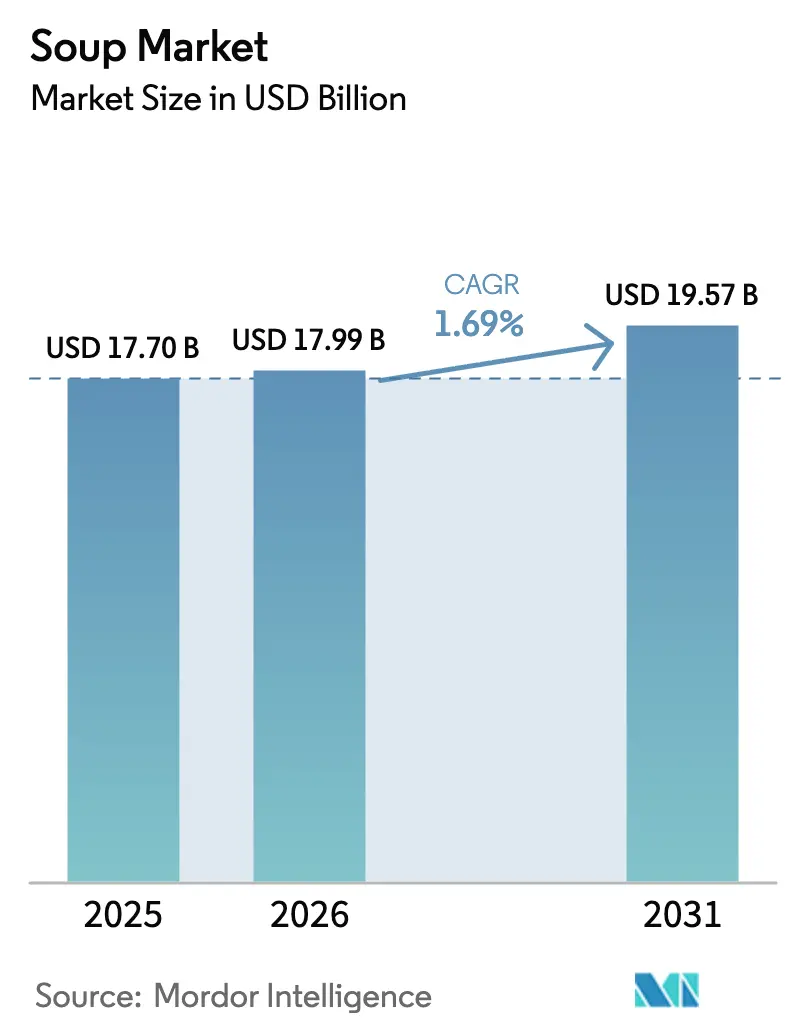
| Market Size (2026) | USD 17.99 Billion |
| Market Size (2031) | USD 19.57 Billion |
| Growth Rate (2026 - 2031) | 1.69% CAGR |
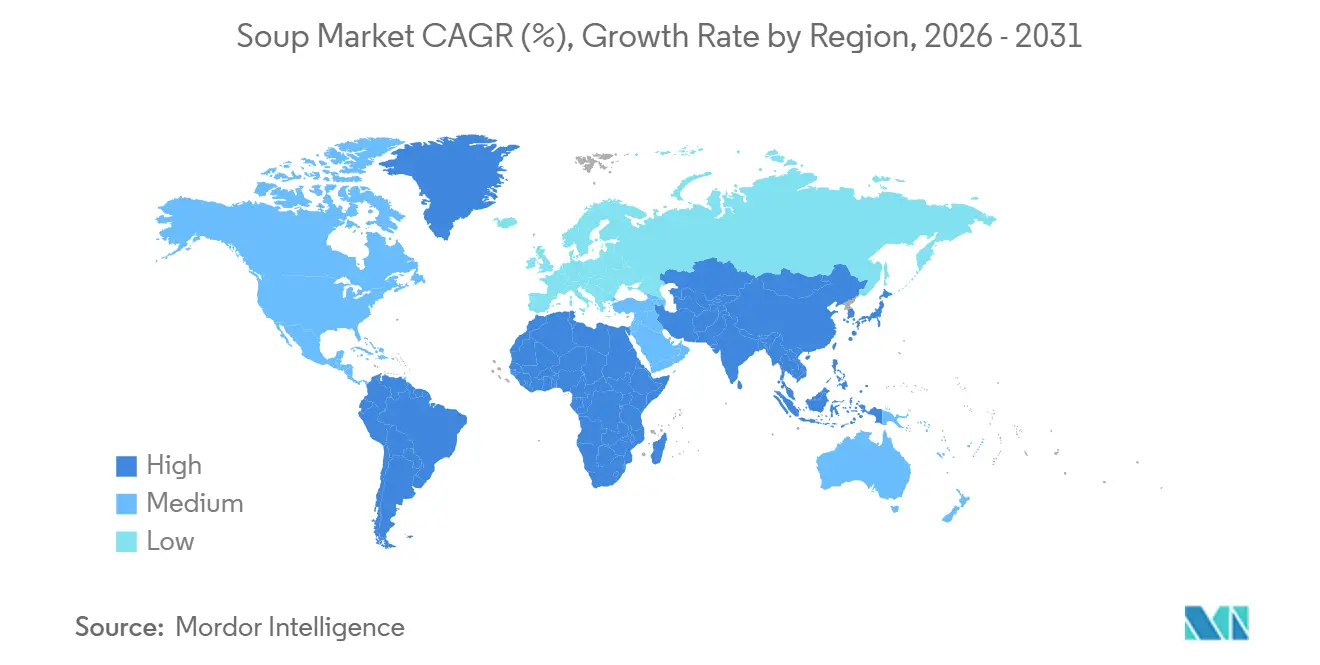
| Fastest Growing Market | Asia Pacific |
| Largest Market | Europe |
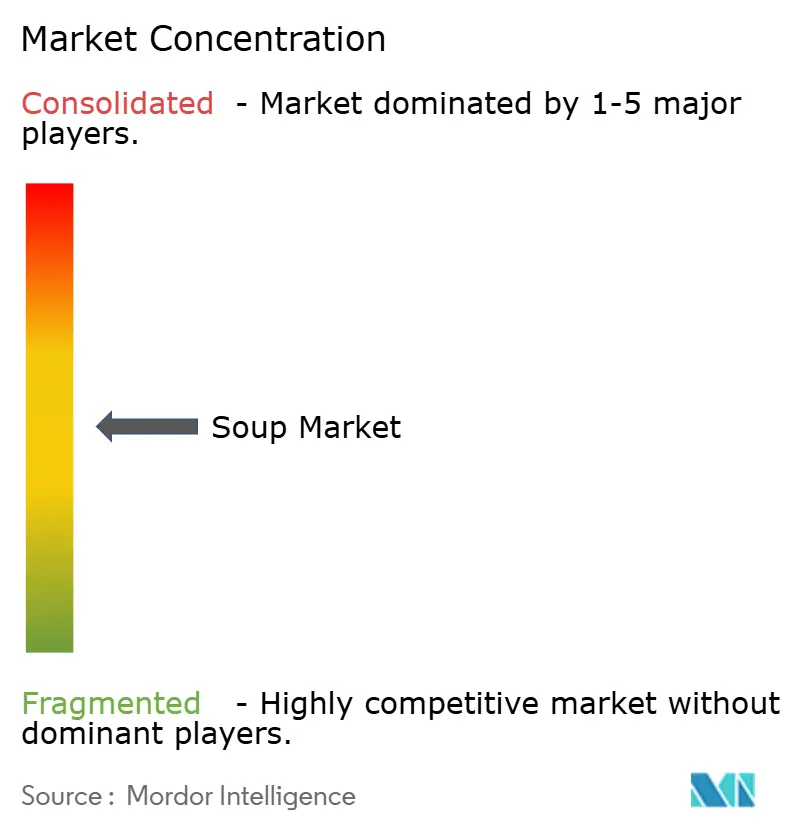
| Market Concentration | Medium |
Major Players
*Disclaimer: Major Players sorted in no particular order Image © Mordor Intelligence. Reuse requires attribution under CC BY 4.0. |
|
Soup Market Analysis by Mordor Intelligence
The Soup Market size was valued at USD 17.70 billion in 2025 and estimated to grow from USD 17.99 billion in 2026 to reach USD 19.57 billion by 2031, at a CAGR of 1.69% during the forecast period (2026 to 2031). Shelf-stable lines still dominate household pantries, yet chilled products are adding new users through fresh-adjacent taste and shorter ingredient lists. Online retail is converting browsing into repeat orders as meal-kit operators and direct-to-consumer brands make delivery frictionless. Reformulation to meet the U.S. FDA's “healthy” claim, along with the rise of plant-forward recipes, is reshaping consumer perception from an emergency pantry staple to an everyday wellness option. Competitive intensity remains moderate, allowing regional specialists to scale through local sourcing stories, clean-label innovations, and ethnic-flavor innovations.
Key Report Takeaways
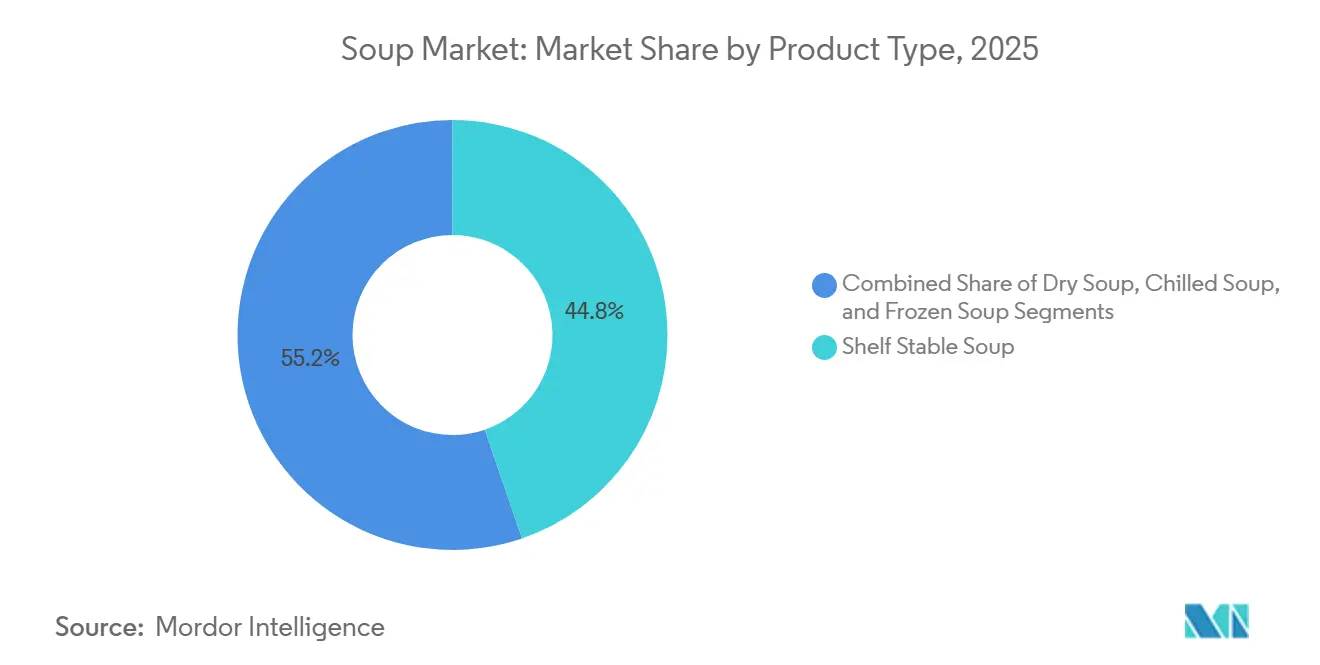
- By product type, shelf-stable soup held 44.76% of the soup market share in 2025, while chilled soup is expected to advance at a 1.88% CAGR through 2031.
- By category, vegetarian offerings accounted for 53.59% of the soup market size in 2025 and are projected to expand at a 2.06% CAGR through 2031.
- By packaging format, pouches accounted for 48.51% of the soup market share in 2025, whereas cans are expected to register the fastest growth rate of 2.62% from 2026 to 2031.
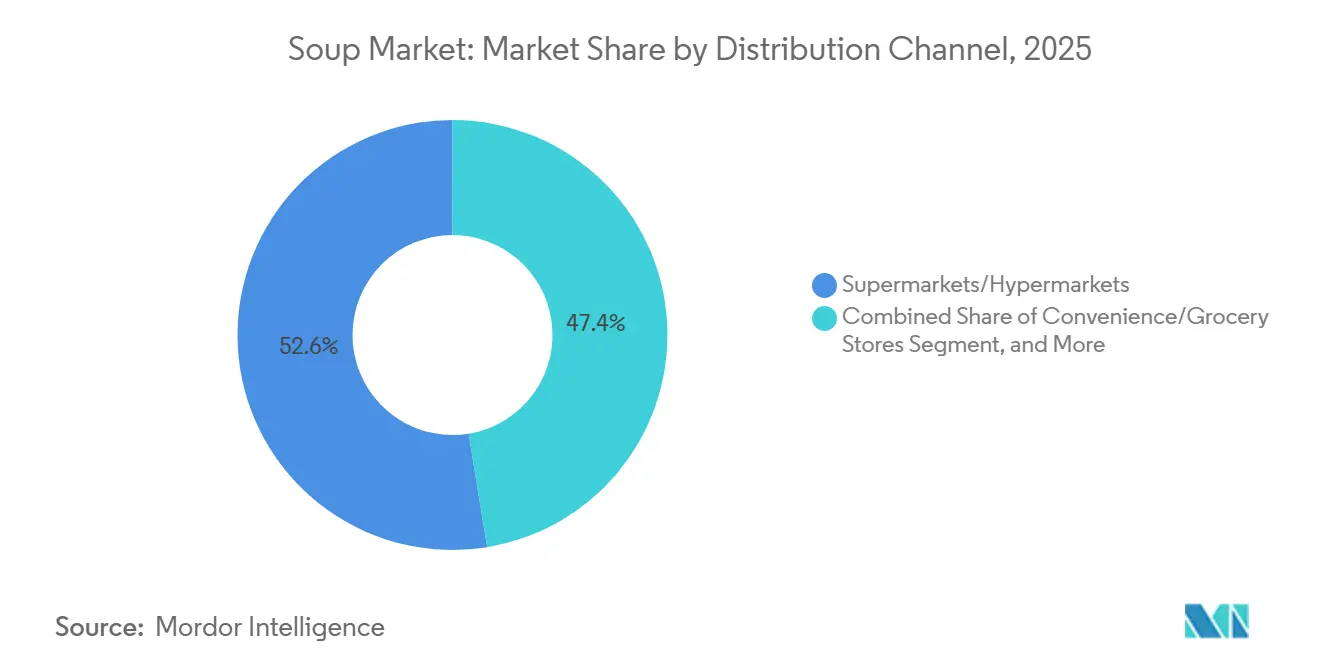
- By distribution channel, supermarkets and hypermarkets led with a 52.58% revenue share in 2025; online retail stores are projected to record the highest CAGR of 2.89% through 2031.
- By geography, Europe accounted for 36.42% of the 2025 value, while the Asia-Pacific region is the fastest-rising, with a 3.14% CAGR from 2026 to 2031.
Note: Market size and forecast figures in this report are generated using Mordor Intelligence’s proprietary estimation framework, updated with the latest available data and insights as of January 2026.
Global Soup Market Trends and Insights
Drivers Impact Analysis*
| Drivers | (~) % Impact on CAGR Forecast | Geographic Relevance | Impact Timeline |
|---|---|---|---|
| Rising popularity of vegan and plant-based soups | +0.4% | Global, with strongest adoption in North America and Europe | Medium term (2-4 years) |
| Product innovation and variety | +0.3% | Global, led by developed markets | Long term (≥ 4 years) |
| Sustainable and eco-friendly packaging | +0.2% | Europe and North America primarily, expanding to Asia-Pacific | Long term (≥ 4 years) |
| Seasonal demand variations | +0.2% | Global, with pronounced effects in temperate regions | Short term (≤ 2 years) |
| Influence of social media and influencers | +0.1% | Global, strongest in urban markets with high digital penetration | Medium term (2-4 years) |
| Demand for quick and easy meal solutions | +0.3% | Global, accelerated in urban centers | Short term (≤ 2 years) |
| Source: Mordor Intelligence | |||
Rising popularity of vegan and plant-based soups
Plant-based soups are gaining traction as flexitarian diets expand beyond coastal metropolitan areas into mainstream grocery aisles. According to the Good Food Institute, U.S. retail sales of plant-based foods reached USD 8.1 billion in 2024, with soups and broths emerging as a fast-growing subcategory driven by pea, lentil, and chickpea bases that provide complete amino acid profiles without animal inputs[1]Source: Good Food Institute, “Plant-Based Market Research,” gfi.org. This trend reflects not only changing dietary preferences but also supply-chain pragmatism, as pulse crops require less water and fertilizer than livestock, helping manufacturers mitigate commodity volatility. In 2024, FDA guidance clarified plant-based labeling, reducing litigation risk and enabling clearer shelf communication. European retailers are supporting the adoption of vegan products through dedicated end-cap displays during Veganuary and other campaigns, converting trials into repeat purchases. Strategically, brands that prioritize sensory optimization, enhancing umami depth and mouthfeel, are positioned to outperform those relying solely on health claims, as taste remains the primary barrier to mainstream acceptance.
Product innovation and variety
Flavor diversification and format experimentation are reshaping purchase drivers, with ethnic profiles such as Thai tom yum, Indian dal, and Mexican pozole migrating from foodservice to retail shelves. Unilever's Knorr brand launched a "Global Flavors" line in 2025, featuring region-specific recipes co-developed with culinary institutes in Bangkok, Mumbai, and Mexico City, targeting multicultural households and adventurous eaters. This innovation extends beyond taste to texture and preparation convenience; single-serve microwaveable pouches and cold-sippable formats are gaining traction among commuters and office workers who lack access to stovetops. Campbell Soup's "Well Yes!" line, which emphasizes visible vegetable pieces and no artificial ingredients, posted double-digit growth in 2024, demonstrating that transparency and ingredient integrity can command premium pricing. The underlying dynamic is a bifurcation: mass-market players are defending volume through value packs and promotional pricing, while premium entrants are capturing margin through limited-edition releases and chef collaborations that generate social media buzz and drive trial.
Sustainable and eco-friendly packaging
Packaging sustainability in the European plant-based soup market is evolving from a marketing narrative into an operational necessity, driven by EU regulations mandating minimum recycled content in food-contact plastics and extended producer responsibility schemes that assign end-of-life costs to manufacturers. The FDA's approval in 2024 of post-consumer recycled polyethylene terephthalate (rPET) for direct food contact, subject to strict migration testing, opened up supply-chain opportunities for soup producers aiming to reduce their use of virgin resin. Bonduelle’s 2025 commitment to convert 75% of its soup packaging to recyclable or compostable materials by 2027 demonstrates alignment with regulatory compliance and consumer demand[2]Source: Bonduelle, “Bonduelle Accelerates Sustainable Packaging Transition,” bonduelle.com. The strategic challenge is maintaining barrier performance for shelf life and food safety while improving recyclability, since multi-layer laminates are difficult to separate in municipal recycling systems. Brands investing in mono-material pouches or aluminum cans with high recycled content are likely to secure preferential shelf placement in sustainability-focused retailers, whereas laggards risk delisting or margin erosion from regulatory penalties.
Seasonal demand variations
Winter seasonality continues to dominate in temperate markets, with November-to-February sales accounting for 40–50% of annual volume in North America and Northern Europe, creating inventory risks and underutilized production capacity during warmer months. Campbell Soup’s fiscal 2025 earnings call highlighted initiatives to smooth demand through chilled gazpacho and cold-sippable bone broths aimed at summer consumption, reducing reliance on off-peak promotional discounting. The strategic insight is that manufacturers with flexible production lines capable of rapid format changeovers can capture incremental margin by avoiding the dilution caused by deep discounts. Climate volatility further compresses traditional seasonal windows: milder winters in the U.S. Midwest and Northeast reduced heating and cooling demand in early 2025, prompting retailers to liquidate inventory at reduced prices, according to the USDA ERS. Brands that establish year-round positioning, such as protein-forward soups for post-workout recovery or meal replacement, can mitigate seasonal earnings volatility and improve overall asset utilization.
Restraint Impact Analysis*
| Restraint | (~) % Impact on CAGR Forecast | Geographic Relevance | Impact Timeline |
|---|---|---|---|
| Consumer preference for fresh and homemade alternatives | -0.5% | Global, strongest in developed markets | Medium term (2-4 years) |
| Negative perceptions regarding healthiness | -0.3% | North America and Europe primarily | Short term (≤ 2 years) |
| Production efficiency challenges | -0.2% | Global, particularly affecting smaller manufacturers | Long term (≥ 4 years) |
| Supply chain disruptions | -0.3% | Global, with regional variations in severity | Short term (≤ 2 years) |
| Source: Mordor Intelligence | |||
Consumer preference for fresh and homemade alternatives
During periods of economic uncertainty, consumers increasingly prefer fresh food, perceiving homemade meals as both healthier and more economical compared to processed options. The shift in consumer preference challenges soup manufacturers to redefine their value propositions beyond convenience. To remain competitive, manufacturers must innovate by enhancing nutritional density and ensuring ingredient transparency to align with consumer expectations. Research on consumer behavior highlights that familiarity with traditional cooking methods often leads to more nuanced motivations for food preparation, such as nostalgia and perceived health benefits, which processed soups struggle to replicate. To address these challenges, companies need to invest in marketing strategies that emphasize the nutritional equivalence of their products to fresh alternatives. At the same time, they must maintain cost advantages to appeal to budget-conscious consumers, particularly during economic downturns. By balancing these factors, manufacturers can better position themselves in a market increasingly inclined toward fresh food preferences.
Negative perceptions regarding healthiness
Regulatory transparency is intensifying health perception challenges as it brings sodium and preservative content in food products under scrutiny, raising consumer concerns about long-term wellness. The FDA's voluntary sodium reduction goals, aimed at specific soup categories with defined baseline levels and reduction targets, highlight these health concerns while creating significant compliance pressures for manufacturers. Additionally, Regulatory uncertainty surrounding sodium reduction targets, particularly the FDA’s current “as-packaged” sodium concentration standards for dry soup mixes, poses a challenge for manufacturers. The lack of standardized “as-prepared” sodium benchmarks across various formats (dry, canned, bouillon) may lead to unfair comparisons and limit innovation, while ongoing discussions about reclassifying bouillons as non-target categories add further ambiguity[3]Source: The Food Industry Association, "fmi-comments-on-phase-ii-sodium-reduction-draft-guidance", www.fmi.org. Furthermore, front-of-package labeling requirements, which mandate the prominent display of nutrients consumers are advised to limit, could negatively impact impulse purchases, a key driver of soup sales historically. Public health organizations further emphasize that a substantial portion of sodium consumption originates from commercially processed foods, including soups, thereby increasing the demand for more aggressive sodium reduction targets to address these health concerns effectively.
*Our forecasts treat driver/restraint impacts as directional, not additive. The impact forecasts reflect baseline growth, mix effects, and variable interactions.
Segment Analysis
By Product Type: Chilled Formats Capture Fresh-Adjacent Premium
Shelf-stable soup accounted for 44.76% of the market in 2025, driven by its extended shelf life, efficient ambient distribution, and ingrained consumer pantry habits. However, chilled soup is the fastest-growing segment, expanding at a 1.88% CAGR through 2031, as retailers expand their refrigerated sets and consumers increasingly seek fresh-adjacent convenience. Chilled formats offer sensory advantages, brighter vegetable colors, crisper textures, and flavors less affected by retort sterilization, allowing 20-30% price premiums over shelf-stable equivalents. Tideford Organic’s chilled soup range in UK supermarkets achieved 25% year-over-year growth in 2024, highlighting its short ingredient lists and emphasis on freshness cues. Frozen soup, although smaller in volume, caters to foodservice bulk packs and meal-kit applications, offering an extended shelf life without nutrient degradation. In contrast, dry soup mixes, historically dominant in emerging markets, face pressure as rising disposable incomes drive a trade-up to ready-to-eat formats.
The strategic implication is that manufacturers with cold-chain capabilities and regional production footprints can expand margins through chilled innovation, while those reliant on centralized shelf-stable production risk volume erosion. Campbell Soup’s 2025 launch of the “Fresh Starts” refrigerated line in the U.S. Northeast, featuring locally sourced vegetables and a 14-day shelf life, exemplifies this shift toward fresh-adjacent positioning. Regulatory compliance also affects format selection: FDA refrigerated food safety guidelines require continuous temperature monitoring, raising barriers for smaller brands but creating opportunities for regional specialists with tight, reliable supply chains.


By Category: Plant-Forward Eating Drives Vegetarian Dominance
Vegetarian soup accounted for 53.59% of the market in 2025 and is projected to grow at a 2.06% CAGR through 2031, outpacing non-vegetarian offerings as flexitarian diets become mainstream and plant-based eating expands beyond niche segments. This growth reflects multiple converging factors: environmental awareness, animal welfare concerns, health optimization, and advances in plant-protein technology that now deliver taste and texture comparable to meat-based broths. Non-vegetarian soups, including those based on chicken, beef, and seafood, retain loyal followings, particularly among older consumers and in colder climates, where hearty, protein-dense meals align with cultural norms. However, they face challenges from rising poultry and beef costs, as well as growing scrutiny of factory farming practices. Amy’s Kitchen’s organic vegetarian soup line, free from all animal products and USDA Organic–certified, expanded shelf presence in Whole Foods and Sprouts in 2024, demonstrating that clean-label vegetarian positioning can command premium pricing.
The strategic challenge for non-vegetarian soup brands lies in differentiation through premium protein sources, such as grass-fed beef, free-range chicken, or sustainably sourced seafood, to justify higher price points and appeal to conscious carnivores. Kettle & Fire’s bone broth, marketed as a collagen-rich wellness product rather than traditional soup, achieved 40% revenue growth in 2024 by targeting keto and paleo consumers prioritizing protein density and gut health. The broader category dynamic shows increasing blurring between segments: vegetarian soups are marketed for functional benefits such as fiber, antioxidants, and satiety, rather than simply as meat-free options, while non-vegetarian soups emphasize provenance and nutrient density to resist commoditization.
By Distribution Channel: Traditional Retail Maintains Scale Advantages
Supermarkets and hypermarkets accounted for 52.58% of the 2025 distribution share, reflecting entrenched shopping habits, promotional intensity, and the tactile reassurance of in-store browsing. However, online retail stores are the fastest-growing channel, with a 2.89% CAGR through 2031, as subscription models, direct-to-consumer brands, and meal-kit integration reshape purchase pathways. Deloitte's 2025 Future of Grocery report found that 38% of U.S. consumers now purchase packaged foods online at least monthly, up from 22% in 2020, driven by time savings, convenience of home delivery, and algorithm-driven personalization that surfaces niche brands. Other distribution channels, including foodservice, vending machines, and direct-to-consumer subscriptions, capture incremental volume but face higher per-unit logistics costs that compress margins.
The key takeaway is that maintaining an omnichannel presence has become essential. Brands that successfully balance visibility across both physical retail and digital platforms are set to outperform those relying on a single route to market. Campbell Soup’s 2024 collaborations with Instacart and Amazon Fresh, offering same-day delivery and online-exclusive product lines, illustrate this adaptive dual-channel approach. That said, online retail brings a new set of challenges: lower switching barriers, real-time price comparisons, and algorithms that reward brands with strong consumer reviews. Emerging players like Kettle & Fire and Tideford Organic are capitalizing on direct-to-consumer channels to sidestep traditional slotting costs and collect valuable consumer data for personalized marketing. Meanwhile, established brands face the dual pressures of protecting retail shelf presence from private labels and managing margin pressures driven by heavy promotions.
By Packaging Format: Pouches Dominate Through Convenience and Sustainability
Pouches captured 48.51% of the 2025 packaging share, driven by their lighter weight, lower material costs, improved shelf appeal, and a consumer perception of modernity compared to legacy cans. Stand-up pouches with resealable zippers enable portion control and refrigerated storage after opening, addressing single-person households and snacking occasions that cans cannot serve without transferring contents. Canned soup, despite legacy perceptions of high sodium and industrial processing, is posting the fastest growth at 2.62% CAGR through 2031 as manufacturers reformulate recipes to meet FDA "healthy" claim thresholds and introduce organic, reduced-sodium variants that rehabilitate the format's reputation. Campbell Soup's 2024 redesign of its iconic red-and-white cans, featuring transparent windows that showcase the contents of the soup, represents a strategic effort to combat negative perceptions and signal the quality of its ingredients.
Other packaging formats, including glass jars, Tetra Pak cartons, and microwaveable bowls, serve niche applications such as premium gifting, foodservice single-serve, and on-the-go consumption. The strategic implication is that packaging choice increasingly functions as a brand signal: pouches connote innovation and convenience, cans suggest value and tradition, and glass jars communicate premium quality and giftability. Brands that align packaging format with target demographics and consumption occasions will optimize shelf velocity, while those maintaining rigid format portfolios risk losing relevance as consumer preferences fragment. Sustainability considerations are intensifying as well; aluminum cans boast high recycled content and infinite recyclability, while multi-layer pouches face end-of-life challenges that may trigger regulatory restrictions in Europe and California as per the European Commission.
Geography Analysis
Europe accounted for 36.42% of the global soup market in 2025, remaining the largest regional segment due to the deep-rooted traditions of soup consumption in Germany, the United Kingdom, France, and Italy, where soups are often part of daily meals rather than occasional convenience options. Germany favors hearty lentil and potato varieties, the UK prefers tomato and chicken-based soups, and France emphasizes bisques and consommés, creating diverse flavor profiles that support strong regional brand loyalty. Growth in these mature markets is moderating, however, as private-label penetration intensifies; discount chains such as Aldi and Lidl captured 45% of German soup sales in 2024, compressing branded margins and driving innovation toward premium, organic, and chilled formats. EU food safety regulations, including EFSA guidelines on additives and allergen labeling, add compliance costs but also act as entry barriers, protecting established brands from low-cost imports.
The Asia-Pacific region is the fastest-growing, expanding at a 3.14% CAGR through 2031, driven by urbanization, rising disposable incomes, and the increasing adoption of packaged meal solutions in markets traditionally dominated by home-cooked broths. In China, younger consumers in tier-1 and tier-2 cities prioritize convenience over traditional preparation, allowing brands like Tingyi and Uni-President to capture market share with spicy and numbing flavor profiles. India's soup market is emerging rapidly, with Nestlé Maggi expanding into soup mixes in 2024, leveraging its brand equity and distribution network. Japan’s aging population drives demand for nutrient-dense, easy-to-consume formats such as miso- and collagen-based soups, while Australia’s multicultural consumers favor ethnic flavors and premium organic products.
North America, South America, and the Middle East & Africa collectively hold the remaining market share, with North America growing steadily via chilled and bone broth innovations, while South America and MEA remain price-sensitive, favoring dry mixes and shelf-stable value formats. Urban centers in South Africa and Nigeria present opportunities as cold-chain and retail infrastructure develop, though rural penetration remains constrained by affordability and traditional consumption habits.

Competitive Landscape
The European and global soup market exhibits moderate concentration, with the top five players, General Mills, Kraft Heinz, Campbell Soup, Nestlé, and Unilever, holding significant but non-monopolistic shares. This structure leaves room for regional specialists, organic brands, and direct-to-consumer disruptors to capture niche segments. Strategic activity reveals a bifurcation: incumbents defend volume through value packs, promotions, and shelf-stable efficiency, while simultaneously investing in premium, better-for-you portfolios that command higher margins and appeal to younger, health-conscious consumers. Campbell Soup’s USD 2.33 billion acquisition of Sovos Brands in 2024, which included the addition of Rao’s premium pasta sauces and Michael Angelo’s frozen entrees, illustrates this pivot toward quality over quantity and acknowledges the structural headwinds facing traditional condensed soups[4]Source: Campbell Soup Company, “Campbell Completes Acquisition of Sovos Brands,” campbellsoupcompany.com.
White-space opportunities exist in functional soups targeting gut health, immunity, or post-workout recovery, as well as in ethnic flavor profiles catering to multicultural households underserved by mainstream offerings. Emerging disruptors are leveraging e-commerce, clean-label formulations, and subscription models to bypass traditional distribution channels and establish direct customer relationships. For example, Kettle & Fire’s bone broth, positioned as a collagen-rich wellness product rather than a traditional soup, surpassed USD 100 million in annual revenue by 2024 via Amazon, direct-to-consumer subscriptions, and partnerships with Whole Foods and Target.
Technology adoption is accelerating across the sector: Unilever’s deployment of AI-driven demand forecasting and dynamic pricing in 2025 reduced out-of-stock incidents by 18% and improved promotional ROI, highlighting how digital capabilities are becoming competitive differentiators beyond product formulation. Regulatory compliance also functions as a competitive moat; updated FDA guidelines on “healthy” claims and front-of-package labeling favor brands with robust R&D and regulatory teams, while smaller entrants face higher per-unit compliance costs that constrain margin expansion.
Soup Industry Leaders
-
General Mills Inc.
-
The Kraft Heinz Company
-
The Campbell Soup Company
-
Nestlé S.A
-
Unilever Plc
- *Disclaimer: Major Players sorted in no particular order

Recent Industry Developments
- April 2025: The creative shop AIN’T launched DOZZ, the first soup in a can on the market, produced by FoodVision and available in nine preservative-free varieties like tomato, broccoli, and gazpacho, among others targeting busy consumers seeking healthy, on-the-go meals.
- March 2025: Golden Acre Foods launched two new Elsinore canned seafood soups such as Mediterranean Style Seafood and Fish Chowder, into Waitrose and Ocado, aiming to deliver everyday luxury and rival the dining-out experience for time-poor consumers seeking convenience without sacrificing taste or quality.
- March 2025: Hikari Miso launched a new “Shichimi Miso Soup” in collaboration with Yawataya Isogoro, featuring both a 4-serving pack and a convenient cup format, available across Japan. According to the brand, this spicy miso soup combines smooth Shinshu white miso with Yawataya Isogoro’s premium shichimi seasoning, renowned for its aromatic blend and ginger-driven heat, and includes simple ingredients like fried tofu, wakame seaweed, and green onions for a balanced flavor.
- January 2025: Natural Grocers introduced six new organic soup varieties, including Organic Butternut Squash Soup, Organic Creamy Tomato Soup, Organic Sauerkraut Soup, Organic Sweet Corn Soup, Organic Three Lentil Soup, and Organic Vegan Chili Bean Soup. According to the brand, all varieties are certified organic, non-GMO, and made with plant-based, gluten- and dairy-free ingredients. They are packaged in BPA-free, 14-ounce pouches.


Research Methodology Framework and Report Scope
Market Definitions and Key Coverage
Our study treats the global soup market as the aggregate retail value of packaged dry, shelf-stable, chilled, frozen, UHT, and ready-to-eat wet soups that move through off-trade and e-commerce channels. These are products where water or broth forms the main base and which are intended for direct human consumption after minimal heating or dilution.
Scope exclusion: freshly prepared food-service soups and meal-kit broths sold in restaurants or cafeterias are outside this analysis.
Segmentation Overview
-
By Product Type
- Dry Soup
- Shelf Stable Soup
- Chilled Soup
- Frozen Soup
-
By Category
- Vegetarian Soup
- Non-Vegetarian Soup
-
By Packaging Format
- Canned
- Pouches
- Other Packaging Format
-
By Distribution Channel
- Supermarkets/Hypermarkets
- Convenience/Grocery Stores
- Online Retail Stores
- Other Distribution Channels
-
By Geography
-
North America
- United States
- Canada
- Mexico
- Rest of North America
-
Europe
- Germany
- United Kingdom
- Italy
- France
- Spain
- Netherlands
- Poland
- Belgium
- Sweden
- Rest of Europe
-
Asia-Pacific
- China
- India
- Japan
- Australia
- Indonesia
- South Korea
- Thailand
- Singapore
- Rest of Asia-Pacific
-
South America
- Brazil
- Argentina
- Colombia
- Chile
- Peru
- Rest of South America
-
Middle East and Africa
- South Africa
- Saudi Arabia
- United Arab Emirates
- Nigeria
- Egypt
- Morocco
- Turkey
- Rest of Middle East and Africa
-
North America
Detailed Research Methodology and Data Validation
Primary Research
Mordor analysts interviewed packaged-food executives, regional distributors, contract manufacturers, dietitians, and large grocery buyers across North America, Europe, and Asia-Pacific. These conversations validated trade-flow anomalies, gauged promotional lift during winter peaks, and clarified retail pricing tiers that our desk work could only approximate.
Desk Research
We began by mapping publicly available trade and nutrition codes that capture soup shipments in key producing nations, drawing on resources such as UN Comtrade, Eurostat Comext, the USDA Foreign Agricultural Service, and the UK Food Standards Agency. Company filings, 10-Ks, and investor decks helped us track average selling prices and launch pipelines, while industry portals such as the Food & Drink Federation and Japan Frozen Food Association clarified category seasonality. Subscription databases, such as Dow Jones Factiva for deal news and D&B Hoovers for brand-level revenues, supplied supplemental datapoints on market shares.
These datasets were cross-referenced with national household expenditure surveys and patent analytics (Questel) to spot adoption inflection points for low-sodium and plant-based variants. The sources listed illustrate our approach; numerous additional publications supported data checks and narrative context.
Market-Sizing & Forecasting
We anchor the 2024 base using a top-down reconciliation of production, import-export balances, and retail sell-out values, then corroborate totals with sampled supplier roll-ups (bottom-up once). Key variables feeding the model include per-capita cold-season consumption days, penetration of plant-based SKUs, supermarket private-label share, sodium-reduction legislation timelines, and average pack size shifts toward pouches. A multivariate regression, stress-tested through scenario analysis, projects these drivers to 2030, while gap-filled segments (e.g., emerging e-commerce in Southeast Asia) adopt conservative interpolation guided by expert interviews.
Data Validation & Update Cycle
Outputs pass variance checks against historical price-volume elasticities. Senior reviewers challenge outliers, and we re-contact sources if deviations exceed preset thresholds. The report refreshes annually; material events such as major recalls trigger interim revisions so clients always receive the latest view.
Why Mordor's Soup Market Baseline Stands Firm
Published figures often diverge because firms slice the category differently, start from dissimilar years, or lock in untested assumptions. Our disciplined scope, yearly refresh, and dual validation mean decision-makers can rely on a figure that mirrors real shelf dynamics.
Key gap drivers include: some studies cap coverage at canned and dried formats, others project pre-pandemic trends forward without correcting for shifting at-home meal occasions, and a few upscale volume using average kilogram pricing that overlooks premium single-serve cups.
Benchmark comparison
| Market Size | Anonymized source | Primary gap driver |
|---|---|---|
| USD 17.70 B (2025) | Mordor Intelligence | |
| USD 19.05 B (2023) | Global Consultancy A | Canned & dried focus and narrow retailer panel extrapolation |
| USD 16.12 B (2019) | Industry Journal B | Older base year and uniform CAGR applied post-COVID |
| USD 11.28 B (2023) | Research Boutique C | Excludes chilled/frozen formats and mismatched price-volume assumptions |
Taken together, the comparison shows that Mordor Intelligence delivers a balanced, transparent baseline rooted in current retail realities, giving stakeholders a dependable starting point for strategic planning.


Key Questions Answered in the Report
How large is the global soup market in 2026?
The soup market size is USD 17.99 billion in 2026, and it is set to grow steadily through 2031.
Which product format is growing the fastest?
Chilled soup posts the highest CAGR at 1.88% because it marries fresh taste with grab-and-go convenience.
Why are pouches overtaking cans?
Pouches weigh less, reseal easily, and signal modernity, while advances in mono-material films address recycling concerns.
Which region adds the most incremental demand?
Asia-Pacific leads growth at a 3.14% CAGR as urban consumers adopt ready-to-eat solutions that fit tight schedules.
What health trend shapes new product launches?
Lower sodium and clean-label plant-based recipes dominate reformulation to meet FDA “healthy” criteria and consumer scrutiny.
Page last updated on:


