
Functional Food Market Size and Share
Market Overview
| Study Period | 2021 - 2031 |
|---|---|
| Market Size (2026) | USD 188.69 Billion |
| Market Size (2031) | USD 216.31 Billion |
| Growth Rate (2026 - 2031) | 2.77 % |
| Fastest Growing Market | South America |
| Largest Market | Asia-Pacific |
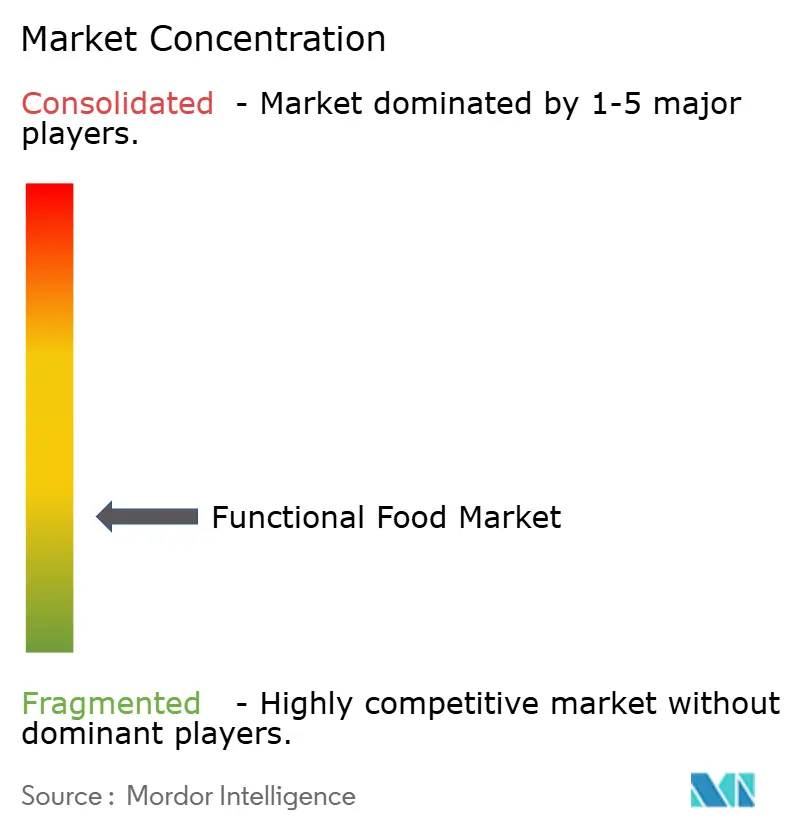
| Market Concentration | Low |
Major Players
*Disclaimer: Major Players sorted in no particular order Image © Mordor Intelligence. Reuse requires attribution under CC BY 4.0. |
|
Functional Food Market Analysis by Mordor Intelligence
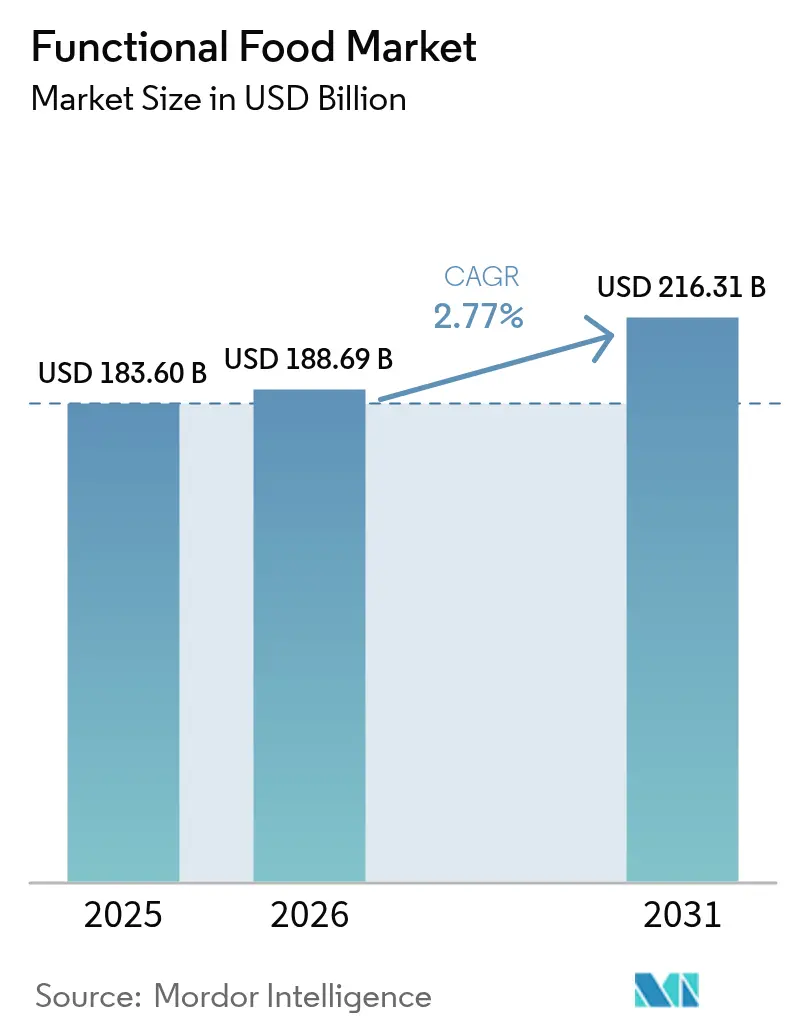
The functional food market size was valued at USD 183.6 billion in 2025 and estimated to grow from USD 188.69 billion in 2026 to reach USD 216.31 billion by 2031, at a CAGR of 2.77% during the forecast period (2026-2031). Regulatory frameworks, scientific validation, and standardized labeling requirements have integrated functional foods into mainstream retail channels, prompting traditional food manufacturers to expand their portfolios with fortified variants. These products incorporate enhanced vitamins, minerals, probiotics, and bioactive compounds that deliver specific health benefits beyond basic nutrition. Consumers now evaluate functional attributes alongside traditional factors like price, taste, and convenience, reflecting their improved understanding of the relationship between nutrient content and health outcomes. This behavioral shift has influenced purchasing patterns across dairy, beverages, cereals, and snack food categories. Regulatory authorities have implemented comprehensive standards for health claims and ingredient usage, which while increasing product development costs, protect compliant companies through evidence-based documentation requirements. These regulations specify protocols for clinical trials, safety assessments, and functional claim verification. The market's growth is supported by integrated retail channels that provide consumer education through interactive displays, mobile applications, and in-store nutritionists, while e-commerce platforms effectively serve younger consumers who value ingredient transparency and detailed product information.
Key Report Takeaways
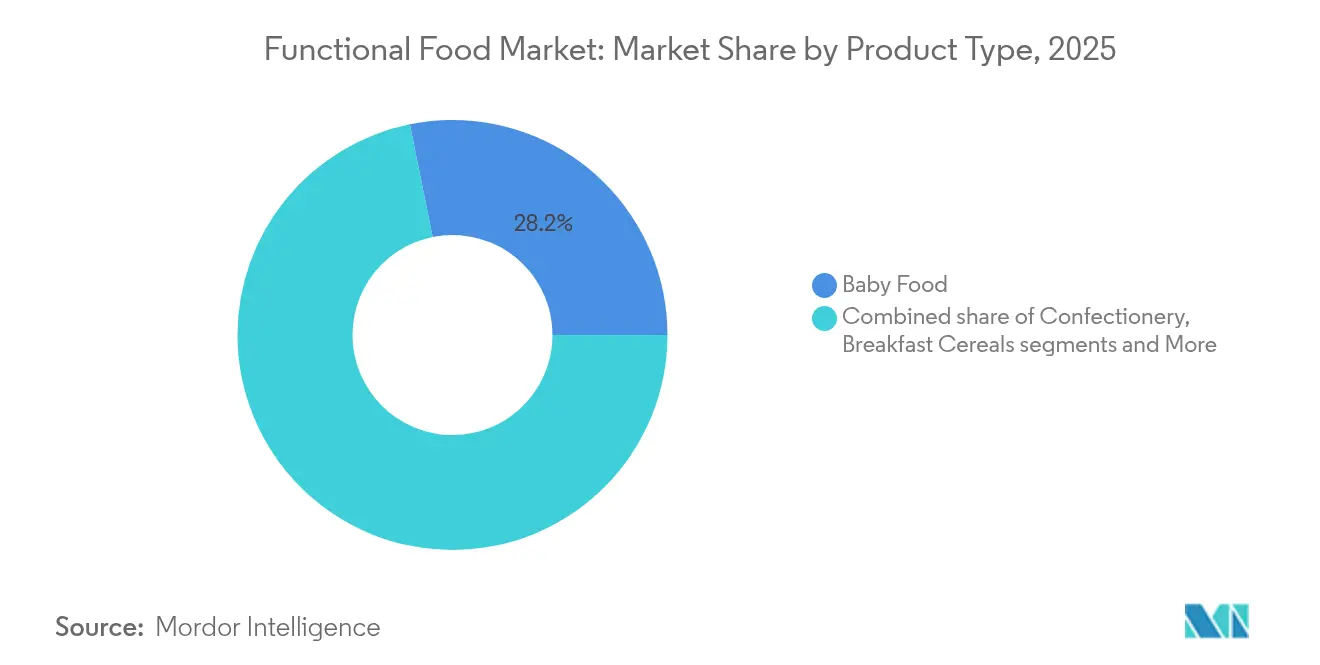
- By product type, baby food led with 28.18% functional food market share in 2025, while dairy alternative products are advancing at a 4.18% CAGR through 2031.
- By category, conventional items accounted for 81.90% of the functional food market size in 2025, whereas the organic tier is expanding at a 6.77% CAGR.
- By distribution channel, supermarkets and hypermarkets held 57.74% of the functional food market in 2025, but online retail stores are growing fastest at 5.86% CAGR.
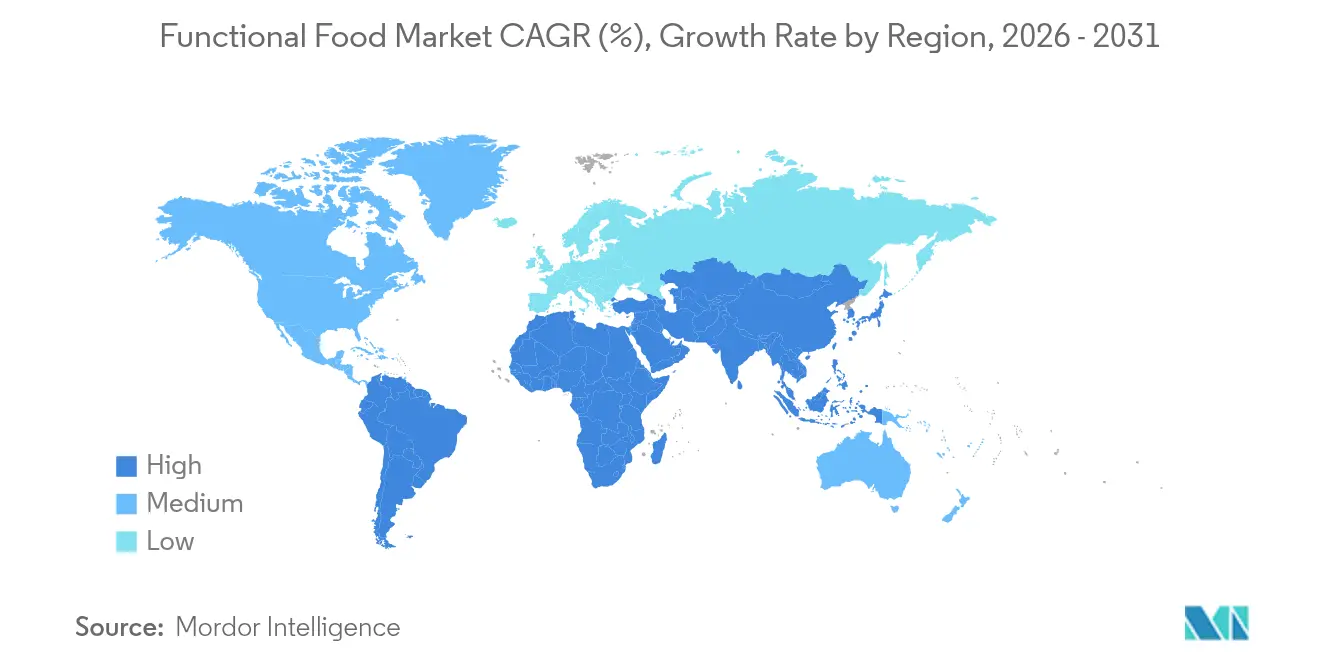
- By geography, Asia-Pacific represented 50.12% of the functional food market in 2025, whereas South America is projected to climb at a 4.76% CAGR through 2031.
Note: Market size and forecast figures in this report are generated using Mordor Intelligence’s proprietary estimation framework, updated with the latest available data and insights as of 2026.
Market Trends and Insights
Drivers Impact Analysis of Functional Food Market*
| DRIVER | (~) % IMPACT ON CAGR FORECAST | GEOGRAPHIC RELEVANCE | IMPACT TIMELINE |
|---|---|---|---|
| Rising health-conscious consumer base | +0.8% | Global, with strongest impact in North America and Europe | Medium term (2-4 years) |
| Growth of preventive healthcare and self-care trends | +0.6% | Asia-Pacific core, spill-over to Middle East and Africa | Long term (≥ 4 years) |
| Rapid population ageing and lifestyle disease burden | +0.5% | Global, concentrated in developed markets | Long term (≥ 4 years) |
| Innovation in ingredients and fortification technologies | +0.4% | North America and Europe, expanding to Asia-Pacific | Medium term (2-4 years) |
| Rise of sports nutrition and active lifestyle products | +0.3% | Global, led by North America | Short term (≤ 2 years) |
| Boom in clean-label and natural functional products | +0.3% | Global, strongest in premium markets | Medium term (2-4 years) |
| Source: Mordor Intelligence | |||


Rising health-conscious consumer base
Consumer health awareness has evolved significantly from basic nutritional knowledge to a comprehensive understanding of functional ingredients and their targeted health benefits. This fundamental shift has transformed purchasing patterns, with consumers actively seeking products that deliver measurable health outcomes rather than just avoiding harmful ingredients. According to the International Food Information Council's Food and Health Survey 2024, approximately 67% of Americans consider healthfulness very important in their food and beverage purchase decisions[1]Source: The International Food Information Council, "2024 IFIC Food & Health Survey,"ific.org.The widespread influence of social media platforms and increased access to detailed nutritional information have substantially strengthened this trend, generating significant demand for scientifically validated functional foods. Digital health platforms and wearable devices enhance this evolution by providing consumers with comprehensive real-time feedback on their nutritional choices, dietary patterns, and detailed health indicators. This intensified health-focused consumer behavior has created substantial economic effects throughout the food and beverage industry, as consumers consistently demonstrate a strong willingness to pay premium prices for products that effectively address their specific health and wellness objectives, driving sustained market growth and continuous product innovation.
Growth of preventive healthcare and self-care trends
Preventive healthcare adoption drives functional food demand as consumers increasingly view nutrition as a fundamental defense against chronic diseases, including cardiovascular conditions, diabetes, and obesity. The global transition to preventive care models, especially in aging populations, establishes functional foods as cost-effective alternatives to pharmaceutical interventions, reducing long-term healthcare expenses. Healthcare systems recognize the economic advantages of nutrition-based disease prevention, with select insurance providers now covering functional food purchases for specific health conditions, particularly those related to metabolic disorders and nutritional deficiencies. Consumer focus on immune health continues to drive demand for immunity-supporting functional ingredients, including vitamin D, zinc, probiotics, and emerging bioactive compounds. The International Food Information Council's Food and Health Survey 2024 indicates that 27% of Americans sought immune function benefits from food and beverages in 2024, reflecting a growing awareness of nutrition's role in immune system support[2]Source: The International Food Information Council, "2024 IFIC Food & Health Survey,"ific.org. The self-care movement extends beyond physical health into mental wellness, creating market opportunities for functional foods that target stress reduction, cognitive function, and mood regulation through validated ingredients such as omega-3 fatty acids, adaptogenic herbs, and bioactive peptides.
Rapid population ageing and lifestyle disease burden
Demographic shifts drive demand for functional foods as aging populations require specialized nutrition for health maintenance and overall well-being. According to World Bank data, approximately 22% of the European Union's population was aged 65 and above in 2023, while Japan's elderly population (65 and above) reached 30%[3]Source: World Bank, "Population ages 65 and above (% of total population)," data.worldbank.org. This aging demographic creates significant demand for foods that address age-related health concerns, including bone density maintenance, cognitive function enhancement, memory improvement, and comprehensive cardiovascular wellness. The prevalence of lifestyle diseases, such as type 1 and type 2 diabetes, obesity, hypertension, and cardiovascular conditions, increases functional food adoption across age groups, particularly for products managing blood sugar levels, cholesterol regulation, and chronic inflammation. The substantial financial impact of these diseases encourages individual consumers and healthcare systems to invest in preventive nutrition solutions and dietary interventions. Functional foods for older adults need to address specific challenges such as reduced sensory perception, diminished taste sensitivity, swallowing difficulties, and medication interactions. These requirements create opportunities for specialized product development. The combination of aging populations and urbanization drives demand for convenient, nutrient-dense functional foods that support modern lifestyles while meeting age-related nutritional needs.
Innovation in ingredients and fortification technologies
Technological advances in ingredient extraction, stabilization, and delivery systems enable the development of more effective functional foods. Precision fermentation technology allows the production of bioactive compounds, including human milk oligosaccharides (HMOs) and specific proteins, which were previously difficult or expensive to obtain. Microencapsulation techniques improve the stability and bioavailability of sensitive nutrients, enabling their incorporation into various food products without affecting taste or shelf life. Nanotechnology applications enhance nutrient absorption and enable targeted delivery to specific body systems. Advanced analytical methods facilitate better characterization of bioactive compounds and their health effects, supporting health claims and regulatory approvals. The development of plant-based alternatives to animal-derived functional ingredients addresses sustainability concerns and dietary restrictions, expanding market accessibility. For instance, in December 2024, Moving Mountains, a British alternative meat company, introduced a new 'Superfood' range in response to consumer demand for nutrient-rich, functional plant-based foods. The soy-free and gluten-free product range includes burgers, sausages, crispy dippers, crispy burgers, and falafel, incorporating ingredients such as chia seeds, quinoa, chickpeas, green peas, and mushrooms.
Restraints Impact Analysis of Functional Food Market*
| RESTRAINT | (~) % IMPACT ON CAGR FORECAST | GEOGRAPHIC RELEVANCE | IMPACT TIMELINE |
|---|---|---|---|
| Stringent regulatory and labeling requirements | -0.4% | Global, most restrictive in Europe and North America | Medium term (2-4 years) |
| Taste and texture challenges | -0.3% | Global, particularly in emerging markets | Short term (≤ 2 years) |
| Skepticism about health claims | -0.2% | Developed markets with educated consumers | Long term (≥ 4 years) |
| High cost of functional products | -0.3% | Price-sensitive markets, emerging economies | Medium term (2-4 years) |
| Source: Mordor Intelligence | |||
Stringent regulatory and labeling requirements
The complex regulatory environment creates significant barriers to market entry and product innovation, especially for smaller companies without regulatory expertise and resources. The FDA's restructured Human Foods Program in 2024 implements extensive compliance requirements for functional food manufacturers, including comprehensive hazard analysis protocols, detailed documentation procedures, and stricter health claim oversight. Companies must develop different formulations and labeling strategies for various markets due to regulatory harmonization challenges, which substantially increase development costs and extend time-to-market. The need for extensive clinical evidence to support health claims poses significant financial challenges, particularly for new ingredients without established safety profiles, requiring multiple rounds of testing and validation. Regulatory uncertainties around emerging technologies, such as precision fermentation and novel processing methods, delay product launches and investment decisions, impacting both research and development timelines and market strategies. Companies that effectively manage regulatory requirements gain competitive advantages through scientifically validated health claims and enhanced consumer trust, leading to market consolidation opportunities for companies with sufficient resources and established compliance frameworks.
High cost of functional products
The high prices of functional foods limit market penetration in price-sensitive consumer segments and emerging markets, constraining overall market growth potential. Manufacturing costs exceed those of conventional alternatives due to specialized extraction processes, strict quality control requirements, advanced processing technologies, and lower production volumes. Companies must set higher retail prices to recover substantial investments in research and development, including health claim validation, clinical trials, safety assessments, bioavailability studies, and regulatory approvals. The complex supply chains for specialized functional ingredients increase procurement costs and inventory risks, particularly for companies dependent on single-source suppliers, ingredients with limited availability, or those requiring specific storage conditions. In affluent markets, consumers' willingness to pay more for proven health benefits supports value-based pricing strategies, driven by health-conscious decisions, preventive healthcare trends, and increased awareness of nutrition-related diseases. This pricing structure results in a segmented market where premium functional foods succeed in developed regions but face adoption barriers in cost-sensitive markets, creating varied growth rates across geographical regions.
*Our forecasts treat driver/restraint impacts as directional, not additive. The impact forecasts reflect baseline growth, mix effects, and variable interactions.
Functional Food Market Segment Analysis
By Product Type:
Baby Food Leads While Dairy Alternatives AccelerateBaby food held 28.18% of the market share in 2025, driven by parents seeking products with proven immunity and cognitive benefits in traditional spoonable formats. Manufacturers place premium products in pharmacy channels and collaborate with pediatricians who advocate for early pre- and postbiotic adoption, ensuring consistent household purchases throughout the two-year infancy period. The category benefits from increased middle-class consumption in Asia-Pacific regions, where urban consumers accept premium pricing for products meeting international quality standards. Dairy alternative products achieved a 4.18% CAGR, expanding in both chilled and ambient segments due to increased lactose intolerance awareness and plant-based preferences. Oat and almond beverages have gained market presence. These trends demonstrate how established companies and new entrants expand the functional food market in their respective segments. The dairy alternatives segment benefits from environmental messaging, attracting flexitarian consumers who connect health benefits with environmental impact.
Confectionery manufacturers incorporate prebiotic fibers in chocolate coatings, successfully combining indulgence with functionality. Snack Bars maintain market relevance by incorporating protein isolates with complex carbohydrates, targeting recreational athletes and professionals who use bars as meal substitutes. The breakfast cereals segment maintains its importance through continuous innovation in whole grain and fortified products. In January 2023, Kellogg introduced Pure Organic Crackers with Cheese and Veggies, providing 10% daily value of vitamin D through mushroom powder fortification. These segments illustrate the varying pace of development in the functional food industry, with rapid innovation occurring in areas with minimal regulatory restrictions and high consumer taste expectations.


By Category:
Conventional Dominance Challenged by Organic GrowthConventional lines held 81.90% of the market in 2025, supported by established distribution networks, competitive pricing, and consistent retail availability. High-volume production enables manufacturers to manage fortification costs effectively, allowing mainstream brands to maintain moderate price differences between functional and standard products. European private-label retailers introduce functional products under their own brands, providing affordable options for budget-conscious consumers.
The organic segment demonstrates robust growth at a 6.77% CAGR, gaining traction among consumers who associate organic farming practices with enhanced health benefits. Consumer advocacy through social media, particularly focusing on ingredient transparency and supply chain traceability, contributes to organic segment growth. Organic manufacturers emphasize small-scale production methods and sustainable farming practices, often featuring farmer profiles on packaging to demonstrate supply chain transparency. Third-party certifications, including USDA Organic and EU Leaf logos, facilitate consumer trust, while digital tools provide access to real-time cultivation data. The segment maintains its price premium through combined value propositions of health benefits and environmental responsibility. Conventional manufacturers respond by implementing sustainable farming practices and sharing pesticide testing results. This market dynamic drives innovation across both segments, maintaining consumer interest in the functional food market.
By Distribution Channel:
Digital Transformation Accelerates Retail EvolutionSupermarkets and hypermarkets dominate with a 57.74% share of the market in 2025. These retailers implement sophisticated product placement strategies through strategic aisle positioning, enabling consumers to make direct comparisons between functional foods and conventional products. They strengthen consumer engagement through comprehensive in-store sampling events led by nutrition professionals and targeted loyalty program promotions that offer personalized discounts. Advanced retail analytics systems, including shelf-scanning technology and consumer behavior tracking, inform detailed product placement decisions to maximize sales performance and consumer conversion rates.
Online retail stores demonstrate significant momentum with a 5.86% CAGR. Their success stems from sophisticated personalized product filtering systems that precisely match consumers with products based on specific health requirements, dietary preferences, and nutritional goals. Direct-to-consumer brands in this channel effectively reduce distribution costs and leverage comprehensive consumer data analytics to optimize product offerings and bundle configurations. The market encompasses several specialized distribution channels: specialist health and wellness retailers maintain stringent product curation standards and supplier verification processes, convenience stores strategically position single-serve options for immediate consumption near fitness facilities, and hybrid retail models integrate seamless digital ordering systems with convenient physical pickup locations. These diverse retail channels necessitate manufacturers to develop sophisticated distribution systems that consistently maintain product quality and temperature control across multiple retail environments.

Geography Analysis
APAC Functional Food Market
Asia-Pacific held 50.12% of the functional food market in 2025, driven by increasing disposable incomes, urbanization, and cultural acceptance of food-as-medicine principles. China's 107 Food Medicine Substances list provides regulatory clarity for traditional botanicals, enabling domestic research and development while facilitating multinational partnerships. Japan's Foods with Health Claims system ensures consumer confidence through regulatory oversight while providing faster market access compared to EU regulations. India's 2025 FSSAI regulations strengthened high-risk product oversight while supporting immunity-enhancing nutraceuticals, attracting international ingredient manufacturers. Regional governments' nutrition-education initiatives promote fortified staples, expanding the functional food consumer base.
South America Functional Food Market
South America shows the highest growth rate at 4.76% CAGR through 2031, supported by Brazil's expanding food processing industry. ANVISA's September 2024 supplement regulations simplified claim approvals, enabling domestic companies to increase research investments. Brazil's clinical research regulations reduced trial approval times from 12 to 6 months, encouraging studies on local bioactive ingredients like acerola vitamin C complexes. Adjacent countries adopt similar regulatory frameworks, creating a regional innovation network that strengthens the functional food market.
North America and EMEA Functional Food Market
North America maintains its premium consumer segment and influences global regulations through the FDA's 2024 "healthy" definition update, which includes nutrient-rich foods such as salmon and avocados in the functional category. Enhanced label requirements reduce legal risks and attract investment in precision-fermented proteins. Europe combines strict EFSA requirements with strong market demand, while retailers use nutritional traffic-light labeling to guide consumer choices. The Middle East and Africa show early market development. These regional variations in market maturity and consumer preferences require companies to adapt their strategies for successful market expansion.

Regulatory Landscape
In the United States, the FDA has continued tightening oversight through its Human Foods Program, with 2026 priority deliverables focused on chemical safety and nutrition labeling. The Unified Agenda workstreams target front-of-package nutrition labeling, alongside a final rule enabling the use of salt substitutes for sodium reduction in standardized foods. These initiatives raise compliance burden for mass-market functional formats where nutrient and structure-function messaging is a key purchase driver.
In the European Union, the central pathway under Regulation (EU) 2015/2283 remains the gatekeeper for novel functional ingredients, with EFSA safety assessment followed by Commission authorization. In 2026, implementing regulations authorized specific novel foods, including inulin-propionate ester and egg membrane hydrolysate, reinforcing the need for dossier-ready evidence packages. In Asia, regimes such as the Republic of Korea MFDS Health Functional Food Code maintain defined standards that require companies to tailor claims and documentation by destination market.
Competitive Landscape
The functional food market remains fragmented, with major players including Danone SA, PepsiCo Inc., Nestle S.A., and The Kellogg Company, among others. Companies are heavily investing in research and development to create novel functional food products and fortified offerings that address evolving consumer health needs. Large companies are actively acquiring emerging brands in high-growth segments, as demonstrated by PepsiCo's USD 1.95 billion acquisition of prebiotic beverage company Poppi in March 2025. These acquisitions indicate that brand value, scientific validation, and consumer loyalty outweigh manufacturing capabilities in determining acquisition targets.
Technology has emerged as a key differentiator in the market. Companies are implementing AI systems to analyze ingredient combinations and predict taste profiles, reducing product development timelines. Advanced fermentation processes enable the production of compounds like lactoferrin and GLP-1 analogues, expanding the range of health benefits previously limited to pharmaceuticals. In June 2025, companies like Lembas introduced natural GLP-1 enhancers. Digital-first companies utilize subscription models, data analytics, and consumer engagement to build strong brands without a traditional retail presence.
While initial product development barriers remain low, scaling operations requires significant investment in clinical studies, distribution infrastructure, and regulatory compliance. Companies are forming partnerships between ingredient manufacturers and consumer brands to share research data and reduce costs. Established companies maintain market positions by investing in emerging brands through minority stakes, minimizing integration risks while maintaining market access. This structure creates a market environment that balances innovation with consolidation, maintaining market accessibility while supporting growth.
Functional Food Industry Leaders
-
Danone SA
-
PepsiCo Inc.
-
Nestlé S.A.
-
Post Holdings Inc
-
The Kellog Company
- *Disclaimer: Major Players sorted in no particular order
Functional Food Market Companies Covered in this Report
- Nestle S.A
- Vitasoy Inetrnational Holdings Ltd
- The Kellog Company
- Post Holdings Inc
- B&G Foods Inc,
- Calbee Inc,
- Dairy Farmers of America
- Glanbia Nutritionals
- Yakult Honsha Co., Ltd.
- Mondelez International Inc.
- Laird Superfood Inc.
- Cocos Organic
- Oatly Group AB
- Nurture Brands
- The Coca-Cola Company
- General Mills Inc.
- Otsuka Holdings
- Suntory Holdings Limited
- Danone S.A
- PepsiCo Inc

Market Opportunities and Future Outlook
Ongoing capacity expansions and processing upgrades support opportunities to offer mainstream functional benefits such as digestive support, protein fortification, and sugar reduction. In Europe, FrieslandCampina Ingredients completed a Borculo facility expansion in March 2026, doubling production capacity for whey protein isolate and milk fat globule membrane and enabling higher-throughput dairy and beverage innovation. In Ireland, Kerry opened an expanded biotechnology manufacturing facility in Carrigaline in January 2026 to increase industrial-scale lactase enzyme production for lactose-free and sugar-reduced dairy reformulations.
Prebiotic fiber positioning and tighter supply chain control are also shaping near-term product development. Ingredion acquired Benicaros, a prebiotic fiber ingredient derived from upcycled carrot pomace, in June 2026, adding an upcycled fiber platform to its portfolio. Huons N completed an expansion at its Geodu Industrial Complex site in Chuncheon, South Korea in July 2026, lifting annual production capacity to 16,500 tons to support larger-volume functional food supply.
Recent Industry Developments in Functional Food Market
- July 2026: Huons N completed expansion at its Geodu Industrial Complex site in Chuncheon, South Korea, lifting total annual production capacity to 16,500 tons. The company move expands regional supply for functional foods and health-nutrition applications, supporting larger-volume ecosystem partnerships.
- June 2026: Ingredion acquired Benicaros, a prebiotic fiber ingredient derived from upcycled carrot pomace, from NutriLeads. The acquisition expands Ingredion's fiber platform and increases control over a differentiated source for gut-health solutions across packaged foods and beverages.
- September 2024: Hain Celestial Group introduced Greek Gods Honey Yogurt and Earth's Best Organic Immune Support Yogurt Smoothie. The products link cultured dairy with immune-support nutrients such as vitamins C and D in toddler-oriented offerings, reinforcing functionality as a key innovation axis in family and pediatric nutrition.


Functional Food Market Report Scope and Research Methodology
Market Definition and Coverage
For this methodology, functional food covers packaged food products that are positioned for added health benefits beyond basic nutrition through fortification, enrichment, or functional ingredients, and that are sold through retail and foodservice channels across major regions.
Scope exclusions: We exclude standalone dietary supplements, pharmaceutical products, and pure ingredient sales that are not sold as finished food items.
Segments Covered in This Report
-
By Product Type
- Baby Food
- Confectionery Products
- Breakfast Cereals
- Beverages
- Dairy Products
- Dairy Alternative Products
- Snack Bars
-
By Category
- Conventional
- Organic
-
By Distribution Channel
- Supermarkets/Hypermarkets
- Specialist Health and Wellness Retailers
- Convenience/Grocery Stores
- Online Retail Stores
- Others
-
By Geography
-
North America
- United States
- Canada
- Mexico
- Rest of North America
-
Europe
- United Kingdom
- Germany
- France
- Italy
- Spain
- Netherlands
- Poland
- Belgium
- Sweden
- Rest of Europe
-
Asia-Pacific
- China
- Japan
- India
- Australia
- Indonesia
- South Korea
- Thailand
- Singapore
- Rest of Asia-Pacific
-
South America
- Brazil
- Argentina
- Colombia
- Chile
- Peru
- Rest of South America
-
Middle East and Africa
- South Africa
- Saudi Arabia
- United Arab Emirates
- Nigeria
- Egypt
- Morocco
- Turkey
- Rest of Middle East and Africa
-
North America
Data Sources, Market Sizing, and Validation
Desk Research
Desk research set the frame for category boundaries, claim types, and regional demand signals before we built the model. We relied on public sources such as FDA and USDA references for labeling and nutrition context, European Commission and EFSA materials for health-claim guidance, and FAO food balance and diet indicators to keep consumption patterns grounded.
To anchor volumes and trade direction, we also reviewed sources such as UN Comtrade and national statistics agencies for household spending and CPI food series, plus selected peer-reviewed nutrition journals to sanity check functional ingredient penetration trends. Company annual reports, investor decks, and reputable business press were used to track portfolio mix shifts and pricing movements. For parts of the value chain where public disclosure is limited, we used paid subscriptions for company financials and intelligence, news and financials, and patent databases to corroborate product launch activity and ingredient focus areas. These examples are not exhaustive, and many other sources were used to collect data, validate assumptions, and clarify open points during research.
Primary Interviews and Surveys
Primary work was used to pressure-test the desk assumptions, especially on what buyers treat as functional food in practice and how retail pricing changes flow through channels. We spoke with packaged food manufacturers, ingredient suppliers, distributors, retailers, and subject matter experts, and we balanced inputs across APAC, EMEA, and the Americas so the global roll-up was not driven by one demand pocket.
Distribution of primary research fieldwork respondents
| Company type | Respondent position | Region |
|---|---|---|
| Top tier: 32% | CXOs: 18% | APAC: 48% |
| Mid tier: 46% | Functional/Unit leaders: 31% | EMEA: 32% |
| Smaller Players: 22% | Managers: 51% | Americas: 20% |
Market-Sizing & Forecasting
Sizing was first constructed using a top-down path where regional food consumption and packaged food spend were reconstructed, then filtered using functional food penetration rates by major food categories. Once the demand pool was formed, average selling price ranges were applied using observed retail price ladders and trade down and trade up behavior, and the totals were then checked against selective bottom-up approximations from sampled company revenue exposure and channel checks.
Key model inputs included regional packaged food expenditure, functional claim penetration by category (such as probiotic, added fiber, vitamin and mineral fortification), mix shifts between dairy, bakery and cereals, snacks, and baby food, and inflation-adjusted price progression that reflects label upgrades and pack size changes. Where bottom-up data was incomplete, gaps were handled by scaling sampled coverage using share of category revenue and distribution reach, followed by a final pass that aligns implied per-capita spend with plausible intake patterns.
For forecasting, scenario analysis was used because demand is shaped by regulation on health claims, pricing pressure, and reformulation cycles that do not move in straight lines. Growth paths were adjusted by region using expert consensus on claim tightening, ingredient cost direction, and retail promotion intensity, which helped keep the outlook realistic year by year.
Data Validation & Update Cycle
Validation was done through several cross-checks that looked for variance by region, category, and pricing level, and then traced the drivers back to the input assumptions. We compared model outputs with independent signals such as packaged food CPI movement, trade values for relevant food categories, and the pace of new functional claim launches seen in public filings and patents, which helped flag outliers.
Before sign off, the work is reviewed in steps, starting with internal peer review of assumptions and then a separate check of the final roll-ups for arithmetic and logic consistency. If a number moved sharply or if a new rule changed claim eligibility, experts were re-contacted to confirm the direction and magnitude. Reports refresh annually, with interim updates for material events, and a fresh pre-delivery pass is performed so clients receive the latest updated view.
Mordor Intelligence's Global Functional Food Market Sizing Compared With Other Published Estimates
Published market numbers for functional food can look far apart because each publisher draws the line differently on what counts as functional, and because pricing and region mix are not treated the same way. Differences also come from the year used as the starting point, currency conversion timing, and whether the estimate follows foods only or also pulls in adjacent categories.
Dietary supplements are kept outside Mordor Intelligence's scope here, which removes a large spend pool that some broader nutrition studies bundle together with functional foods and beverages. Other gaps usually come from whether fortified everyday staples are counted only when a clear functional positioning is present, and from how fast average selling prices are assumed to rise when reformulation and premiumization are happening at the same time.
Benchmark comparison
| Source | Market Size | Gaps in Research Methodology |
|---|---|---|
| Mordor Intelligence | USD 188.69 B (2026) | |
| Trade Publisher A | USD 274.50 B (2025) | Uses a combined functional foods and beverages scope and reflects a higher growth phase ending in 2025, which can lift totals versus a foods focused view and a different cycle year. |
| Industry Bulletin B | USD 364.98 B (2024) | Rolls up functional food and beverage together and often includes wider wellness positioned products, and the earlier base year can also amplify inflation effects if pricing is not normalized consistently. |
When the scope is aligned, the spread tightens quickly, and most of the remaining difference is explained by whether beverages and adjacent wellness items are included and how prices are stepped forward. Our approach stays traceable to a defined demand pool and repeatable checks, which makes the estimate easier to reconcile across regions and time.


Key Questions Answered in the Report
What is the current value of the functional food market?
The functional food market size stands at USD 188.69 billion in 2026 and is projected to hit USD 216.31 billion by 2031 at a 2.77% CAGR.
Which product segment leads the functional food market?
Baby Food is the largest segment, holding 28.18% functional food market share in 2025.
Which distribution channel is growing fastest for functional foods?
Online Retail Stores post the highest growth with a 5.86% CAGR through 2031, propelled by convenience and personalized recommendations.
What region shows the fastest growth in functional food sales?
South America registers the quickest expansion with a 4.76% CAGR, led by Brazil’s supportive regulatory reforms and strong food-processing capacity.
Page last updated on:




