
Packaged Food Market Size and Share
Market Overview
| Study Period | 2021 - 2031 |
|---|---|
| Market Size (2026) | USD 6.61 Trillion |
| Market Size (2031) | USD 8.15 Trillion |
| Growth Rate (2026 - 2031) | 4.28 % |
| Fastest Growing Market | South America |
| Largest Market | Asia Pacific |
| Market Concentration | Low |
Major Players
*Disclaimer: Major Players sorted in no particular order Image © Mordor Intelligence. Reuse requires attribution under CC BY 4.0. |
|
Packaged Food Market Analysis by Mordor Intelligence
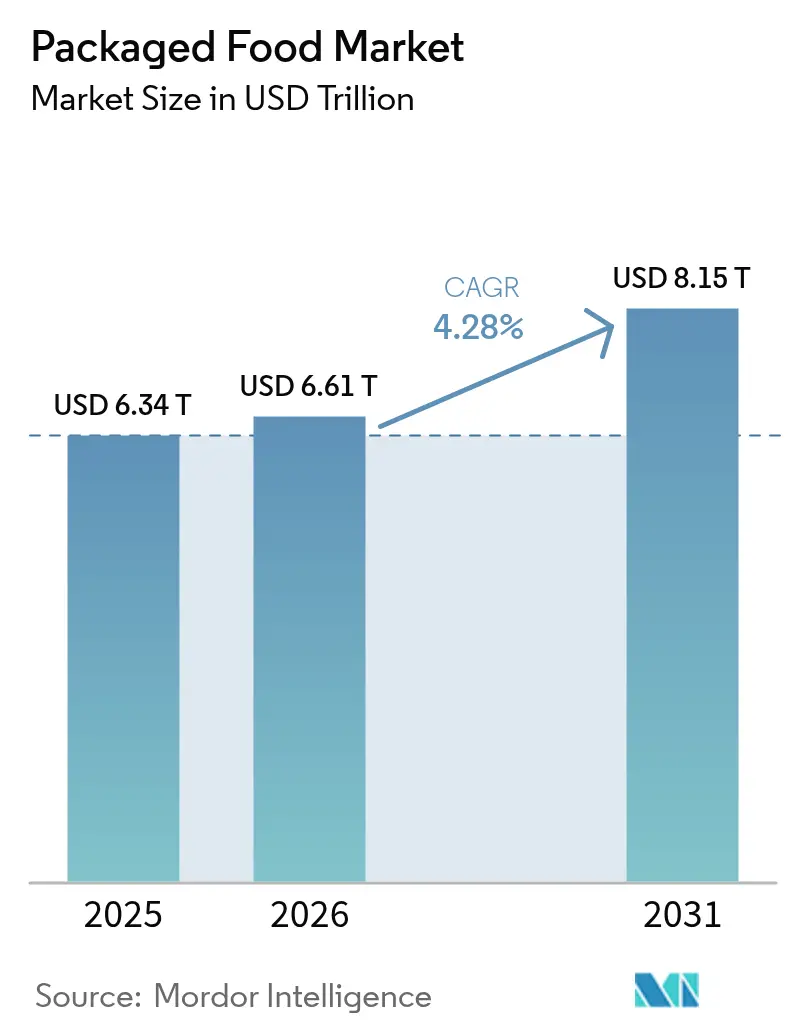
The packaged food market size was valued at USD 6.34 trillion in 2025 and estimated to grow from USD 6.61 trillion in 2026 to reach USD 8.15 trillion by 2031, at a CAGR of 4.28% during the forecast period (2026-2031). Rapid urbanization, rising disposable income in emerging economies, and consumers’ preference for convenient yet nutrient-dense products are redefining category dynamics. Demand is gravitating toward natural, organic, and free-from options, while functional claims such as probiotic, high-protein, and fortified benefits migrate from niche lines into mainstream shelves. Distribution patterns are fragmenting as e-commerce compresses delivery windows below fifteen minutes in dense cities, obliging supermarkets to retrofit micro-fulfillment zones. Meanwhile, sustainability mandates are accelerating material innovation, shifting packaging away from single-use plastics toward fiber-based or enzymatically recyclable substrates, even at a 15-25% cost premium. Competitive intensity in the packaged food market is rising as incumbents prune underperforming SKUs and acquire plant-based specialists to secure relevance with younger cohorts.
Key Report Takeaways
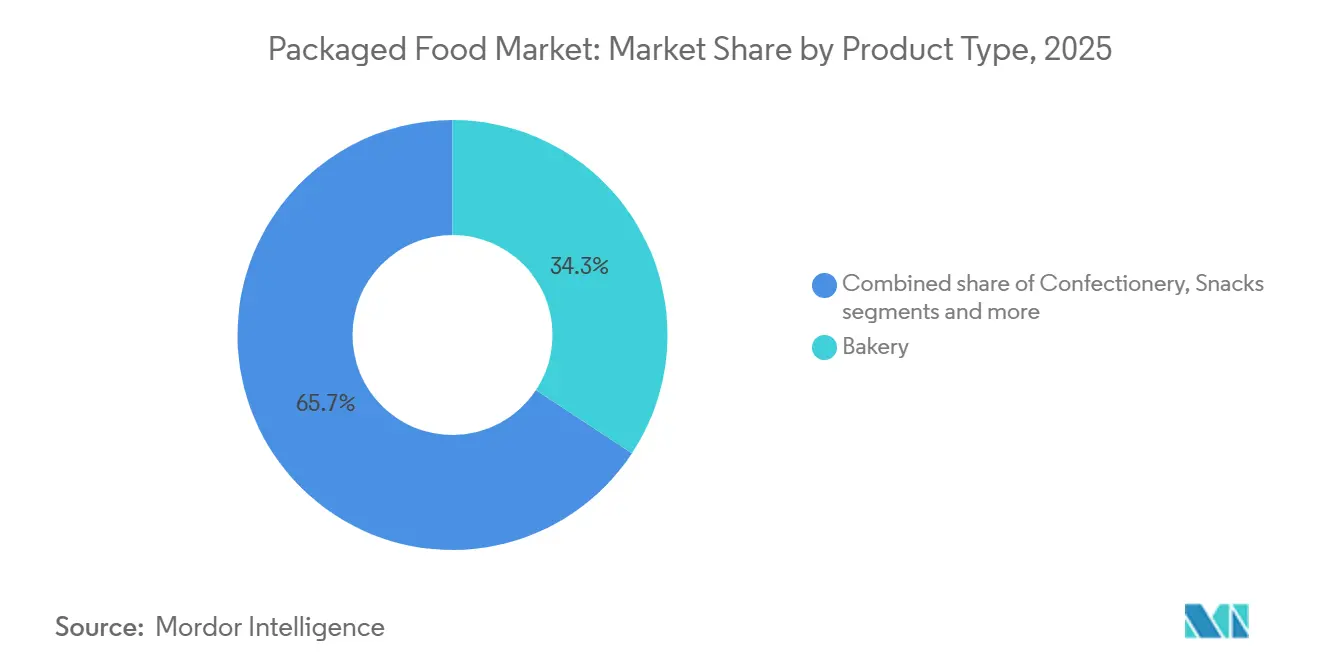
- By prodict type, bakery products led with 34.27% packaged food market share in 2025, whereas dairy and dairy alternatives are projected to grow at a 4.81% CAGR through 2031
- By category, conventional items controlled 76.38% of the packaged food market size in 2025, but the natural, organic, and free-from segment is expected to expand at a 5.43% CAGR to 2031.
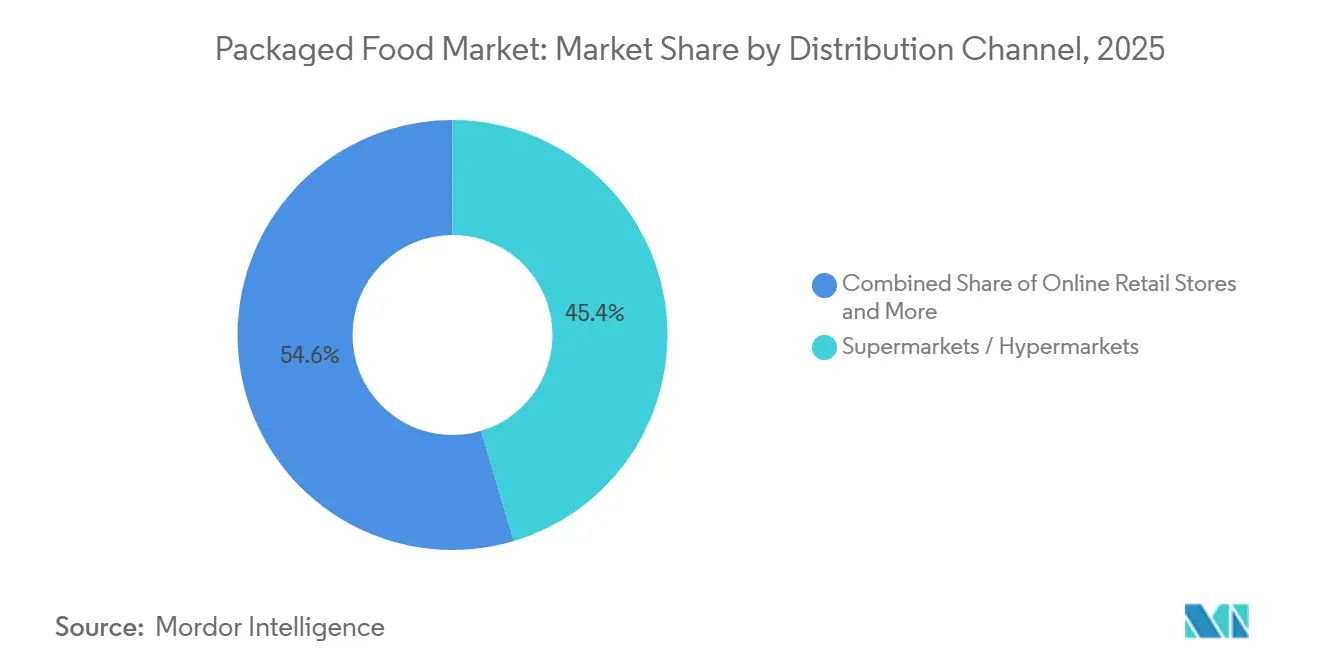
- By distribution channel, supermarkets and hypermarkets captured 45.38% share of the packaged food market in 2025, while online retail is forecast to advance at a 5.57% CAGR during 2026-2031.
- By geography, Asia-Pacific held the largest regional position at 33.67% in 2025, whereas South America is set to deliver the fastest 5.03% CAGR through 2031.
Note: Market size and forecast figures in this report are generated using Mordor Intelligence’s proprietary estimation framework, updated with the latest available data and insights as of 2026.
Global Packaged Food Market Trends and Insights
Drivers Impact Analysis*
| Driver | (~) % Impact on CAGR Forecast | Geographic Relevance | Impact Timeline |
|---|---|---|---|
| Ethnic and global flavor exploration | +0.6% | Global, with concentration in North America, Europe, and urban Asia-Pacific | Medium term (2-4 years) |
| Increasing demand for functional and health-oriented foods | +0.9% | Global, strongest in North America, Europe, and developed Asia-Pacific markets | Long term (≥ 4 years) |
| Innovation in sustainable and recyclable packaging solutions | +0.5% | Europe (PPWR compliance), North America, spreading to Asia-Pacific | Medium term (2-4 years) |
| Rising consumer preference for clean-label and transparent ingredients | +0.7% | North America & Europe core, expanding to urban Asia-Pacific and South America | Medium term (2-4 years) |
| Growing personalization and dietary preference-based product development | +0.4% | North America, Europe, affluent Asia-Pacific urban centers | Long term (≥ 4 years) |
| Product innovation and premiumization across packaged food categories | +0.8% | Global, with premium tier concentration in developed markets | Medium term (2-4 years) |
| Source: Mordor Intelligence | |||
Ethnic and global flavor exploration
Growing consumer interest in ethnic and global flavor exploration is significantly driving innovation and product development in the packaged food market. Increasing cultural exposure through travel, digital media, and multicultural urban populations has encouraged consumers to experiment with international cuisines and diverse taste profiles. Packaged food manufacturers are responding by introducing products inspired by Asian, Latin American, Middle Eastern, and Mediterranean flavors to meet evolving taste preferences. This trend is particularly strong among younger consumers seeking novel and authentic culinary experiences in convenient formats. Limited-edition launches, fusion flavors, and regionally inspired recipes are helping brands differentiate their offerings in competitive retail environments in the packaged food market. Additionally, the rising popularity of ready-to-eat meals and snack products featuring global seasonings supports higher consumer engagement and repeat purchases.
Increasing demand for functional and health-oriented foods
Consumers are driving growth in the packaged food market by prioritizing nutrition and preventive health in their daily diets. Rising awareness of lifestyle-related health issues, such as obesity, diabetes, and digestive concerns, is pushing demand for products with enhanced nutritional benefits. The International Diabetes Federation (IDF) reports that in 2024, 589 million adults aged 20-79 lived with diabetes, with projections reaching 853 million by 2050[1] Source: International Diabetes Federation, "Diabetes around the world in 2024”, idf.org. Manufacturers are introducing fortified foods, high-protein snacks, probiotic items, and products enriched with vitamins, minerals, and fiber. Health-conscious buyers increasingly prefer clean-label formulations, reduced sugar content, and natural ingredients. The International Food Information Council’s Food and Health Survey 2024 shows that 67% of Americans consider healthfulness crucial in food and beverage choices, highlighting wellness trends' strong influence on purchasing behavior[2]Source: The International Food Information Council, "2024 IFIC Food & Health Survey,"ific.org. Interest in immunity-boosting and functional ingredients continues to grow in the packaged food market, driven by a focus on long-term health management.
Rising consumer preference for clean-label and transparent ingredients
Consumers are showing a stronger preference for brands that adopt eco-friendly materials, reduce plastic usage, and promote recyclability or biodegradability in packaging formats. Manufacturers are investing in lightweight packaging, paper-based alternatives, and reusable designs to align with sustainability goals while maintaining product safety and shelf life. Sustainable packaging also enhances brand perception, particularly among environmentally conscious consumers seeking responsible consumption choices. According to the 2024 IFIC Food & Health Survey, foods labeled as “Natural,” “Organic,” or “Healthy” are among the top in-store signals, with 36% of American consumers preferring such attributes, reflecting the broader shift toward transparency and sustainability in food products[3]Source: International Food Information Council, “2024 IFIC Food & Health SURVEY”, ific.org. This preference encourages companies in the packaged food market to integrate sustainable packaging with clean-label positioning to strengthen product appeal. As regulatory pressure and consumer expectations continue to rise, sustainable packaging innovation remains a key strategic focus for packaged food manufacturers.
Innovation in sustainable and recyclable packaging solutions
Innovation in sustainable and recyclable packaging solutions is increasingly supporting growth in the packaged food market as environmental concerns influence consumer purchasing behavior. Food manufacturers are adopting recyclable, biodegradable, and compostable materials to reduce environmental impact while maintaining product safety and shelf stability. The shift toward lightweight packaging and reduced plastic usage also helps companies lower transportation costs and carbon emissions. In addition, sustainable packaging enhances brand value and strengthens consumer trust, particularly among environmentally conscious buyers. Governments and regulatory bodies are further encouraging the adoption of eco-friendly packaging through stricter waste management and recycling regulations. Companies in the packaged food market are also investing in packaging designs that improve recyclability without compromising convenience or product quality.
Restraints Impact Analysis*
| Restraint | (~) % Impact on CAGR Forecast | Geographic Relevance | Impact Timeline |
|---|---|---|---|
| Health concerns related to sugar, salt, and preservatives | -0.5% | Global, with stringent regulations in Europe, North America, and select Asia-Pacific markets | Short term (≤ 2 years) |
| Rising input, labor, energy, and production costs | -0.8% | Global, acute in energy-intensive manufacturing hubs in Europe and North America | Short term (≤ 2 years) |
| Supply chain disruptions and raw material price volatility | -0.6% | Global, with pronounced impact on commodity-dependent segments and emerging markets | Medium term (2-4 years) |
| Stringent regulatory requirements and compliance costs | -0.4% | Europe (EFSA, PPWR), North America (FDA), Asia-Pacific (FSSAI), South America (ANVISA) | Long term (≥ 4 years) |
| Source: Mordor Intelligence | |||
Health concerns related to sugar, salt, and preservatives
Growing health concerns related to high levels of sugar, salt, and preservatives are limiting the growth potential of the packaged food market as consumers become more cautious about ingredient consumption. Increasing awareness of lifestyle-related conditions such as obesity, hypertension, diabetes, and cardiovascular diseases has led consumers to scrutinize nutritional labels more carefully. Many packaged food products are often perceived as highly processed, which can discourage health-conscious consumers from frequent consumption. Regulatory bodies across several countries are also introducing stricter labeling requirements and reformulation guidelines to reduce sodium and sugar content in processed foods. This has increased pressure on manufacturers to reformulate products while maintaining taste, texture, and shelf life, often leading to higher production costs. Additionally, negative consumer perception toward artificial preservatives and additives is encouraging a shift toward fresh or minimally processed alternatives in the packaged food market.
Rising input, labor, energy, and production costs
Rising input, labor, energy, and production costs are posing significant challenges to the packaged food market, impacting profitability and pricing strategies for manufacturers. Fluctuations in the cost of raw materials such as grains, dairy, oils, and sweeteners directly affect production expenses, while increasing labor costs add to operational overheads. Energy-intensive processes, including manufacturing, refrigeration, and transportation, further contribute to higher production costs. These rising expenses often force companies to adjust product pricing, which can affect consumer demand, particularly in price-sensitive segments. Supply chain disruptions and inflationary pressures in key markets exacerbate cost volatility, making long-term planning more challenging for manufacturers. Additionally, smaller and mid-sized producers may face greater difficulty absorbing these costs compared to larger, integrated firms, potentially limiting their market competitiveness.
*Our forecasts treat driver/restraint impacts as directional, not additive. The impact forecasts reflect baseline growth, mix effects, and variable interactions.
Segment Analysis
By Product Type: Dairy Alternatives Disrupt Legacy Categories
Bakery products accounted for the largest share of the packaged food market in 2025, contributing 34.27% of total market revenue, primarily driven by their widespread consumption and strong consumer familiarity across regions. Products such as bread, biscuits, cakes, pastries, and savory baked snacks continue to serve as convenient meal and snacking options for consumers with busy lifestyles. The segment benefits from frequent product innovation, including healthier formulations such as whole grain, high-fiber, and reduced-sugar variants, which help maintain strong demand among health-conscious consumers. In addition, the expansion of organized retail and online grocery platforms has improved product accessibility across the packaged food market and visibility, further strengthening sales performance.
Dairy and dairy alternatives are projected to be the fastest-growing segment in the packaged food market, expected to register a CAGR of 4.81% through 2031. Growth in this segment is largely supported by increasing consumer awareness regarding nutrition, protein intake, and functional health benefits associated with dairy-based products. At the same time, rising lactose intolerance awareness and the growing popularity of plant-based diets have accelerated demand for dairy alternatives such as almond, soy, oat, and coconut-based products. Manufacturers in the packaged food market are actively expanding product portfolios with fortified, low-fat, and probiotic-rich offerings to cater to evolving consumer preferences. The introduction of innovative flavors, convenient packaging formats, and ready-to-consume dairy beverages has further strengthened market expansion.



By Category: Natural and Organic Segments Gain Share
The natural, organic, and free-from category is forecast to grow at 5.43% through 2031, significantly outpacing the conventional segment, which held 76.38% of the market in 2025. This divergence reflects a structural shift in consumer priorities, where ingredient provenance and production methods are becoming primary purchase drivers, particularly among urban millennials and Gen Z cohorts who demonstrate higher willingness to pay for certified organic and non-GMO products. Conventional products remain dominant due to price sensitivity in emerging markets and rural areas, where income constraints limit access to premium-priced alternatives, yet even within this segment, manufacturers are introducing "better-for-you" sub-brands that incorporate whole grains, reduced sodium, and no artificial additives to capture trade-up demand.
Certification standards like USDA Organic, EU Organic, and India Organic are emerging as key differentiators. Retailers are now dedicating premium shelf space to these certified products. Meanwhile, e-commerce platforms are incorporating organic filters, enhancing product visibility. In a notable move, PepsiCo launched an organic snack line under its Frito-Lay brand in 2025. This line, made with non-GMO corn and sunflower oil, raked in USD 120 million in its inaugural year, underscoring the viability of organic positioning even in traditionally commodity-driven sectors. However, the category's expansion faces hurdles. Organic raw materials demand specialized handling and traceability, pushing logistics costs up by 10-15%. This added expense poses challenges, especially for smaller manufacturers looking to enter the market.
By Distribution Channel: E-Commerce Reshapes Retail Economics
Supermarkets and hypermarkets accounted for the largest share of the packaged food market in 2025, representing 45.38% of total sales, primarily due to their extensive product assortment and strong consumer trust. These retail formats offer consumers the advantage of one-stop shopping, allowing them to compare multiple brands, product types, and price ranges within a single location. The availability of promotional offers, bulk purchasing options, and private-label products further strengthens consumer preference for these channels. In addition, well-established supply chains and efficient inventory management enable supermarkets and hypermarkets to maintain consistent product availability, particularly for high-demand packaged food categories.
Online retail is projected to be the fastest-growing distribution channel in the packaged food market, expected to expand at a CAGR of 5.57% during 2026–2031. The increasing adoption of smartphones, improved internet penetration, and the growing popularity of digital payment systems have significantly accelerated online grocery purchases. Consumers are increasingly attracted to the convenience of home delivery, flexible ordering options, and access to a wider range of domestic and international packaged food products. E-commerce platforms in the packaged food market also provide personalized recommendations, subscription-based purchasing models, and competitive pricing, which enhance consumer engagement and loyalty.
Geography Analysis
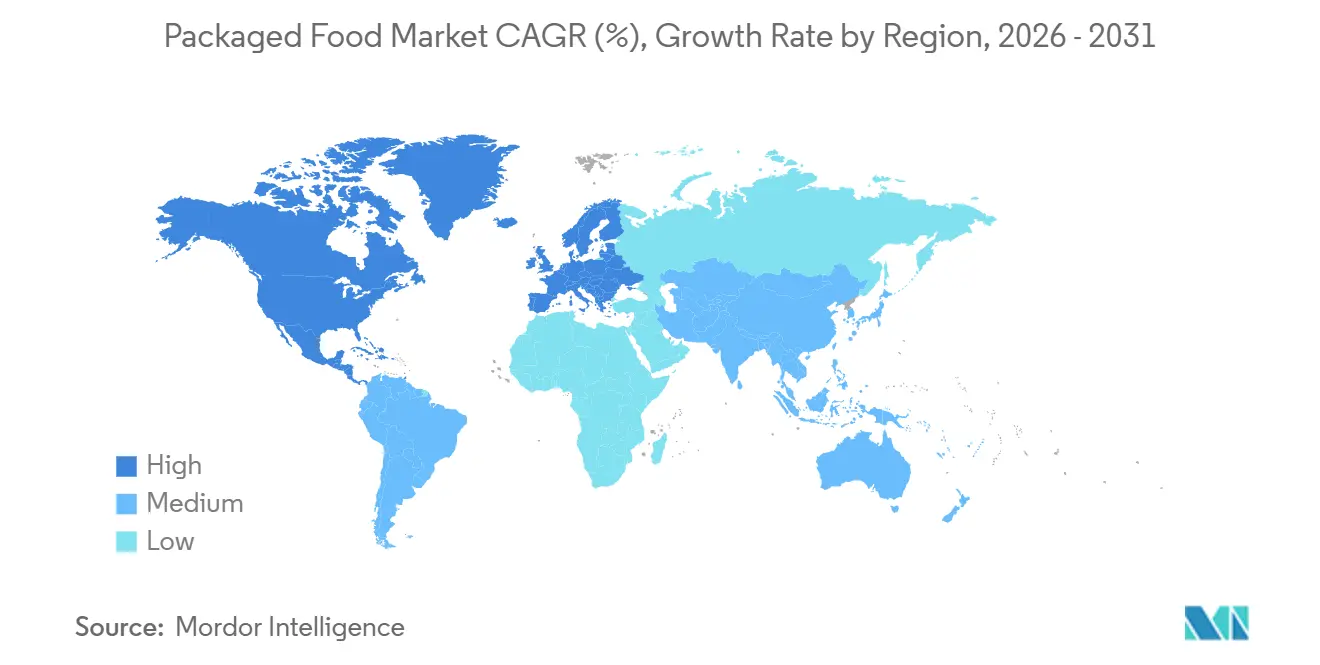
Asia-Pacific accounted for the largest share of the packaged food market in 2025, holding 33.67% of the global market, driven by its large population base, rapid urbanization, and evolving consumer lifestyles. Rising disposable incomes across countries such as China, India, and other key markets are accelerating growth in the packaged food market. Indonesia and Vietnam have accelerated demand for convenient, ready-to-eat, and value-added food products. The expansion of modern retail infrastructure, including supermarkets, hypermarkets, and e-commerce platforms, has further improved product accessibility across urban and semi-urban areas. In addition, changing dietary patterns, increasing participation of women in the workforce, and growing demand for packaged snacks, dairy products, and frozen foods continue to support strong regional consumption.
South America is projected to register the fastest growth rate, with a CAGR of 5.03% through 2031, supported by improving economic stability, rising urban populations, and increasing adoption of packaged and convenience foods. Countries such as Brazil, Argentina, and Chile are witnessing a gradual shift from traditional fresh food consumption toward packaged alternatives due to changing work patterns and time constraints among consumers. The growing presence of international food brands alongside expanding domestic production capabilities has enhanced product availability and variety in the region.
Europe, North America, and the Middle East & Africa collectively represent mature yet evolving markets characterized by strong demand for premium, health-oriented, and sustainably packaged food products. In North America and Europe, consumer preferences are increasingly shaped by clean-label formulations, organic ingredients, and functional foods, driving innovation among established food manufacturers. Meanwhile, the Middle East & Africa region is experiencing gradual growth supported by rising urbanization, expanding retail infrastructure, and increasing reliance on imported packaged foods, particularly in Gulf Cooperation Council (GCC) countries.

Regulatory Landscape
Regulation affecting packaged food is tightening around safety, traceability, additives, and novel foods, with compliance demands varying by region. In the United States, the FDA continues to operationalize FSMA-related traceability requirements, and the Continuing Appropriations, Agriculture, Legislative Branch, Military Construction and Veterans Affairs, and Extensions Act of 2026 directed the FDA not to enforce the Food Traceability Rule before July 20, 2028, effectively extending the implementation runway for lot-level recordkeeping across covered foods.
In Europe, packaged food manufacturers face ongoing changes across pesticides, additives, and novel foods. The European Commission adopted Commission Implementing Regulation (EU) 2026/765 on methods of sampling and analysis for official control of pesticide residues, with application from January 1, 2027, increasing the need for harmonized QC protocols across cross-border supply chains. Separately, the EU novel food framework continues to shape ingredient innovation, including authorizations such as lacto-N-tetraose (Commission Implementing Regulation (EU) 2026/397). In the UK, the Food Standards Agency advanced the Cell-Cultivated Products Sandbox Programme through July 2026 guidance to help novel and cell-cultivated food businesses navigate evidence and safety expectations.
Value Chain Analysis
The packaged food value chain runs from agricultural and commodity inputs (grains, dairy, oils, sugar, cocoa, meat, and specialty ingredients) through primary processing and ingredient manufacturing, packaged food manufacturing (including thermal processing, baking, fermentation, and cold-chain operations), packaging materials conversion, and distribution via wholesalers, modern retail, convenience, and online platforms. Brand owners and co-manufacturers increasingly depend on long-term partnerships to secure manufacturing capacity and route-to-market access. In April 2026, Keurig Dr Pepper extended its strategic partnership with Nestle USA for manufacturing and distribution of Starbucks coffee products across the United States and Canada.
Upstream and midstream resilience is being tested by input volatility and logistics exposure, while sustainability and alternative proteins are reshaping sourcing and production nodes. PepsiCo's May 2026 agreement with Fertiberia to deploy green hydrogen-based fertilizer across 400,000 acres in Europe illustrates how large manufacturers are moving upstream into farm-input decarbonization and traceability-aligned sourcing. In parallel, ingredient supply chains are scaling through precision fermentation, highlighted by July 2026 commercial-scale production of The Every Companys animal-free egg white protein (OvoPro) at ADM's Clinton, Iowa facility, adding a non-animal input stream relevant to bakery, snacks, and ready meal formulations.
Competitive Landscape
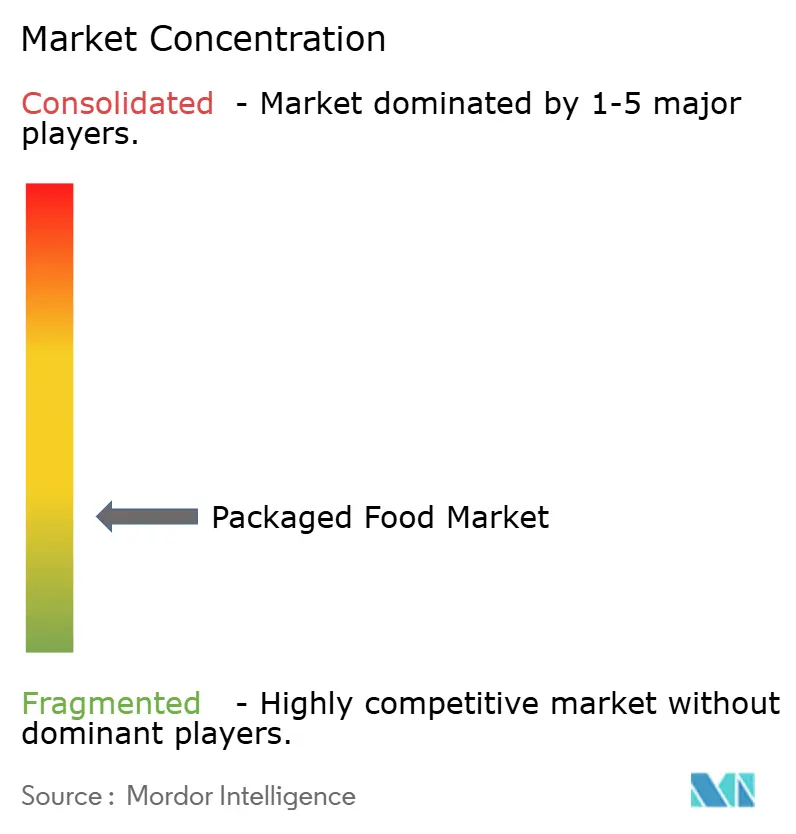
The packaged food market is highly fragmented, with the presence of numerous multinational corporations, regional manufacturers, and private-label brands competing across diverse product categories. Global players such as Nestlé SA, PepsiCo Inc., and Mondelez International maintain strong market positions through extensive product portfolios, strong brand recognition, and well-established distribution networks. However, regional and local manufacturers continue to capture significant market share by offering culturally relevant products, competitive pricing, and localized flavors tailored to regional consumer preferences. The fragmentation of the market encourages continuous innovation, as companies compete through product differentiation, packaging innovation, and value-added offerings to strengthen consumer loyalty and expand their market presence.
Competition in the packaged food market is primarily driven by changing consumer preferences, particularly the growing demand for healthier, clean-label, and functional food products. Leading companies in the packaged food industry are actively investing in research and development to reformulate products with reduced sugar, salt, and artificial additives while maintaining taste and convenience. Mergers, acquisitions, and strategic partnerships are frequently observed as companies seek to expand geographic reach and strengthen supply chain efficiencies. At the same time, private-label brands from large retailers are gaining traction due to competitive pricing and improved quality, intensifying competition for established brands.
The competitive landscape is also shaped by evolving retail channels and technological advancements in distribution and consumer engagement. The rapid growth of e-commerce and omnichannel retailing has enabled both large and small players in the packaged food market to reach wider consumer bases, increasing market accessibility and competition. Sustainability initiatives, including eco-friendly packaging and responsible sourcing, are becoming important differentiators among the packaged food industry participants. While major multinational companies continue to dominate in terms of revenue, the strong presence of regional and niche players ensures that the market remains highly competitive and innovation-driven.
Packaged Food Industry Leaders
-
PepsiCo, Inc.
-
The Coca-Cola Company
-
General Mills Inc.
-
Mondelez International
-
Nestlé SA
- *Disclaimer: Major Players sorted in no particular order

Market Opportunities and Future Outlook
Opportunities in packaged food are expanding where manufacturers can align health-forward formulations with scalable operations, particularly across functional nutrition, protein fortification, and clean-label positioning. Recent product and portfolio moves reinforce this whitespace: PepsiCo launched Propel Clear Protein in May 2026, and General Mills introduced LARABAR Protein in May 2026, both reflecting continued mainstreaming of high-protein and better-for-you propositions across mass retail and e-commerce. This supports innovation in reformulation, ingredient systems (including probiotics, fiber, and plant-based proteins), and packaging formats designed to protect shelf life while meeting sustainability requirements.
Manufacturing and logistics investment is also creating room for capacity-led growth through automation and data-driven quality control, especially as e-commerce and rapid delivery compress replenishment cycles. In Asia-Pacific, Suntory PepsiCo Vietnam inaugurated a USD 300 million manufacturing plant in Tay Ninh Province in July 2026 with a fully automated warehouse, and Nestle (Thai) Co., Ltd. received approval in July 2026 for a USD 688 million AI-enabled smart factory and distribution center in Samut Prakan. In North America, expansion projects such as Chobanis March 2026 groundbreaking for a USD 567 million La Colombe facility expansion in Michigan and Reyes Coca-Cola Bottlings USD 650 million bottling and distribution build in California (under construction as of June 2026) point to continued opportunity around high-throughput plants, upgraded cold-chain and distribution footprints, and productivity-focused capex under labor constraints and stricter food safety oversight.
Recent Industry Developments
- July 2026: The Coca-Cola Company entered into a global strategic beverage agreement with Marriott International to supply beverages across its hotel portfolio. The move strengthens Coca-Colas away-from-home channel reach and creates a large, standardized placement base that can accelerate new product introductions across geographies.
- June 2026: PepsiCo announced a multi-year partnership with Gatik to deploy autonomous freight across its North America supply chain. This increases distribution flexibility for packaged foods and beverages by targeting transportation efficiency, service levels, and resilience amid tight labor and delivery-window compression.
- July 2025: Campco unveiled three new chocolate offerings at its head office in Mangaluru, including Dark Delight dark chocolate, Dome Delight premium truffles, and orange-flavoured Campco Eclairs. The launches highlight continued premiumization and flavor innovation in confectionery as brands compete for share through differentiated formats and taste profiles.


Research Methodology Framework and Report Scope
Market Definition and Coverage
For this methodology, the packaged food market covers commercially produced food products sold in sealed or labeled packaging for household consumption, where packaging supports preservation, handling, and shelf life. Value is counted at the point of sale into retail and foodservice channels.
Scope exclusions: We exclude unpackaged fresh foods sold loose, and we also exclude home-prepared meals where no branded packaged product is purchased.
Segmentation Overview
-
By Product Type
- Dairy and Dairy Alternatives
- Confectionery
- Bakery
- Snacks
- Meat, Poultry & Seafood and Substitutes
- Breakfast Cereals
- Baby Food
- Food Spread
- Ready Meals
- Condiments and Sauces
- Other Product Types
-
By Category
- Conventional
- Natural/Organic/Free-From
-
By Distribution Channel
- Supermarkets / Hypermarkets
- Convenience Stores
- Online Retail Stores
- Other Distribution Channels
-
By Geography
-
North America
- United States
- Canada
- Mexico
- Rest of North America
-
Europe
- Germany
- United Kingdom
- Italy
- France
- Spain
- Netherlands
- Poland
- Belgium
- Sweden
- Rest of Europe
-
Asia-Pacific
- China
- India
- Japan
- Australia
- Indonesia
- South Korea
- Thailand
- Singapore
- Rest of Asia-Pacific
-
South America
- Brazil
- Argentina
- Colombia
- Chile
- Peru
- Rest of South America
-
Middle East and Africa
- South Africa
- Saudi Arabia
- United Arab Emirates
- Nigeria
- Egypt
- Morocco
- Turkey
- Rest of Middle East and Africa
-
North America
Data Sources, Market Sizing, and Validation
Desk Research
Desk work started by building the demand pool and price context using public statistical series, then aligning definitions to what is treated as packaged and commercially processed food. We leaned on official production and price releases such as USDA Economic Research Service, the US Bureau of Labor Statistics CPI food indexes, and FAOSTAT food balance and production data. These sources support the consumption direction view and help frame inflation pass-through into packaged categories.
To check trade exposure and category movement, we also referenced sources such as UN Comtrade and UNCTAD processed food trade notes, along with national statistics portals in major countries, association websites, and company filings and investor presentations for packaged food businesses. For selected cross-checks, we used paid subscriptions for company financials and intelligence, news and financials, and a shipment-level import export database where it helped validate trade-linked categories. The sources listed here are illustrative, and we reviewed many other public documents and datasets to collect, validate, and clarify inputs.
Primary Interviews and Surveys
Primary work focused on validating what drives value changes in packaged food, especially how volumes shift by category and how pricing moves with commodities, packaging inputs, and retailer negotiations. We spoke with a mix of manufacturers, distributors, retail channel participants, and category experts across major regions. Their feedback was used to fill data gaps, test assumptions, and calibrate the final model so it matches how the industry reports sales.
Distribution of primary research fieldwork respondents
| Company type | Respondent position | Region |
|---|---|---|
| Top tier: 38% | CXOs: 14% | APAC: 41% |
| Mid tier: 42% | Functional/Unit leaders: 27% | EMEA: 33% |
| Smaller Players: 20% | Managers: 59% | Americas: 26% |
Market-Sizing & Forecasting
Sizing began with a top-down build where packaged food spend is reconstructed by combining country-level consumption indicators with category-mix splits and pricing, then filtered through packaged and commercially processed definitions. We then checked results with selective bottom-up approximations, such as rolling up a sampled set of supplier revenues by region, channel checks on sell-through patterns, and simple ASP times volume bridges for high-share categories where public volume series exist.
Key inputs used in the model include food CPI and category inflation signals, population and urbanization trends, household food expenditure direction, import export movement for processed food groups, and major commodity and packaging cost direction that affects pricing. When the forecast was built, scenario analysis was used so shifts in inflation, promotion intensity, and trading-down behavior could be reflected, and then the path was narrowed using expert consensus from interviews. Where bottom-up checks did not cover all geographies or smaller categories, we filled gaps using peer group ratios and conservative penetration assumptions. We then rechecked that implied per-capita spend stayed realistic.
Data Validation & Update Cycle
Outputs were validated through triangulation across independent signals, including macro food spend direction, inflation series, and trade and production cues, before the final numbers were signed off. If a category showed a jump that could not be explained by price, volume, or mix, we revisited assumptions and, when needed, re-contacted interviewees to confirm what changed in the market.
The report is refreshed annually, and interim updates are triggered when material events shift pricing or demand, such as sharp commodity moves or major policy changes affecting food inflation. Before delivery, we run a fresh pass on key inputs and conversions so clients receive an up-to-date view consistent with the latest available data.
Mordor Intelligence's Packaged Food Market Size Compared With Other Published Estimates
Published packaged food market numbers can differ more than expected because timing and pricing choices change the answer even when the scope looks similar. The biggest sources of spread usually come from which categories are counted as packaged, whether values are measured at retail sales or earlier in the value chain, and how inflation is treated in the base year.
In this study, the refresh cycle matters because CPI-driven price movement and currency conversion timing can move a large total noticeably, and those checks are applied consistently in the latest update by Mordor Intelligence. When other estimates use older exchange rates, different average selling price bridges, or do not re-validate inflation pass-through with channel feedback, the reported current-year value can land higher or lower even if the long-term CAGR looks similar.
Benchmark comparison
| Source | Market Size | Gaps in Research Methodology |
|---|---|---|
| Mordor Intelligence | USD 6.61 T (2026) | |
| Trade Journal A | USD 2.69 T (2025) | This figure appears to use a narrower packaged food basket and a different pricing basis, which can exclude several mainstream categories and keep ASP escalation closer to a single-year snapshot. |
| Industry Portal B | USD 2.09 T (2024) | This estimate likely reflects an earlier base year and a tighter processed food definition, and it may not fully recheck currency timing and inflation pass-through, which can understate the value during high-price periods. |
The table shows that most of the gap comes from scope boundaries and how prices and currencies are updated between years, rather than from demand direction alone. By keeping the category boundary explicit, rechecking price progression against inflation signals, and validating assumptions with channel participants, our approach produces a traceable value that can be replicated and updated as conditions change.


Key Questions Answered in the Report
How big will packaged food revenues be by 2031?
The packaged food market is projected to reach USD 8.15 trillion by 2031, reflecting a 4.28% CAGR from 2026 to 2031.
Which product type is growing the fastest?
Dairy and dairy alternatives are forecast to post the highest 4.81% CAGR through 2031 as consumers shift toward plant-based and functional proteins.
What retail channel is expanding most quickly?
Online retail is expected to rise at 5.57% annually, outpacing all other channels due to direct-to-consumer models and rapid delivery services.
Which region offers the strongest growth outlook?
South America leads with an expected 5.03% CAGR to 2031, propelled by e-commerce expansion and improving macroeconomic stability in Brazil and Argentina.
How are brands responding to sustainability demands?
Manufacturers are investing in recyclable and compostable packaging, enzymatic recycling technologies, and blockchain traceability to meet regulatory and consumer expectations.
Page last updated on:


 Your data is secure and never sold or shared.


