Flow Imaging Microscopy Market Size and Share
Market Overview
| Study Period | 2019 - 2030 |
|---|---|
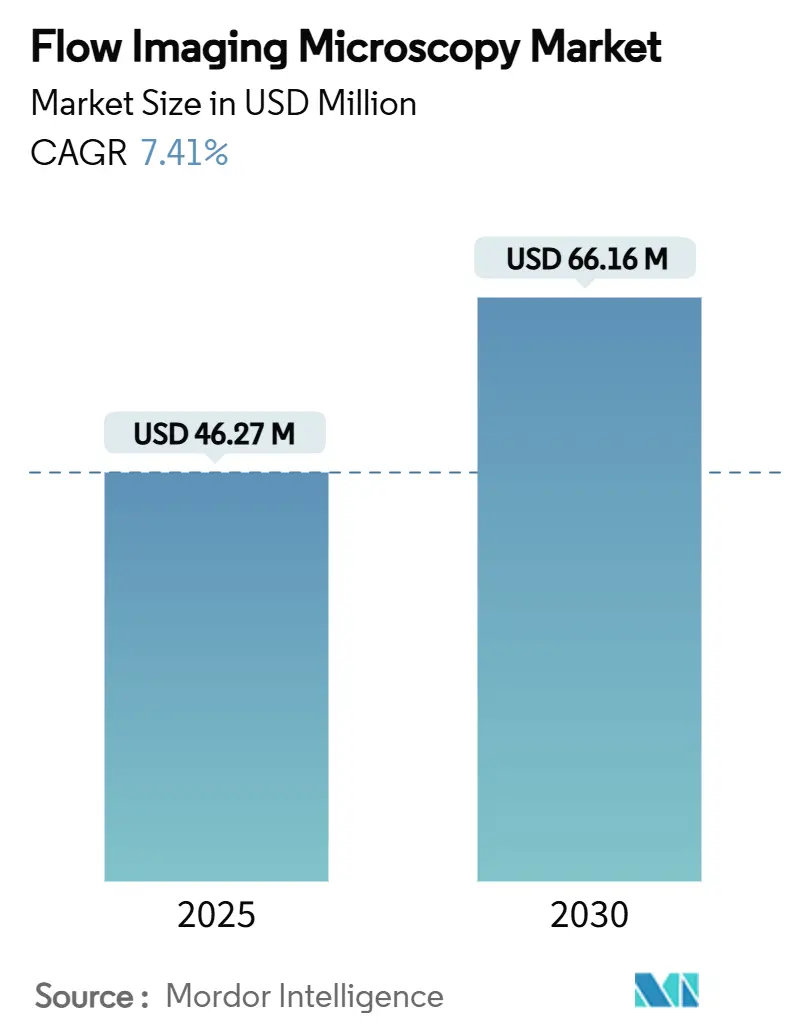
| Market Size (2025) | USD 46.27 Million |
| Market Size (2030) | USD 66.16 Million |
| Growth Rate (2025 - 2030) | 7.41% CAGR |
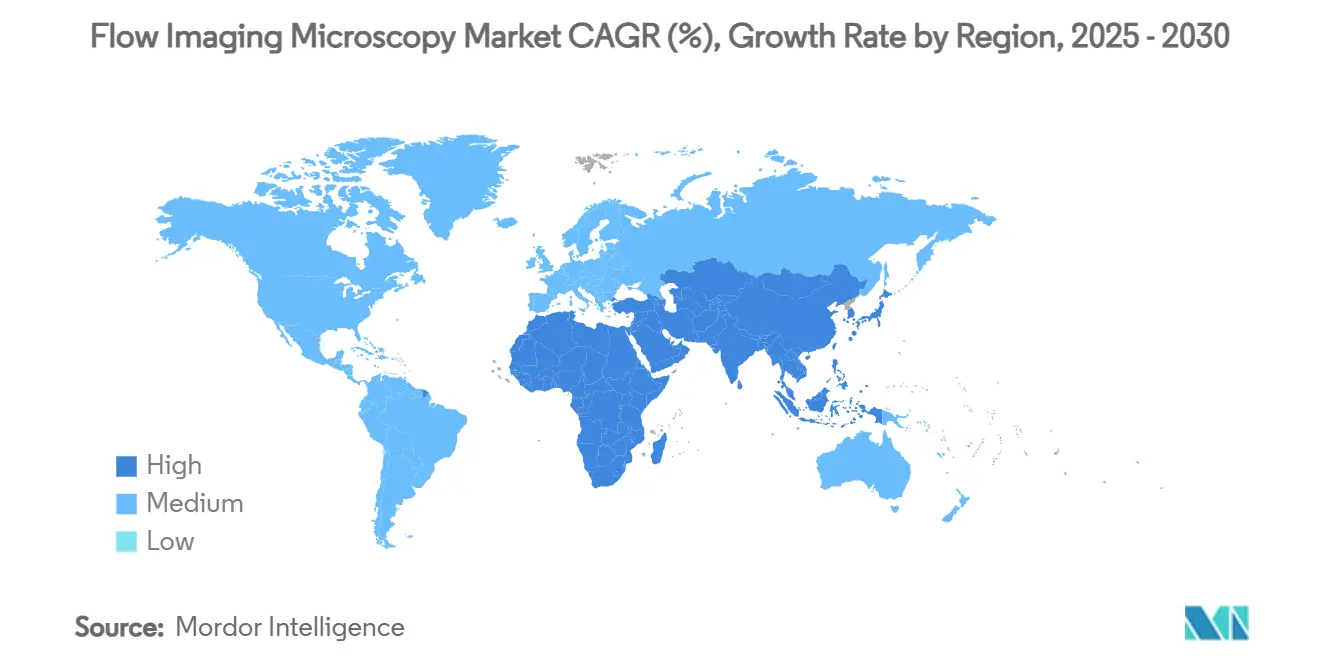
| Fastest Growing Market | Asia Pacific |
| Largest Market | North America |
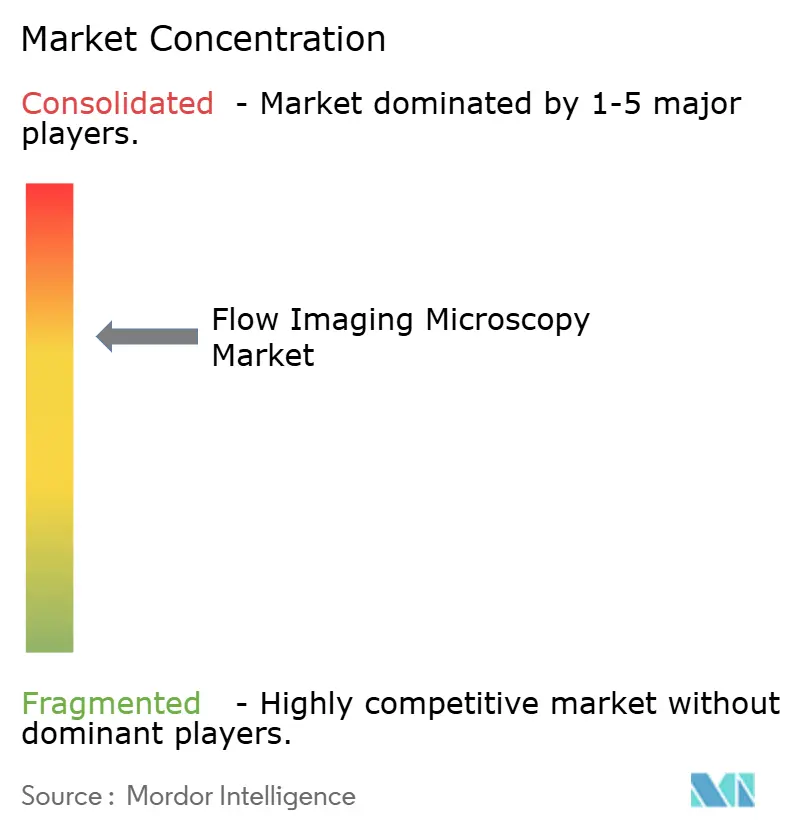
| Market Concentration | Medium |
Major Players
*Disclaimer: Major Players sorted in no particular order Image © Mordor Intelligence. Reuse requires attribution under CC BY 4.0. |
|
Flow Imaging Microscopy Market Analysis by Mordor Intelligence
The flow imaging microscopy market size is valued at USD 46.27 million in 2025 and is forecast to reach USD 66.16 million by 2030, translating into a 7.41% CAGR over the period. This steady outlook reflects deeper integration of the technology into biopharmaceutical quality control, environmental monitoring, and materials characterization workflows. Regulatory pressure—most notably USP <1788> requirements for subvisible particle characterization—has elevated demand for orthogonal imaging methods that complement light-obscuration testing. Laboratories are also accelerating adoption because artificial-intelligence image analytics now shorten analysis time, improve reproducibility, and lower operator involvement, which collectively strengthen return-on-investment arguments.[1] ZEISS, “Harness AI for Microscopy Image Analysis in Pharma and Biotech Research,” zeiss.com Drivers Uptake is further supported by climate-driven water-quality risks that push environmental agencies toward real-time harmful-algal-bloom surveillance and microplastics detection.[2]US Environmental Protection Agency, “Using Spectral Flow Cytometry to Combat Harmful Algal Blooms in Drinking Water,” epa.gov While high upfront system costs and emerging holographic alternatives temper growth, software advances, cloud connectivity, and service-based deployment models continue to expand the accessible user base.
Key Report Takeaways
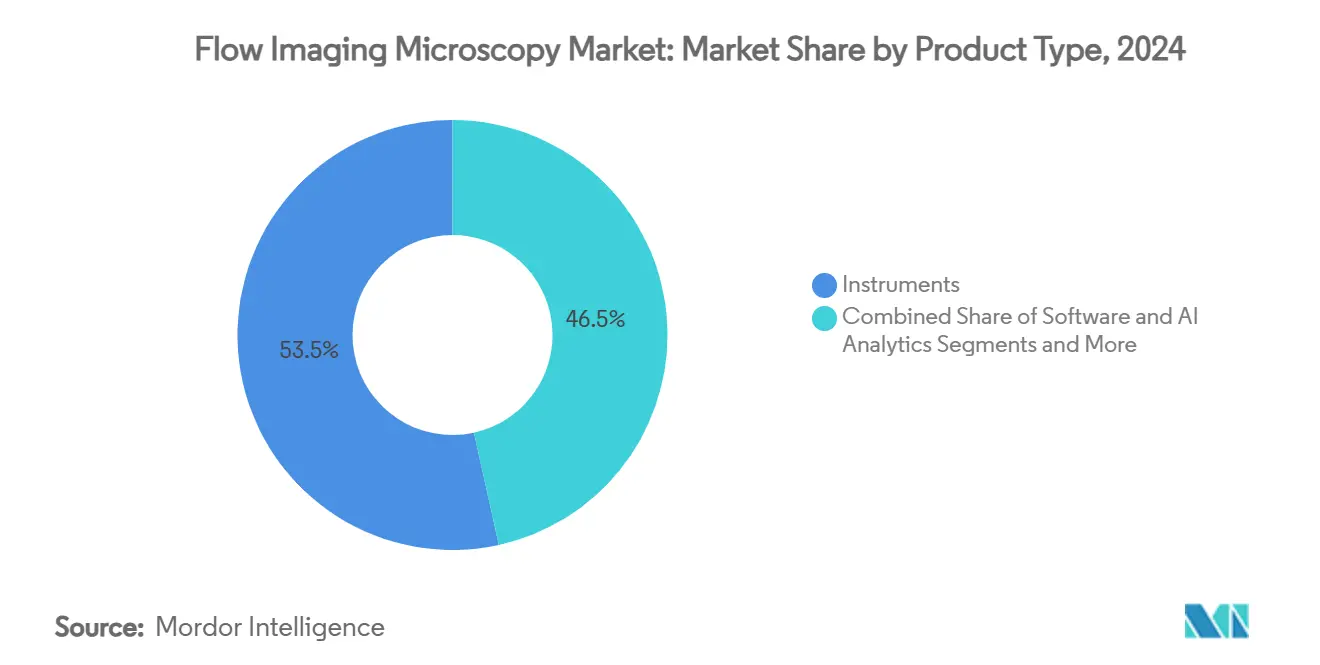
- By product type, instruments led with 53.46% revenue share in 2024, whereas software and AI analytics are set to grow at an 11.79% CAGR through 2030.
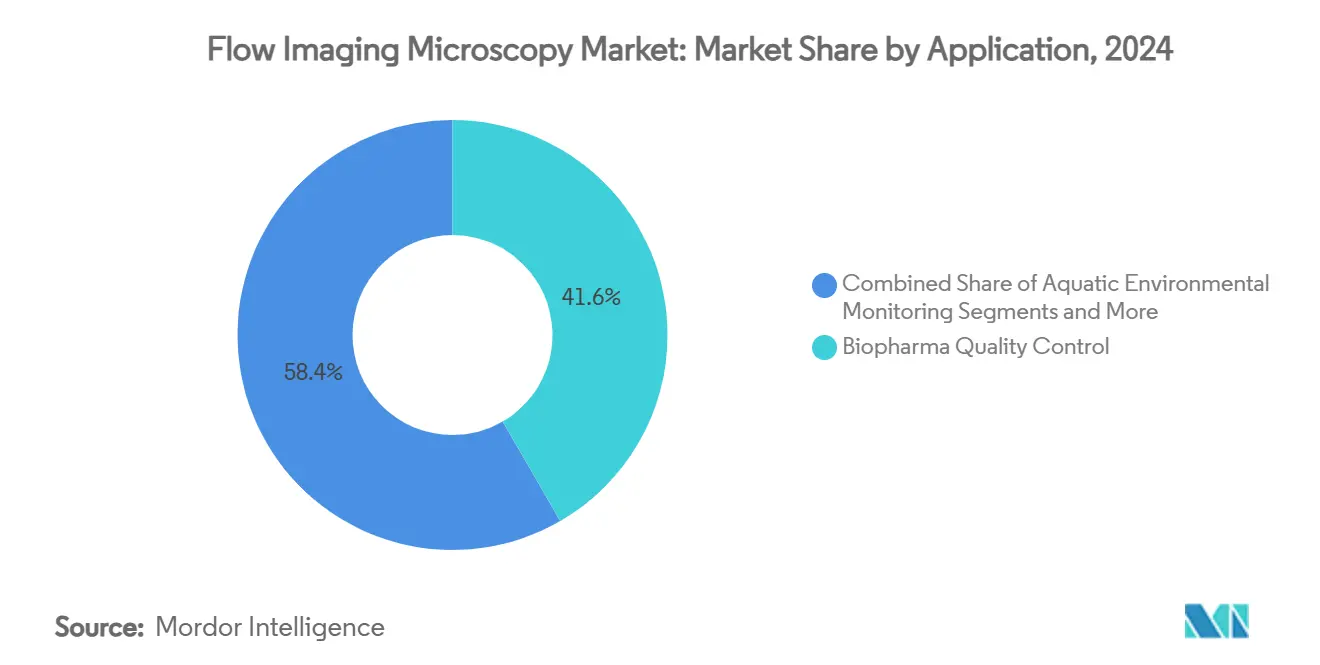
- By application, biopharma quality control captured 41.64% of the flow imaging microscopy market share in 2024, while microplastics monitoring is projected to expand at a 10.33% CAGR to 2030.
- By end user, biopharma and biotechnology companies held 46.73% share of the flow imaging microscopy market size in 2024; water and environmental agencies represent the fastest-rising segment with a 10.87% CAGR through 2030.
- By geography, North America accounted for 37.35% of 2024 revenue, whereas Asia-Pacific is forecast to register the highest regional CAGR at 9.89% between 2025 and 2030.
Global Flow Imaging Microscopy Market Trends and Insights
Drivers Impact Analysis*
| Driver | (~) % Impact on CAGR Forecast | Geographic Relevance | Impact Timeline |
|---|---|---|---|
| Stricter USP <1788> compliance in biopharma QC | +1.8% | North America & EU | Medium term (2-4 years) |
| Rapid adoption for HAB & water-quality monitoring | +1.2% | Global, with APAC leadership | Short term (≤ 2 years) |
| AI-enabled image analytics boosts throughput | +1.5% | North America & EU core, spill-over to APAC | Medium term (2-4 years) |
| Real-time microplastic surveillance in F&B chains | +0.9% | Global, with EU regulatory leadership | Long term (≥ 4 years) |
| Integration with microfluidic single-cell platforms | +0.7% | North America & APAC | Long term (≥ 4 years) |
| Scrutiny of viral-vector and lipid-nanoparticle aggs. | +1.0% | Global, with North America leadership | Medium term (2-4 years) |
| Source: Mordor Intelligence | |||
Stricter USP <1788> Compliance in Biopharma QC
Regulators now require morphological as well as numeric characterization of subvisible particles in injectable biologics. Flow imaging microscopy delivers shape-based differentiation that light-obscuration alone cannot capture, helping manufacturers trace aggregation root causes and avoid costly batch rejections. US FDA reviews of cell- and gene-therapy filings intensify this focus, making the method a de-facto element of biologics control strategies. As large contract development and manufacturing organizations integrate FIM into multi-product lines, procurement cycles have shortened and multi-instrument orders are increasingly common. Vendors respond with closed-loop cleaning protocols to meet good manufacturing practice needs, further embedding FIM into standard release testing. Sustained compliance pressure underpins predictable replacement demand during the forecast horizon.
Rapid Adoption for HAB & Water-Quality Monitoring
Environmental authorities use flow imaging microscopy to quickly distinguish cyanobacteria species and quantify cell morphologies that correlate with toxin production. Municipal utilities deploy automated platforms such as FlowCam systems to screen raw-water intakes, cutting manual microscopy labor and enabling earlier treatment intervention. Climate-driven temperature shifts and nutrient runoffs that amplify bloom frequency have multiplied monitoring points, spurring multi-instrument installations across lake and estuary networks. APAC leads growth because countries such as China and Vietnam face both drinking-water safety and aquaculture-health challenges. Suppliers now offer ruggedized field models with onboard AI classification that upload results to cloud dashboards, an architecture that aligns with smart-city infrastructure priorities.
AI-Enabled Image Analytics Boosts Throughput
Machine-learning algorithms segment and classify thousands of images per minute, standardizing decisions once reliant on operator expertise. In regulated laboratories, this consistency minimizes data-review cycles and aids electronic batch-record integration. Software vendors provide continuously trained libraries that capture new particle morphologies, accelerating method transfer between sites. Pharmaceutical users report up to 75% operator-time savings when AI modules triage exceptions for human review. Cloud processing additionally unlocks collaborative data mining, where multi-site teams jointly interrogate trend shifts that could signal process deviations. Such productivity gains drive the double-digit growth of the software and analytics segment—even among legacy hardware owners upgrading existing instruments.
Real-Time Microplastic Surveillance in F&B Chains
Brands adopt flow imaging microscopy to flag polymer fragments in beverages, seasonings, and packaging wash-waters ahead of looming contaminant limits. Fluorescent staining protocols like Nile Red selectively illuminate microplastics, while AI classifiers separate polymer shapes from organic debris, ensuring accurate mass-balance reporting.[3]Jingjing Li, “Separation and Flow Cytometry Analysis of Microplastics and Nanoplastics,” Frontiers in Chemistry, frontiersin.org Early detection curtails recall exposure and supports sustainability narratives. European regulators lead standard-setting, prompting global suppliers to align internal quality specifications with probable legislative thresholds. Equipment makers now bundle turnkey microplastics kits—pre-loaded stain reagents, calibration particles, and validated software settings—to help food processors integrate the technique with minimal method-development effort.
Restraints Impact Analysis*
| Restraint | (~) % Impact on CAGR Forecast | Geographic Relevance | Impact Timeline |
|---|---|---|---|
| High capital expenditure of FIM instruments | -1.2% | Global, with APAC most affected | Short term (≤ 2 years) |
| Lack of universal data standards | -0.8% | Global | Medium term (2-4 years) |
| Photodamage and sample heating in live-cell use | -0.6% | Global, research institutions impacted | Long term (≥ 4 years) |
| Substitution threat from label-free holographic tech | -0.9% | North America & EU | Long term (≥ 4 years) |
| Source: Mordor Intelligence | |||
High Capital Expenditure of FIM Instruments
Advanced systems can exceed USD 300,000, and the figure climbs further when factoring recurring software licences, service contracts, and vibration-isolated benches. Budget-limited laboratories defer purchases or rely on shared-facility models, slowing penetration in smaller biotech clusters and public-sector water agencies. Emerging pay-per-sample and leasing models are beginning to offset sticker shock, yet up-front investment remains the single largest obstacle to first-time adoption.
Lack of Universal Data Standards
Unlike the well-established FCS format in flow cytometry, flow imaging microscopy lacks harmonized file structures and metadata definitions, which hampers cross-platform data exchange and slows regulatory validation. Pharmaceutical firms struggle with method transfer between sites using different vendors’ equipment, often resorting to in-house scripts to bridge compatibility gaps. Standards bodies are drafting image-format guidelines, but consensus remains at least two years away.
*Our forecasts treat driver/restraint impacts as directional, not additive. The impact forecasts reflect baseline growth, mix effects, and variable interactions.
Segment Analysis
By Product Type: Instruments Lead Despite Software Acceleration
Instruments delivered 53.46% of 2024 revenue, underscoring the indispensable role of precision optics in any flow imaging deployment. Many users opt for flagship 8,000-series or equivalent platforms that integrate telecentric lenses and variable-depth flow cells, ensuring repeatable focus across heterogeneous samples. Replacement demand arises from controller obsolescence and throughput upgrades, sustaining a stable baseline for manufacturers.
The software and AI analytics category, although smaller, is expanding at 11.79% CAGR to 2030. Cloud-connected dashboards, pretrained convolutional neural networks, and audit-ready reporting modules cut result-turnaround times by up to 60% in regulated labs. Vendors increasingly unbundle software from hardware, letting facilities run new analytics on legacy instruments. This shift elevates lifetime revenue per installed system and fuels incremental adoption of subscription models. Reagent, consumable, and accessory volumes scale with installed instrument count, while professional services gain traction as multi-site enterprises seek harmonized global method implementation.


By Application: Biopharma QC Dominates While Microplastics Monitoring Surges
Biopharma quality control generated 41.64% of 2024 demand, driven by a decade of biologics pipeline growth and heightened particulate scrutiny for parenteral formulations. The segment remains resilient because platform technologies—monoclonal antibodies, viral vectors, lipid nanoparticles—each impose distinct morphology monitoring requirements that conventional counters miss. Continuous-manufacturing pilots further embed FIM in in-line surveillance loops, ensuring product-release timelines are not delayed by off-line testing.
Microplastics monitoring posts the fastest 10.33% CAGR through 2030 as regulators define food and beverage contamination limits. The adoption curve accelerates once laboratories validate Nile-Red staining at sub-micron resolution, a capability now achievable on mainstream flow imaging instruments. Early movers among bottled-water and dairy processors showcase marketing claims around polymer-free production, catalyzing peer adoption. Aquatic environmental programs and materials science applications deliver steady, diversified baseline growth that cushions market cyclicality.
By End User: Biopharma Companies Lead While Environmental Agencies Accelerate
Biopharma and biotechnology companies commanded 46.73% of expenditures in 2024, reflecting their unambiguous need for orthogonal particle characterization across R&D, clinical, and commercial stages. Capital budgets accommodate multi-instrument clusters integrated within sterile core facilities, ensuring redundancy and 24 × 7 availability during production campaigns.
Water and environmental agencies, however, represent the most dynamic end-user group at a 10.87% CAGR. National monitoring networks purchasing dozens of portable units for lake-water patrols swell order volumes, helped by grant funding linked to public-health objectives. Academic institutions continue to purchase systems for phytoplankton taxonomy projects and microfluidic method development, whereas contract testing laboratories leverage FIM to win outsourcing work from resource-constrained pharmaceutical clients.
Geography Analysis
North America delivers consistent revenue through its entrenched biologics ecosystem and the FDA’s emphasis on subvisible particle control. North America held 37.35% of revenue in 2024. Flow imaging microscopy now forms part of standard release-testing for cell-therapy batches where polymeric or proteinaceous debris jeopardizes patient safety. Canada adds incremental demand from vaccine initiatives, and Mexico’s contract-manufacturing clusters adopt mid-range systems for export compliance.
Asia-Pacific’s 9.89% forecast CAGR is supported by national drug-safety reforms that align with ICH guidelines, compelling local manufacturers to upgrade particle-analysis capabilities. Water ministries in Japan and Korea integrate flow imaging microscopy into coastal monitoring stations to manage harmful algal blooms, while China funds microplastic-pollution studies spanning the Yangtze and Pearl River delta. Vendors responding with Mandarin-localized software and on-the-ground service centers improve adoption economics.
Europe leverages its Green Deal priorities to set microplastic contamination thresholds that ripple across global supply chains. Pharmaceutical clusters in Germany and the United Kingdom maintain replacement demand for cGMP facilities, and research collaborations funded by Horizon Europe fuel early evaluation of holographic hybrid platforms. Southern European water utilities gradually follow northern counterparts in deploying automated microscopy to offset chronic staffing shortages.

Competitive Landscape
The flow imaging microscopy market features moderate fragmentation with roughly a dozen prominent brands and numerous niche technology entrants. Yokogawa Fluid Imaging Technologies, Bio-Techne, and Malvern Panalytical anchor the premium tier, differentiating through proprietary optics, FDA-21 CFR Part 11-ready software, and global service footprints. Danaher’s partnership with Stanford University indicates incumbent willingness to incubate AI-native architectures that may underpin the next product cycle.
Thermo Fisher, BD, and Bruker blend flow imaging functions into broader instrument portfolios, leveraging cross-selling to immunology, cytometry, and neurobiology researchers. Mid-sized specialists court application niches—for example, real-time phytoplankton enumeration or single-use bioreactor monitoring—offering tailored flow-cell geometries or disposable wetted parts. Strategic acquisitions focus on algorithm libraries and cloud-infrastructure assets rather than optical hardware, signaling a shift toward software-defined differentiation.
Label-free holographic start-ups introduce competitive tension by promising lower power budgets and compatibility with live-cell workflows. Recognizing the threat, established vendors foster co-development agreements or license refractive-index reconstruction modules, hedging bets without cannibalizing flagship product lines. Pricing competition intensifies in emerging markets, but service responsiveness and application-science support remain decisive for regulated pharma buyers.
Flow Imaging Microscopy Industry Leaders
-
Yokogawa Fluid Imaging Technologies
-
Bio-Techne
-
Malvern Panalytical
-
Occhio s.a.s
-
HORIBA Ltd
- *Disclaimer: Major Players sorted in no particular order

Recent Industry Developments
- May 2025: Thermo Fisher Scientific launched the spectral-enabled Invitrogen Attune Xenith Flow Cytometer, offering automated workflows that accelerate cellular analysis in immunology and immuno-oncology research.
- May 2025: BD introduced the FACSDiscover A8 Cell Analyzer, integrating real-time imaging with spectral detection to profile up to 50 cellular parameters for translational research.
- April 2025: Bruker unveiled the nVista 2P miniature microscope, expanding functional imaging capabilities in freely behaving animals with depth penetration to 300 µm.


Global Flow Imaging Microscopy Market Report Scope
| Instruments |
| Software & AI Analytics |
| Reagents & Consumables |
| Accessories & Services |
| Biopharma Quality Control |
| Aquatic Environmental Monitoring |
| Food & Beverage Quality Assurance |
| Materials Science & Industrial |
| Biopharma & Biotechnology Companies |
| Academic & Research Institutes |
| Water & Environmental Agencies |
| Food & Beverage Manufacturers |
| Contract Testing Laboratories |
| North America | United States |
| Canada | |
| Mexico | |
| Europe | Germany |
| United Kingdom | |
| France | |
| Italy | |
| Spain | |
| Rest of Europe | |
| Asia-Pacific | China |
| Japan | |
| India | |
| Australia | |
| South Korea | |
| Rest of Asia-Pacific | |
| Rest of World |
| By Product Type | Instruments | |
| Software & AI Analytics | ||
| Reagents & Consumables | ||
| Accessories & Services | ||
| By Application | Biopharma Quality Control | |
| Aquatic Environmental Monitoring | ||
| Food & Beverage Quality Assurance | ||
| Materials Science & Industrial | ||
| By End User | Biopharma & Biotechnology Companies | |
| Academic & Research Institutes | ||
| Water & Environmental Agencies | ||
| Food & Beverage Manufacturers | ||
| Contract Testing Laboratories | ||
| By Geography | North America | United States |
| Canada | ||
| Mexico | ||
| Europe | Germany | |
| United Kingdom | ||
| France | ||
| Italy | ||
| Spain | ||
| Rest of Europe | ||
| Asia-Pacific | China | |
| Japan | ||
| India | ||
| Australia | ||
| South Korea | ||
| Rest of Asia-Pacific | ||
| Rest of World | ||


Key Questions Answered in the Report
1. What is the current value of the flow imaging microscopy market?
The flow imaging microscopy market size stands at USD 46.27 million in 2025 and is projected to reach USD 66.16 million by 2030.
2. Which product category leads the market?
Instruments dominate with 53.46% share in 2024, reflecting their foundational role in all flow imaging microscopy workflows.
3. Why are environmental agencies investing in flow imaging microscopy?
Agencies adopt the technology for rapid harmful-algal-bloom detection and real-time microplastic surveillance that safeguard drinking-water quality.
4. Which region is growing the fastest?
Asia-Pacific is forecast to expand at 9.89% CAGR because of rising pharmaceutical capacity and large-scale water-quality initiatives.
5. How is artificial intelligence influencing the market?
AI-enabled image analytics reduce operator time by up to 75% and standardize particle classification, driving an 11.79% CAGR in the software segment.
Page last updated on:


