Whole Slide Imaging Market Size and Share
Market Overview
| Study Period | 2020 - 2031 |
|---|---|
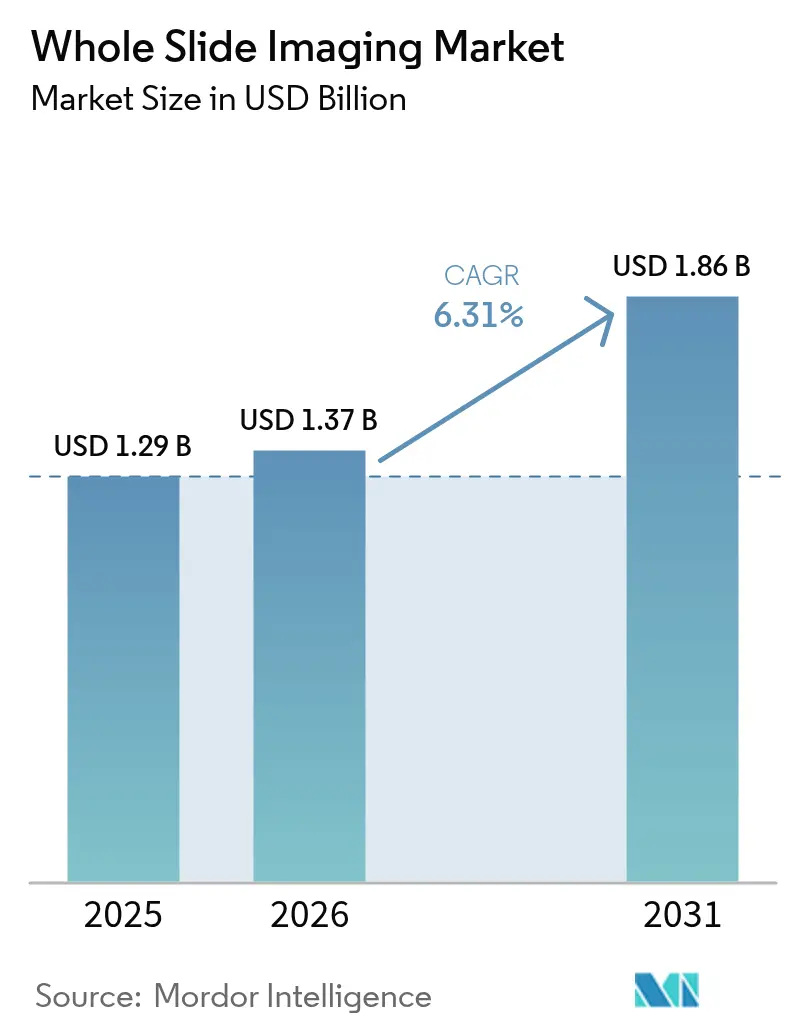
| Market Size (2026) | USD 1.37 Billion |
| Market Size (2031) | USD 1.86 Billion |
| Growth Rate (2026 - 2031) | 6.31% CAGR |
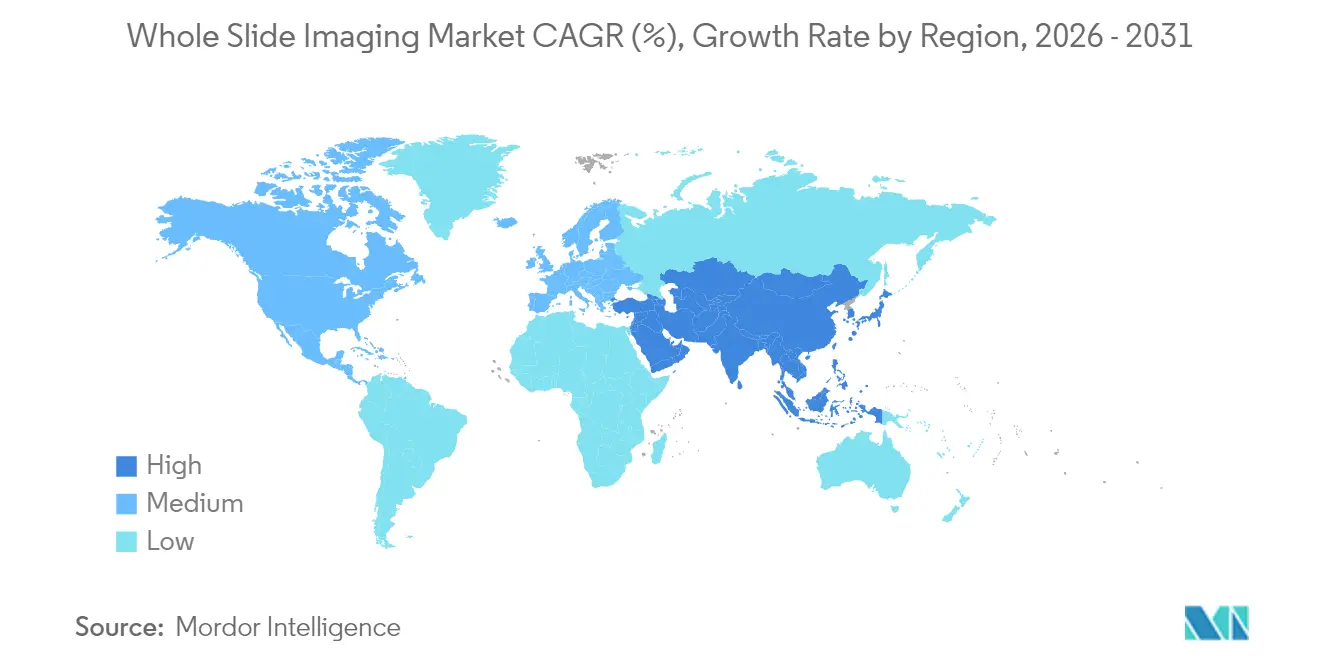
| Fastest Growing Market | Asia Pacific |
| Largest Market | North America |
| Market Concentration | Medium |
Major Players *Disclaimer: Major Players sorted in no particular order Image © Mordor Intelligence. Reuse requires attribution under CC BY 4.0. | |
Whole Slide Imaging Market Analysis by Mordor Intelligence
Whole Slide Imaging market size in 2026 is estimated at USD 1.37 billion, growing from 2025 value of USD 1.29 billion with 2031 projections showing USD 1.86 billion, growing at 6.31% CAGR over 2026-2031. The rise mirrors the accelerating digital shift of histopathology laboratories, where declining scanner prices, expanding regulatory clearances, and artificial-intelligence add-ons are reshaping routine diagnostics. Established healthcare systems in North America continue to anchor revenue, while Asia-Pacific’s faster adoption underpins future expansion. Hardware spending still absorbs the bulk of capital outlays, yet long-term value is migrating to cloud software that streamlines workflows and boosts reading accuracy. Competitive dynamics favor firms that pair scanners with open analytical ecosystems, allowing users to layer AI algorithms without vendor lock-in.
Key Report Takeaways
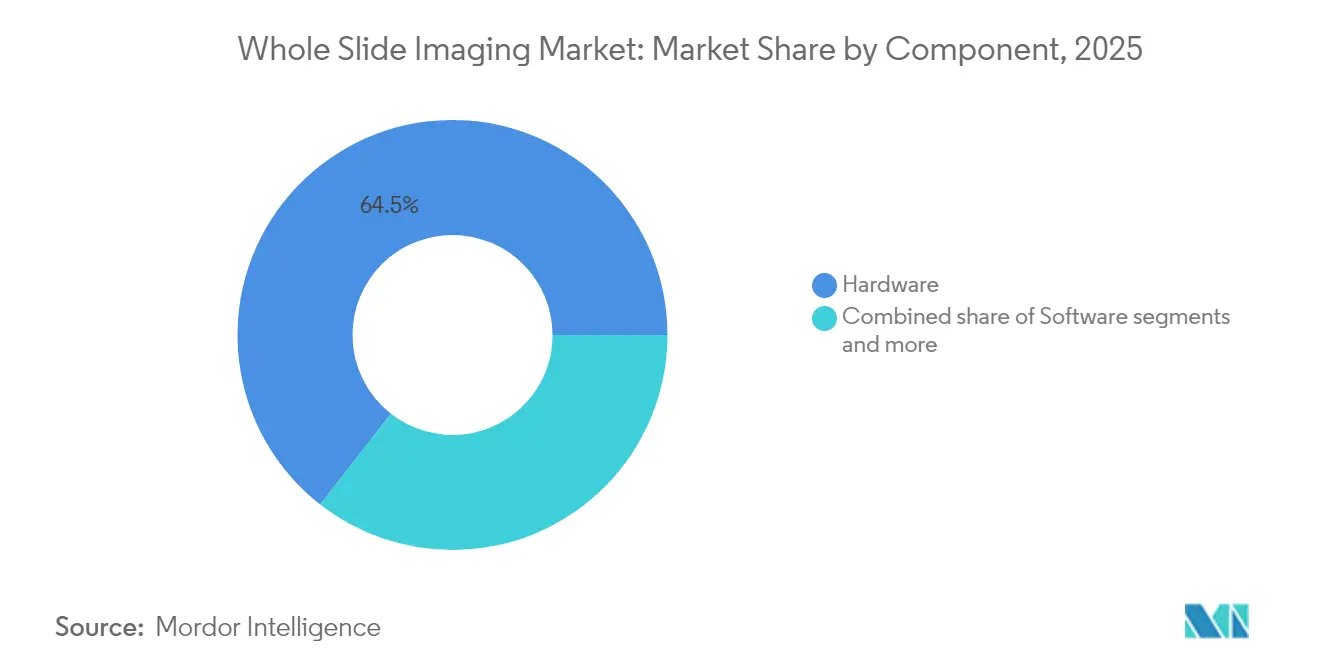
- By component, hardware captured 64.45% of Whole Slide Imaging market share in 2025, whereas software platforms are expanding at 6.63% CAGR through 2031.
- By scanner type, brightfield units led with 51.62% share of the Whole Slide Imaging market size in 2025, while fluorescence models are advancing at a 6.90% CAGR to 2031.
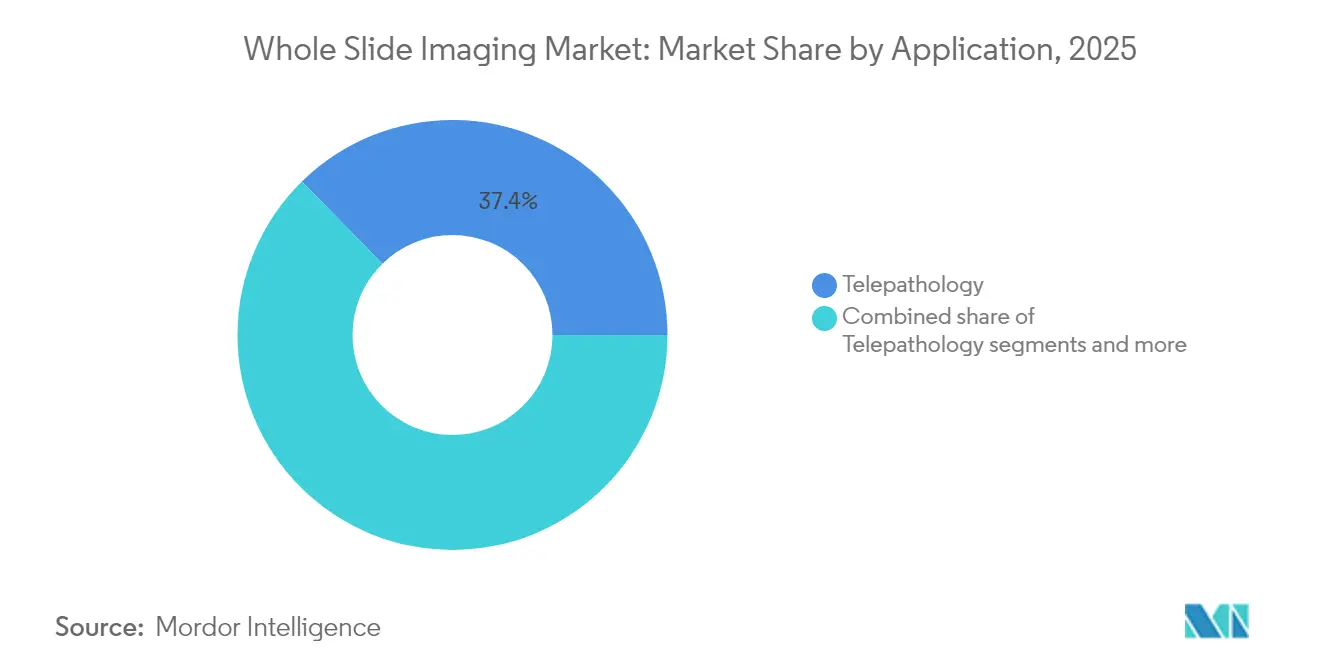
- By application, telepathology accounted for 37.35% share of the Whole Slide Imaging market in 2025 and immunohistochemistry is growing at 7.28% CAGR through 2031.
- By end user, hospitals and clinical laboratories held 46.10% share in 2025, yet pharmaceutical and biotechnology companies post the highest 6.48% CAGR to 2031.
- By geography, North America commanded 43.70% share in 2025; Asia-Pacific registers the fastest 7.02% CAGR to 2031.
Note: Market size and forecast figures in this report are generated using Mordor Intelligence’s proprietary estimation framework, updated with the latest available data and insights as of 2026.
Market Trends and Insights
Drivers Impact Analysis of Whole Slide Imaging Market*
| Driver | (~) % Impact on CAGR Forecast | Geographic Relevance | Impact Timeline |
|---|---|---|---|
| Accelerating adoption of digital pathology for remote diagnostics | +1.8% | Global, with early gains in North America, Europe, Asia-Pacific | Medium term (2-4 years) |
| Rising cancer incidence & need for faster histopathology workflows | +1.5% | Global, particularly APAC and emerging markets | Long term (≥ 4 years) |
| Declining scanner costs & improving image resolution | +1.2% | Global, with stronger impact in cost-sensitive APAC markets | Short term (≤ 2 years) |
| Integration with AI-driven image-analysis software | +1.0% | North America & EU leading, APAC following | Medium term (2-4 years) |
| Expansion of national telepathology networks (e.g., Canada, Nordics) | +0.7% | North America, Europe, with spillover to developed APAC | Medium term (2-4 years) |
| Growing demand for companion diagnostics in precision oncology | +0.6% | Global, with concentration in North America, EU | Long term (≥ 4 years) |
| Source: Mordor Intelligence | |||
Accelerating Adoption of Digital Pathology for Remote Diagnostics
Remote reporting allows scarce pathologists to serve multiple sites, slashing turnaround from days to hours. China’s national telepathology network processed more than 16,000 consults within two years, showing scale efficiencies in underserved regions. During the COVID-19 emergency, the FDA issued guidance supporting home-based digital reads, cementing clinical trust in virtual workflows[1]Source: U.S. Food and Drug Administration, “Digital Pathology Program: Research on Digital Pathology Medical Devices,” fda.gov . Cloud portals now link scanners, image managers, and laboratory information systems so cases move seamlessly from staining to sign-out. Third-party AI plug-ins add tumor detection and grading, turning remote practice into a subscription service rather than a capital project.
Rising Cancer Incidence & Need for Faster Histopathology Workflows
Cancer prevalence keeps outpacing traditional slide review capacity. Whole Slide Imaging market users report productivity gains of up to 37% after adopting AI-assisted tumor localization, freeing specialists for complex analytics. Digital co-reading lets several consultants review the same specimen simultaneously, eliminating sequential bottlenecks that delay therapy. Precision oncology also drives demand for automated immunostains and molecular overlays that require pixel-perfect registration, something optical microscopes cannot deliver. Labs running mature digital protocols processed 21% more cases per pathologist in 2024.
Declining Scanner Costs & Improving Image Resolution
Migration from CCD to CMOS sensors cuts price tags while lifting optical quality. Contemporary systems reach 40× magnification in under 60 seconds per slide, broadening affordability for mid-tier hospitals. Vendors now offer modular fleets—from 540-slide autoloaders to bench-top units—so institutions scale purchases to volume instead of buying monoliths up front. High-resolution brightfield feeds multiplex immunofluorescence add-ons, expanding the Whole Slide Imaging market beyond routine H&E reads into translational research and drug discovery. Cloud archiving further trims total cost of ownership by shifting storage from capex to pay-as-you-go opex.
Integration with AI-Driven Image-Analysis Software
Regulators have cleared algorithms for prostate and breast cancer detection, legitimizing machine learning as a frontline diagnostic aid. In challenge datasets, AI reached 92.4% sensitivity for micrometastasis detection compared with 73.2% for pathologists. Foundation models trained on more than one million slides are available as open APIs, enabling even small labs to embed sophisticated analytics without writing code. The data network effect rewards platforms that aggregate de-identified cases, so scale begets accuracy and creates durable moats within the Whole Slide Imaging market.
Restraints Impact Analysis of Whole Slide Imaging Market*
| Restraint | (~) % Impact on CAGR Forecast | Geographic Relevance | Impact Timeline |
|---|---|---|---|
| High upfront capital expenditure for scanners & storage | -1.5% | Global, particularly impacting smaller labs and emerging markets | Short term (≤ 2 years) |
| Data-privacy & cross-border image-transfer regulations | -0.8% | EU (GDPR), Asia-Pacific regulatory variations | Medium term (2-4 years) |
| Limited reimbursement for digital pathology procedures | -0.6% | Global, with variations in healthcare payment systems | Long term (≥ 4 years) |
| Pathologist resistance to full-scale digital workflow adoption | -0.4% | Global, particularly in traditional healthcare systems | Medium term (2-4 years) |
| Source: Mordor Intelligence | |||
High Upfront Capital Expenditure for Scanners & Storage
Full digitization can cost USD 100,000–200,000 for hardware, servers, and licenses, a hurdle for community providers. Added expenses include maintenance, cybersecurity, and staff retraining. Financial studies still show ROI inside six years via labor savings and space consolidation, yet many buyers lack the capital to bridge that gap. Leasing, managed-service, and pay-per-scan contracts are emerging to spread costs across operational budgets, an option that may lift adoption in price-sensitive segments of the Whole Slide Imaging industry.
Data-Privacy & Cross-Border Image-Transfer Regulations
GDPR governs retention, consent, and export of health data inside the EU, forcing vendors to build region-locked clouds or local edge nodes[2]Source: Digital Pathology Association, “Regulatory Information,” digitalpathologyassociation.org . HIPAA adds encryption and audit trails in the United States. Country-specific rules in Asia further complicate multi-site study designs, raising legal risk for global drug trials that rely on telepathology. Standards bodies now publish validation checklists, but compliance still lengthens deployment cycles and raises the barrier to entry for startups in the Whole Slide Imaging market.
*Our forecasts treat driver/restraint impacts as directional, not additive. The impact forecasts reflect baseline growth, mix effects, and variable interactions.
Whole Slide Imaging Market Segment Analysis
By Component:
Hardware Dominance Meets Software InnovationHardware carried 64.45% of Whole Slide Imaging market share in 2025, underlining the significance of scanners, storage, and high-speed networks. Top-end autoloaders process 210–540 slides per run, ensuring capacity for national referral centers. Feature additions like fluorescent channels and darkfield imaging now arrive as firmware updates, protecting earlier investments.
Software revenues grow faster at 6.63% CAGR because buyers look beyond pixel capture toward workflow engines, AI scoring, and cloud collaboration. Subscription models create annuity streams for vendors and flatten spending for labs. Interoperable viewers, LIS bridges, and zero-footprint web consoles raise switching costs once embedded. Every new algorithm release enhances existing datasets, letting users unlock more value from archived cases and pushing the Whole Slide Imaging market toward a data-services orientation.


By Scanner Type:
Brightfield Leadership Faces Multiplex ChallengeBrightfield devices owned 51.62% of Whole Slide Imaging market size in 2025. They remain the default for H&E, which constitutes most clinical workload. Mature optics now exceed optical microscopes in depth of focus, so adoption debates have shifted from image quality to IT integration.
Fluorescence units post the top 6.90% growth rate because multiplex biomarker panels power precision oncology. Dual-mode systems that capture brightfield and fluorescence on one chassis reduce footprint and accelerate ROI. Multispectral variants deconvolute overlapping fluorophores, helping drug developers quantify target engagement. These innovations diversify revenue and cushion hardware sellers against commoditization risks in the Whole Slide Imaging market.
By Application:
Telepathology Leads While Immunohistochemistry AcceleratesTelepathology handled 37.35% of Whole Slide Imaging market cases in 2025. Rural hospitals route frozen sections to metropolitan centers within minutes. Emergency pandemic rules have evolved into permanent policies, embedding virtual consults in standard of care. Insurers increasingly reimburse remote reads, anchoring revenue.
Immunohistochemistry shows the fastest 7.28% CAGR because quantitative HER2, PD-L1, and Ki67 scoring underpins targeted therapies. AI classifiers reach 95% concordance with expert readers, limiting intra-observer variability and enabling multicenter trials. Cytology, hematopathology, and toxicology add specialized niches that widen the application base and keep the Whole Slide Imaging market resilient against single-segment slowdowns.
By End User:
Hospital Dominance Shifts Toward Pharma InnovationHospitals and clinical labs controlled 46.10% of 2025 revenue. They focus on capacity gains, shorter waiting lists, and ergonomic benefits that cut burnout. Large academic systems already scan 288,903 slides annually under enterprise viewers that pool devices from multiple brands.
Pharmaceutical and biotechnology firms deliver the highest 6.48% CAGR by embedding digital slides into discovery, safety studies, and registrational trials. AI-powered lesion mapping reduces pathologist review time in preclinical toxicology by double-digit percentages. Contract research organizations mirror this demand, offering Whole Slide Imaging market services as part of turnkey study packages that accelerate drug pipelines.
Geography Analysis
North America Whole Slide Imaging Market
North America kept 43.70% of Whole Slide Imaging market revenue in 2025. Early FDA clearances normalized digital reads for primary diagnosis, and CAP checklists codified validation. Academic giants such as Memorial Sloan Kettering have proven scalability by digitizing hundreds of thousands of cases, setting reference architectures other institutions follow. Future growth leans on AI co-diagnostics rather than first-time scanner purchases.
APAC Whole Slide Imaging Market
Asia-Pacific records a 7.02% CAGR to 2031. China’s nationwide program shows state-level commitment to telepathology scale-up, while Japan’s mature ecosystem employs WSI in teaching and autopsy services. India’s hospital build-out attracts cloud vendors who can offer subscription scanning to capacity-constrained city labs. Price sensitivity shapes buying criteria toward open-file formats, online viewers, and hosted analytics that bypass large on-premise servers, propelling the Whole Slide Imaging market across diverse income bands.
EMEA and South America Whole Slide Imaging Market
Europe sits between these extremes. Multi-hospital projects such as DigiPatICS demonstrate pan-regional rollouts operating one million slides a year. The Netherlands achieved 96% concordance between glass and digital, encouraging other EU nations to pursue full switch-overs. Data-sovereignty rules oblige localized clouds, stimulating partnerships with regional hosting providers. South America plus Middle East & Africa remain early in adoption yet present white-space upside as healthcare digitization plans mature.

Regulatory Landscape
In the United States, whole slide imaging (WSI) systems are regulated by the FDA as Class II medical devices (product code PSY), and they typically follow the 510(k) pathway. This approach is supported by FDA guidance on technical performance assessment for digital pathology WSI devices. In April 2024, the FDA also published Q&A guidance for the use of WSI in nonclinical toxicology studies, reinforcing expectations around fit-for-purpose validation and traceability when WSI is used to support regulated submissions.
In Europe, WSI deployments that fall under in vitro diagnostic workflows are governed by Regulation (EU) 2017/746 (IVDR), which increases documentation and conformity requirements across the intended-use chain, including for in-house IVDs where applicable. The Medical Device Coordination Group (MDCG) has published guidance (for example, MDCG 2024-11) on qualification of products as an IVD or an accessory, shaping how digital pathology components are classified and documented. Alongside regulator guidance, standards work continues, including ISO development activity focused on digital pathology and AI-based image analysis requirements, which is beginning to influence procurement specifications and validation expectations for interoperable, multi-vendor environments.
Value Chain Analysis
The whole slide imaging value chain starts with upstream optical components, illumination, sensors (CCD/CMOS), and precision-motion systems, then moves through scanner OEM manufacturing and into distribution via direct enterprise sales and specialized channel partners serving hospitals, reference labs, and pharma/CRO accounts. Midstream, image management systems (IMS), viewers, and integration services connect scanners to LIS and identity management, while downstream value concentrates in workflow software, AI algorithms, and deployment models (on-premise, private cloud, and region-locked hosting in regulated markets). Hardware still absorbs the largest portion of many labs' capital outlays, but recurring revenue increasingly attaches to subscriptions for IMS, remote collaboration, and algorithm marketplaces.
Validation and compliance requirements act as a practical gating step during implementation and services. Professional guidance such as CAP-aligned validation practices (commonly framed around at least 60 cases and high concordance between WSI and glass) increases demand for consulting, change management, and multi-scanner/multi-site qualification. Regulatory structuring also segments software from hardware, with distinct device categories for WSI scanners versus software algorithms intended to assist digital pathology users, which shapes how vendors package offerings and how buyers assemble end-to-end solutions spanning scanning, storage, and clinical decision support.
Competitive Landscape
The Whole Slide Imaging market is moderately consolidated. Danaher (Leica Biosystems), Philips, and Hamamatsu enjoy first-mover advantage through FDA-approved scanners paired with integrated viewers and LIS bridges. Their installed bases create sticky ecosystems because clients fear workflow disruption.
Disruptors such as Paige and PathAI apply cloud-native models, offering algorithm marketplaces that run across any DICOM-wrapped slide. Roche broadened presence by embedding AI scores into its navify workflow. Strategic investments like Leica’s January 2025 stake in Indica Labs blur lines between hardware and software specialists, signaling convergence.
M&A shows no sign of slowing. Evident’s August 2025 acquisition of Pramana adds AI pipelines to an optical pedigree, while vendor-agnostic platforms entice IDNs looking to mix scanners from multiple brands. White-space remains in veterinary, forensic, and resource-limited settings where heavyweight hardware is impractical, inviting focused entrants. Competition therefore tilts toward solution breadth, regulatory savvy, and data-network effects rather than pure imaging specs.
Whole Slide Imaging Industry Leaders
Olympus Corporation
Leica Microsystems GmbH
Hamamatsu Photonics K.K.
3DHISTECH Ltd.
Koninklijke Philips N.V.
- *Disclaimer: Major Players sorted in no particular order
Whole Slide Imaging Market Companies Covered in this Report
- Danaher Corp. (Leica Biosystems)
- Koninklijke Philips
- Roche
- Hamamatsu Photonics
- Olympus Corp.
- 3DHistech
- Nikon Corp.
- Huron Digital Pathology Inc.
- Inspirata Inc.
- Sectra
- Indica Labs
- OptraSCAN Inc.
- Motic Digital Pathology
- Visiopharm
- Akoya Biosciences Inc.
- Corista LLC
- Glencoe Software Inc.
- Definiens AG

Market Opportunities and Future Outlook
Networked digital consultation and telepathology are a clear whitespace for scalable utilization, particularly where subspecialty access remains uneven across geographies and health systems. In April 2026, The Ohio State University Comprehensive Cancer Center-Arthur G. James Cancer Hospital and Richard J. Solove Research Institute launched a digital pathology second-opinion consult service across the James Cancer Network using the PathPresenter platform, illustrating how enterprise consult models can be operationalized across remote centers without relying on physical slide transport. Models like this also create room for vendors that bundle scanners, cloud case-routing, and audit-ready collaboration features aligned to hospital-network governance.
An additional opportunity is interoperability and regulated AI deployment across heterogeneous scanner fleets. Regulatory momentum around AI-assisted WSI analysis products (including recent De Novo and 510(k) pathways cited for prostate and second-read tools) is pushing providers to update validation, data pipelines, and IMS integrations so algorithms can be layered without vendor lock-in. This favors platforms that support standardized formats (including DICOM-wrapped whole slide images), multi-site validation tooling, and region-specific data handling for GDPR and cross-border constraints. For pharma, CROs, and translational programs, digital pathology architectures that reduce storage burden (for example, via edge processing and efficient formats) and enable federated analysis across studies offer an adoption pathway tied to study throughput and consistency rather than incremental scanner counts.
Recent Industry Developments in Whole Slide Imaging Market
- June 2026: Leica Biosystems expanded availability of the Aperio GT Elite digital scanner into the EMEA region following its earlier US launch. The move broadens access to an AI-enabled scanning workflow, including integrated quality control capabilities, and strengthens Leica's installed-base strategy across regulated hospital and reference-lab networks.
- July 2025: Hamamatsu Photonics reported that its NanoZoomer S360MD and S20MD slide scanner systems received CDSCO medical device approval in India. This provides a clearer route for clinical deployments in a high-growth, price-sensitive market where regulatory status and serviceability influence large tender decisions.
- June 2025: Evident launched the SLIDEVIEW DX VS200 universal whole slide imaging scanner as a CE-marked device under the EU IVDR framework. IVDR positioning supports clinical procurement in Europe and raises competitive pressure on vendors to pair scanners with compliant documentation, validation tooling, and IMS integration.


Whole Slide Imaging Market Report Scope and Research Methodology
Market Definition and Coverage
For this study, the market covers revenue generated from whole slide imaging systems that convert glass pathology slides into high resolution digital slides, along with the software and infrastructure needed to store, manage, view, and share them across workflows.
Scope exclusions: Non-pathology radiology imaging, general microscopy cameras used outside WSI workflows, and lab instruments that do not create a digital whole slide file are excluded.
Segments Covered in This Report
- By Component
- Hardware
- Software
- By Scanner Type
- Brightfield Scanners
- Fluorescence Scanners
- Multiplex / Multispectral Scanners
- Others
- By Application
- Telepathology
- Cytopathology
- Hematopathology
- Immunohistochemistry
- Toxicological Pathology
- Others
- By End User
- Hospitals & Clinical Laboratories
- Academic & Research Institutes
- Pharmaceutical & Biotechnology Companies
- Contract Research Organizations
- By Geography
- North America
- United States
- Canada
- Mexico
- Europe
- Germany
- United Kingdom
- France
- Italy
- Spain
- Rest of Europe
- Asia-Pacific
- China
- India
- Japan
- South Korea
- Australia
- Rest of Asia-Pacific
- South America
- Brazil
- Argentina
- Rest of South America
- Middle East and Africa
- GCC
- South Africa
- Rest of Middle East and Africa
- North America
Data Sources, Market Sizing, and Validation
Desk Research
Desk research was used to build a starting view of pathology lab installed bases, testing volumes, and regional readiness for digital pathology. We relied on public and official source types, including FDA device databases, CDC materials, World Health Organization documents, and OECD health statistics, to track diagnostics capacity, lab activity signals, and regulatory milestones that affect adoption timing.
We also reviewed peer reviewed pathology journals and conference proceedings to understand validation practices and workflow requirements. This was followed by company annual reports, investor presentations, and credible press coverage on product launches and pricing direction. Where needed, paid subscriptions that provide company financials, patent filing patterns, and shipment level trade signals were used to cross check the growth direction. These examples are not exhaustive, and additional sources were used for data collection, validation, and research clarification.
Primary Interviews and Surveys
Primary work centered on interviews and structured surveys with scanner manufacturers, software and platform teams, pathology lab managers, hospital buyers, and research users. We covered major adoption markets across APAC, EMEA, and the Americas so that assumptions on average selling prices, replacement cycles, and software attachment rates could be confirmed, and adjusted when desk research on specific regions was thin.
Distribution of primary research fieldwork respondents
| Company type | Respondent position | Region |
|---|---|---|
| Top tier: 27% | CXOs: 17% | APAC: 48% |
| Mid tier: 56% | Functional/Unit leaders: 31% | EMEA: 32% |
| Smaller Players: 17% | Managers: 52% | Americas: 20% |
Market-Sizing & Forecasting
Sizing starts with a top-down build where pathology lab capacity, digital pathology penetration, and slide volume indicators are translated into likely scanner placements and software usage by region and end user. To keep the model grounded, we then apply selective bottom-up approximations, including sample roll ups of scanner shipments, typical system pricing, and expected software and service attachment, and reconcile these back to the demand pool.
Key inputs include scanner replacement cycles, average system ASP ranges by scanner type (brightfield and fluorescence), image storage and viewer needs that drive IT infrastructure spend, the share of cases routed to telepathology, and the pace of regulatory clearances that support routine clinical use. When a data point was missing for smaller countries, adjacent market proxies were used first, then adjusted using interview feedback on local procurement behavior.
Forecasting uses mainly scenario analysis, with trend smoothing on historical adoption. Conversion to digital workflows can speed up or slow down depending on reimbursement clarity, validation timelines, and hospital budget cycles. The final outlook was reviewed against expected pathology workload growth and the near-term equipment refresh pipeline described by interviewees.
Data Validation & Update Cycle
Outputs are checked through triangulation across independent signals, including regulatory activity, lab capacity indicators, and observed pricing trends, and then compared across regions to spot outliers. When unusual jumps appear, we reopen the underlying assumptions and run follow-up calls to confirm whether the change is tied to a specific driver such as a large tender, a pricing reset, or a workflow shift.
Before sign-off, the model is reviewed in multiple steps, including peer checks on calculations, unit consistency, and currency conversion timing. Reports are refreshed annually, with interim updates when material events occur, and a final pre-delivery pass is completed so the figures reflect the latest available information.
Mordor Intelligence's Whole Slide Imaging Market Size Compared Against Other Published Estimates
Published market sizes for whole slide imaging can look different even when the topic appears to match, because each publisher defines what counts as WSI revenue and what gets excluded. Variations also reflect how prices are treated, how quickly adoption is assumed to scale in routine clinical labs, and how often the model is refreshed.
Viewing and image management software is a common point where estimates diverge, since some estimates include broader digital pathology platforms even when they are not directly tied to whole slide file creation and routine WSI workflows, leading to a projected shift in the software mix. Currency timing and whether the value is reported at manufacturer selling price versus a broader channel price can further widen the spread.
Benchmark comparison
| Source | Market Size | Gaps in Research Methodology |
|---|---|---|
| Mordor Intelligence | USD 1.37 B (2026) | |
| Industry Publisher A | USD 1.31 B (2025) | Uses a 2025 base year and does not clearly separate WSI-specific software and infrastructure from broader digital pathology platforms, which can compress or expand the total depending on bundling assumptions. |
| Industry Publisher B | USD 1.38 B (2025) | Anchors the total on a 2025 value and appears to blend hardware and software at a high level without detailing scanner replacement timing and storage intensity, which shifts the implied revenue mix and year-to-year progression. |
Telepathology viewing tools that do not originate from whole slide scanning sit outside Mordor Intelligence's scope, and that single exclusion explains part of the spread seen across the 2025 to 2026 figures. With clearer mapping to scanner placements, software attachment, and regional adoption signals, the estimate stays traceable to simple variables that can be rechecked as new inputs arrive.


Key Questions Answered in the Report
What is the projected value for global whole-slide imaging by 2031?
The Whole Slide Imaging market is forecast to reach USD 1.86 billion by 2031 under a 6.31% CAGR.
Which region will grow the fastest through 2031?
Asia-Pacific is expected to post the highest 7.02% CAGR thanks to large-scale telepathology programs and healthcare digitization.
Which component segment is expanding quicker, hardware or software?
Software platforms lead growth at 6.63% CAGR as laboratories prioritize AI analytics and cloud workflows.
Why are fluorescence scanners gaining traction?
Fluorescence units enable multiplex biomarker panels crucial for precision oncology, driving a 6.90% CAGR.
How do data-privacy rules affect adoption?
Regulations such as GDPR and HIPAA require localized storage and encrypted transfer, adding cost and complexity but ensuring patient protection
Page last updated on:


