
Optical Microscopes Market Size and Share
Market Overview
| Study Period | 2020 - 2031 |
|---|---|
| Market Size (2026) | USD 3.08 Billion |
| Market Size (2031) | USD 4.05 Billion |
| Growth Rate (2026 - 2031) | 5.62 % |
| Fastest Growing Market | Asia Pacific |
| Largest Market | North America |
| Market Concentration | Medium |
Major Players *Disclaimer: Major Players sorted in no particular order Image © Mordor Intelligence. Reuse requires attribution under CC BY 4.0. | |
Optical Microscopes Market Analysis by Mordor Intelligence
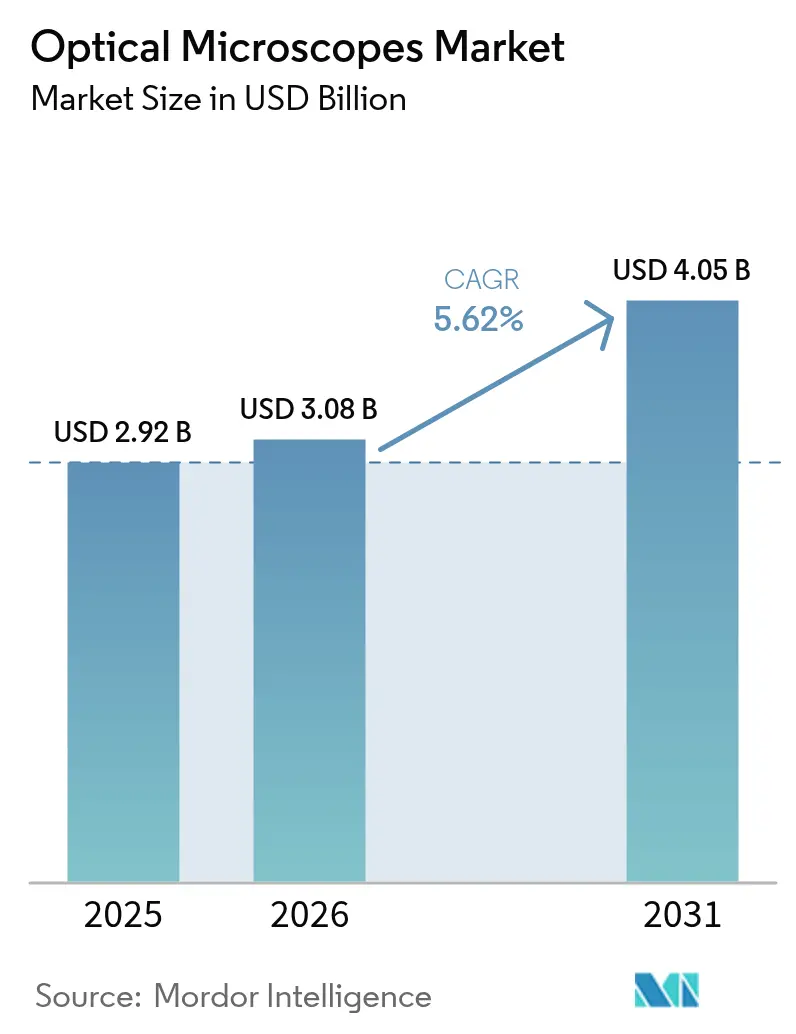
The Optical Microscopes Market size is expected to increase from USD 2.92 billion in 2025 to USD 3.08 billion in 2026 and reach USD 4.05 billion by 2031, growing at a CAGR of 5.62% over 2026-2031.
Instrument demand continues to shift toward platforms that merge optics with software, as inverted configurations dominate live-cell protocols while digital and opto-digital models accelerate because AI analytics shorten image-processing time. Government life-science allocations, valued at more than USD 18 billion in 2025, redirect capital toward super-resolution and confocal systems that fit regenerative-medicine and nanotechnology pipelines. Simultaneously, open-source hardware and 3D-printed optics compress margins for entry-level units, prompting incumbents to bundle cloud analytics and subscription service plans. Asia-Pacific now captures the fastest incremental revenue as semiconductor inspection in China and pathology digitization in India outpace mature North American replacement cycles.
Key Report Takeaways
- By product category, inverted microscopes held a 36.55% share of the optical microscopes market share in 2025, whereas digital and opto-digital platforms are growing at a 9.85% CAGR through 2031.
- By end user, hospitals and clinics commanded 34.53% of 2025 revenue, yet pharmaceutical and biotechnology companies are advancing at an 8.75% CAGR over the same horizon.
- By geography, North America led with 38.55% revenue share in 2025, while Asia-Pacific is projected to expand at an 8.12% CAGR to 2031.
Note: Market size and forecast figures in this report are generated using Mordor Intelligence’s proprietary estimation framework, updated with the latest available data and insights as of 2026.
Global Optical Microscopes Market Trends and Insights
Drivers Impact Analysis*
| Driver | (~) % Impact on CAGR Forecast | Geographic Relevance | Impact Timeline |
|---|---|---|---|
| Rising funding for life-science R&D | +1.2% | Global, with concentration in North America, EU, and Japan | Medium term (2-4 years) |
| Digitization & AI-enabled image analytics | +1.5% | North America, EU, APAC core (China, Japan, South Korea) | Short term (≤ 2 years) |
| Surge in nanotechnology-driven demand | +0.9% | APAC core (China, Taiwan, South Korea), North America | Long term (≥ 4 years) |
| Quantum-dot & adaptive-optics breakthroughs | +0.7% | North America, EU, Japan | Long term (≥ 4 years) |
| Open-source hardware & 3D-printed optics | +0.4% | Global, with early adoption in academic institutions | Medium term (2-4 years) |
| Smartphone-linked field microscopes | +0.6% | APAC, MEA, South America | Short term (≤ 2 years) |
| Source: Mordor Intelligence | |||
Rising Funding for Life-Science R&D
National budgets raise a durable floor under the optical microscopes market. The United States allocated USD 48.6 billion to the National Institutes of Health in 2025, with 12% flowing into shared instrumentation that heavily features advanced imaging suites[1]National Institutes of Health, “Budget Overview 2025,” nih.gov. Horizon Europe set aside EUR 7.2 billion (USD 7.9 billion) for health research the same year, prioritizing digital pathology networks that integrate whole-slide scanners with fluorescence microscopes. Japan’s JPY 1.1 trillion (USD 7.4 billion) life-science budget spotlights super-resolution platforms for neuroscience. Because live-cell and regenerative-medicine projects depend on environmental control and multichannel fluorescence, inverted and confocal systems see the largest purchase orders. Procurement cycles of 18–24 months mean instruments booked in 2025 keep factory lines active through 2027, insulating the optical microscopes market from near-term budget volatility.
Digitization and AI-Enabled Image Analytics
Machine-learning algorithms now shape buying criteria more than optical specifications. Zeiss rolled out the Arivis Cloud in early 2025, allowing users to process terabyte-scale datasets without onsite GPU clusters, and charges annual subscriptions of USD 5,000–25,000. Nikon’s NIS-Elements AI cut manual cell-tracking time by 85% during pharmaceutical beta trials, underscoring value beyond hardware. Pharmaceutical screeners that generate millions of images weekly gravitate to platforms that bundle analytics, reinforcing recurring-revenue models across the optical microscopes market. FDA guidance from 2024 clarified the regulatory path for AI-driven pathology software, accelerating validation pipelines. Adoption remains uneven in connectivity-limited regions, yet global bandwidth upgrades are closing this gap.
Surge in Nanotechnology-Driven Demand
Optical microscopes remain indispensable above the 7-nanometer node where electron microscopy throughput falters. Taiwanese and South Korean fabs purchased systems for wafer-level defect inspection because vacuum-based tools slow line yield. Materials scientists investigating 2D crystals depend on polarization and differential-interference contrast to map orientation without beam-induced damage. Synthetic-biology teams use fluorescence imaging to track real-time assembly of protein condensates, a use case incompatible with cryo-electron methods that freeze dynamics. Government nanotechnology initiatives in the United States (USD 1.8 billion) and China (CNY 50 billion) steer funds into domestic instrumentation, fostering regional supply chains that diversify the optical microscopes market.
Quantum-Dot and Adaptive-Optics Breakthroughs
Quantum dots now enable 10-color multiplexing with 20-nanometer precision in STED workflows, yet commercial uptake lags because setups cost USD 495,000 or more and require expert alignment. Adaptive optics borrowed from astronomy compensate refractive error in thick tissues and already cut imaging time by 40% on Olympus FV4000 systems. Although fewer than 5% of 2025 confocal shipments included adaptive modules, machine-learning-guided wavefront correction shortens calibration from hours to minutes, pointing to broader future penetration within the optical microscopes market.
Restraints Impact Analysis*
| Restraint | (~) % Impact on CAGR Forecast | Geographic Relevance | Impact Timeline |
|---|---|---|---|
| Resolution gap vs. electron microscopy | -0.8% | Global, with acute impact in semiconductor and materials labs | Medium term (2-4 years) |
| Price erosion from low-cost Asian brands | -1.1% | North America, EU, with spillover to MEA and South America | Short term (≤ 2 years) |
| Sustainability rules on rare-earth / Hg | -0.5% | EU, North America, with emerging impact in APAC | Long term (≥ 4 years) |
| Precision-glass supply-chain fragility | -0.6% | Global, with acute risk in APAC and EU | Medium term (2-4 years) |
| Source: Mordor Intelligence | |||
Resolution Gap versus Electron Microscopy
Sub-nanometer demands in 3-nanometer transistor inspection keep electron microscopes ahead, pushing optical vendors to promote correlative workflows rather than direct competition. Asia installed more than 18,000 electron systems in 2025, and China alone captured 42% of new units[3]Nikkei Asia, “Hitachi High-Tech Electron Microscope Production,” asia.nikkei.com . Optical platforms now emphasize triage, screening large wafer areas quickly before SEM zoom-in, an approach embodied in Zeiss Shuttle & Find software[2]Carl Zeiss AG, “Arivis Cloud Platform,” zeiss.com.
Price Erosion from Low-Cost Asian Brands
Motic, Keyence, and AmScope undercut Western pricing by 30–40%, prompting U.S. and EU institutions to replace legacy hardware more cheaply. A 2025 survey of 240 U.S. pathology labs showed 38% had switched at least one microscope brand within two years. Incumbents now bundle extended warranties and training to justify premiums, but commoditization risk persists across the optical microscopes market.
*Our forecasts treat driver/restraint impacts as directional, not additive. The impact forecasts reflect baseline growth, mix effects, and variable interactions.
Segment Analysis
By Product: Live-Cell Workflows Drive Inverted Dominance
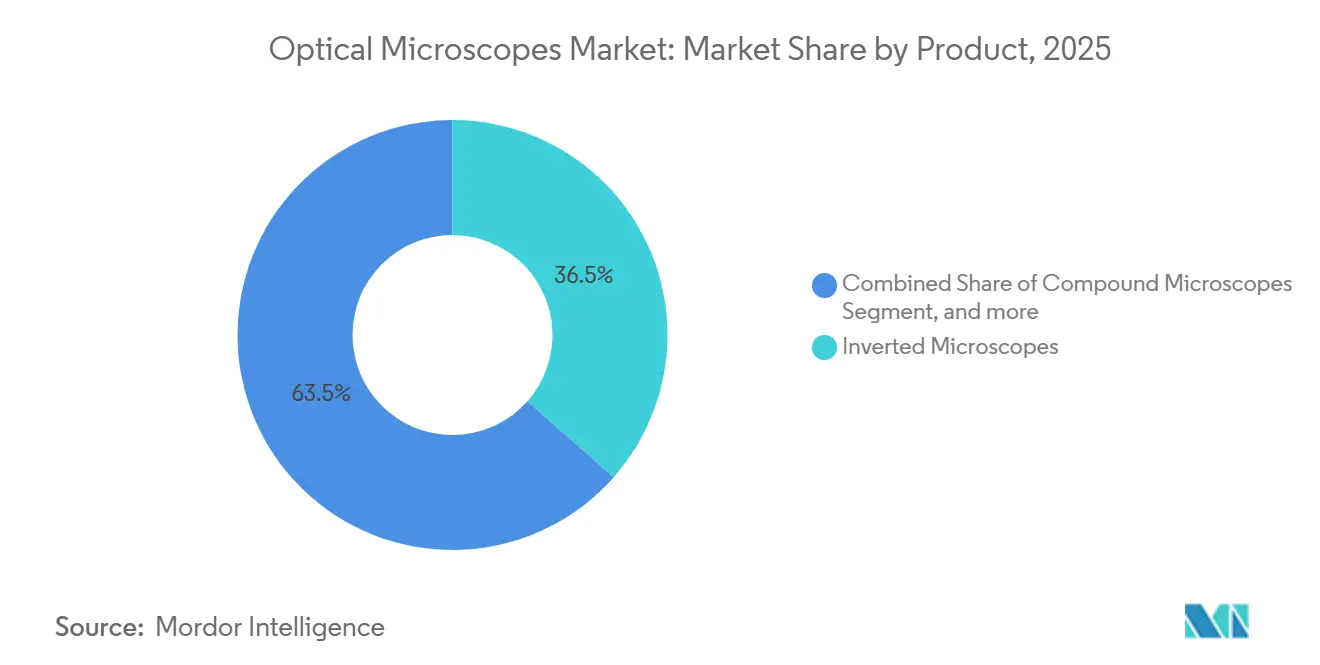
Inverted microscopes captured 36.55% of the optical microscopes market share in 2025, reflecting their central role in cell-culture and organoid assays that require incubation chambers and multi-well plate compatibility. Pharmaceutical researchers prefer inverted formats because continuous drug-response studies demand undisturbed environmental control. Digital and opto-digital models, growing 9.85% annually, push the optical microscopes market size higher by integrating 4K sensors with autofocus routines that allow inexperienced users to collect data fast.
Digital designs also serve quality-control technicians in electronics and metals who need depth-of-field stacking rather than eyepiece ergonomics. Compound and stereo microscopes remain staples in education and low-resource clinics, yet their limited connectivity slows replacement in advanced labs. Super-resolution variants such as STED and SIM add premium revenue though ship in smaller volumes. Collectively, product dynamics reveal a barbell structure where high-end research platforms and low-cost education units both expand, while conventional mid-tier upright systems face substitution.



By End User: Pharma R&D Outpaces Clinical Adoption
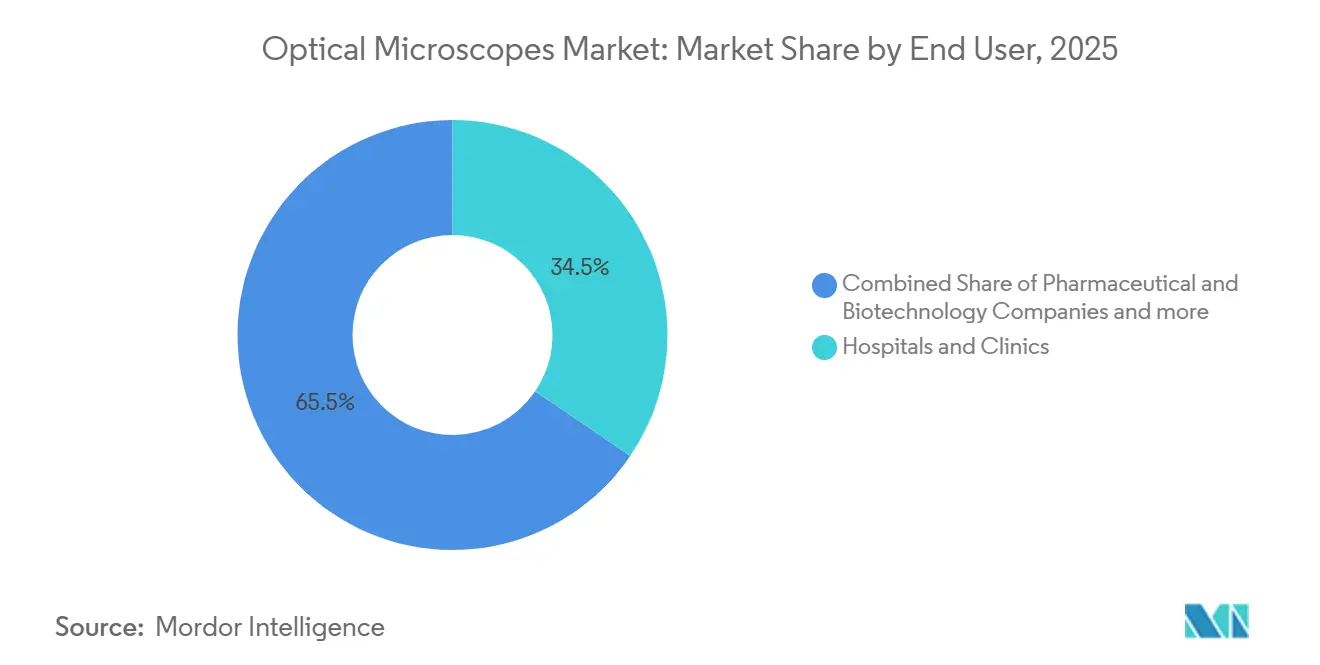
Hospitals and clinics delivered 34.53% of 2025 revenue but advance slowly because reimbursement codes for digital pathology remain fragmented in major health systems. Capital budgets also juggle genomic sequencers and mass spectrometers, limiting microscope refresh. In contrast, pharmaceutical and biotechnology firms are growing at 8.75% and now prioritize automated imaging cores that pair confocal units with high-content screening robots, enlarging the optical microscopes market size within private-sector labs.
Academic institutes benefit from shared-instrumentation grants that socialize purchase costs and concentrate demand for cutting-edge multiphoton and light-sheet systems. Diagnostic labs move to automated hematology analyzers, trimming compound-microscope orders. The fragmented tail—covering forensics, veterinary, and environmental labs—buys fit-for-purpose models and increasingly turns to Asian suppliers on price, diffusing brand concentration across the optical microscopes market.
Geography Analysis
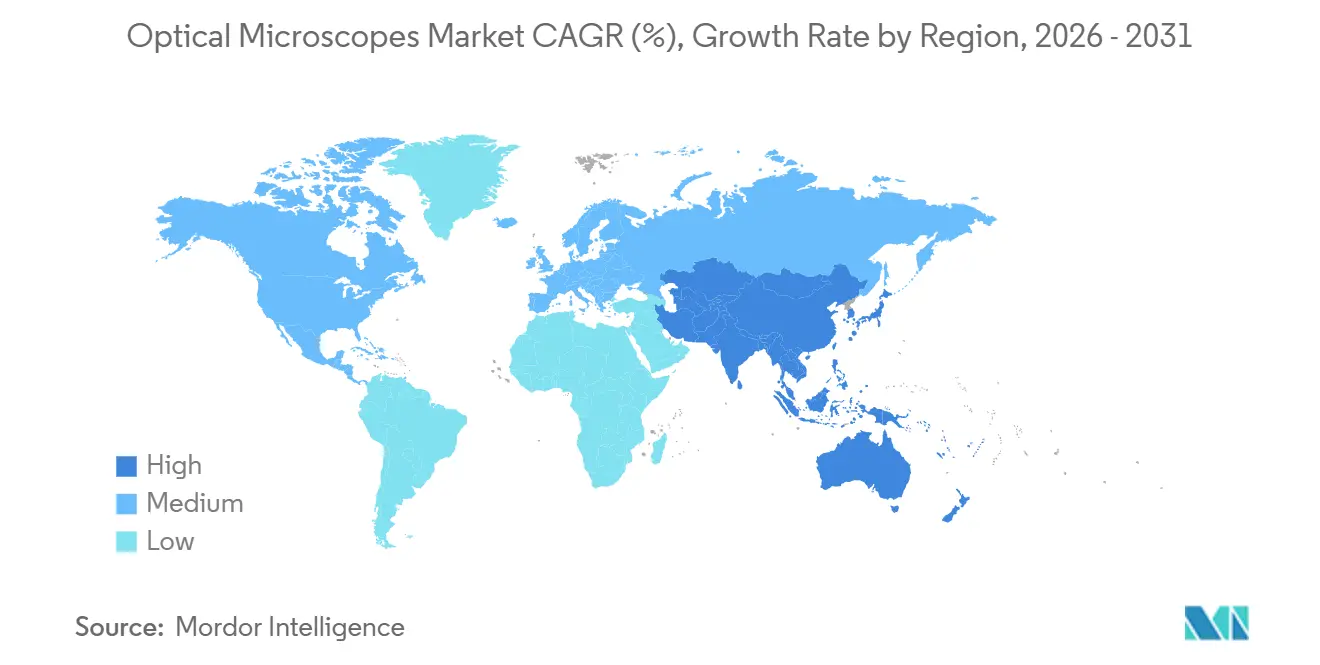
North America accounted for 38.55% of global revenue in 2025, anchored by dense biotech clusters in California, Massachusetts, and New Jersey. The region’s replacement sales keep the optical microscopes market robust as AI modules prompt mid-cycle upgrades. Canada grows modestly because federal research budgets tightened, while Mexico eyes future uptake tied to public-university modernization.
Europe follows, led by Germany’s imaging-center network, yet Brexit-related customs delays raised total cost of ownership in the United Kingdom, curbing 2025 shipments. Horizon Europe funds limit downside, but Italy and Spain lag due to austerity in university spending. Market saturation pushes vendors to focus on cloud software subscriptions that add revenue without physical import hurdles.
Asia-Pacific advances at an 8.12% CAGR, paced by China’s semiconductor fabs purchasing more than 4,200 optical microscopes in 2025. India’s pathology-chain consolidation fuels digital adoption, and South Korea and Australia invest in nanotechnology and precision-medicine infrastructure. Japan sees longer replacement cycles as life-science enrollments decline, yet high-value super-resolution orders persist. The optical microscopes market also gains in Middle East and Africa where Saudi Arabia and the United Arab Emirates build research universities, while South America’s growth clusters in Brazil through shared-instrument funds.

Regulatory Landscape
Regulation diverges by use case, with many medical microscopes and accessories treated as lower-risk devices while software-enabled and specialty systems can trigger additional oversight. In the United States, the FDA regulates medical devices under the Federal Food, Drug, and Cosmetic Act, and medical microscopes span multiple classifications. For example, microscopes and accessories under 21 CFR 864.3600 are generally Class I (general controls) and often 510(k)-exempt, while other configurations and intended uses may fall under Class II pathways that require premarket notification. A major compliance anchor for manufacturers selling into the US is the FDA Quality Management System Regulation (QMSR), which became effective on February 2, 2026, shifting quality-system expectations and inspection alignment for device manufacturers.
In Europe, medical microscopes fall within the scope of Regulation (EU) 2017/745 (MDR), with conformity assessment, technical documentation, and post-market surveillance obligations shaped by device classification and intended purpose. Policy activity continued in 2025 through an EU-level proposal (COM(2025) 1023) aimed at reducing administrative burden under MDR/IVDR, which is relevant for vendors managing certification timelines and documentation load. International standards also anchor design and procurement, including ISO 18221:2025 for microscopes with digital imaging displays (minimum information for user imaging performance) and ISO 10936 for operation microscopes used in surgery. Together, these standards reinforce the market shift toward digital and opto-digital platforms with standardized performance disclosure.
Competitive Landscape
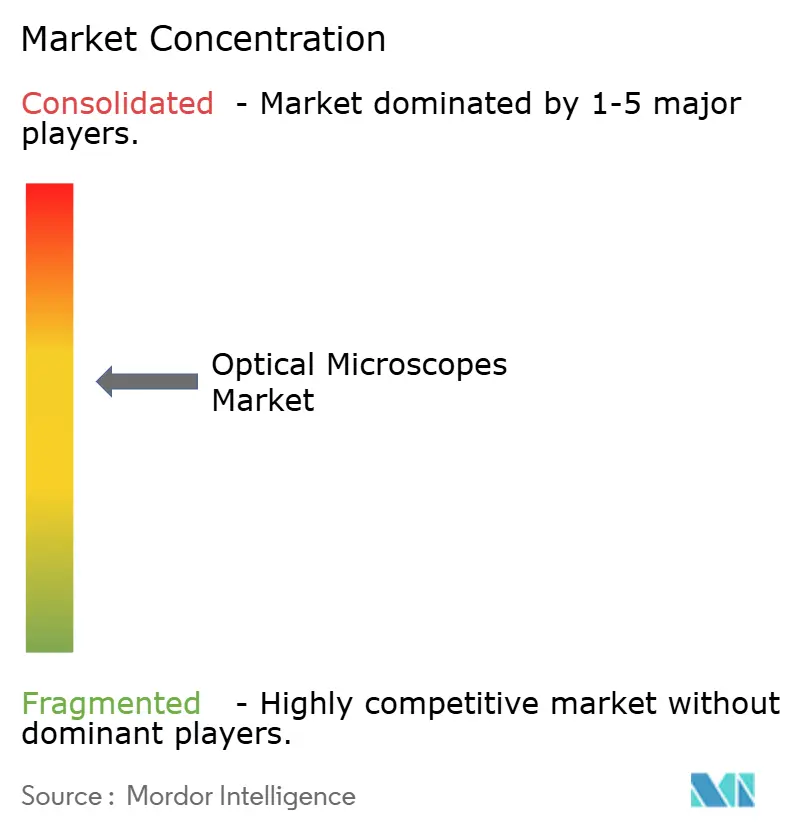
The top five suppliers—Carl Zeiss, Nikon, Olympus, Leica Microsystems, and others—command a sizeable revenue slice, yet mid-tier share erodes as Keyence, Motic, and other Asian entrants underprice entry-level units. Incumbents buffer profitability by bundling Arivis, NIS-Elements, or LAS X subscriptions that lock users into proprietary ecosystems. Zeiss acquired light-sheet specialist Luxendo in 2024 to broaden developmental-biology offerings, and Nikon partnered with Evident in 2025 to co-develop AI pathology pipelines, illustrating ecosystem convergence that elevates service and software importance across the optical microscopes market.
Open-source consortia introduce additional pressure. Projects like OpenFlexure democratize basic imaging while Thorlabs sells modular frames to researchers who prefer to build systems à la carte. Disruptors such as Nanolive commercialize holographic tomography, pushing label-free live-cell imaging into mainstream consideration. Strategic moves now include vertical integration of cameras and illumination to secure components against export-control shocks, especially after 2024 restrictions on advanced sensors.
Geopolitics further fragments supply chains. Chinese policy encourages domestic instrumentation firms to replace Western imports, and U.S. export licenses add lead-time uncertainty. As a result, Western vendors localize service centers and explore component dual-sourcing. The optical microscopes market thus tilts toward a regionalized model where software stickiness and after-sales support decide loyalty more than optics alone.
Optical Microscopes Industry Leaders
Carl Zeiss AG
Leica Microsystems
Meiji Techno
Nikon Instruments Inc.
Olympus Corporation
- *Disclaimer: Major Players sorted in no particular order

Market Opportunities and Future Outlook
Near-term whitespace concentrates in platforms that combine optical hardware with computational methods to raise usable resolution and throughput without a proportional increase in system complexity. In 2026, multiple peer-reviewed advances highlighted adaptive optics and computational correction for multiphoton super-resolution imaging, alongside hybrid solid-liquid optics enabling aberration-corrected, submicron-resolution light-sheet microscopy using standard air objectives. These directions match buyer demand already visible in the market for faster analysis and more automated 3D and volumetric workflows, creating room for vendors to differentiate with software-first upgrades (autofocus, deconvolution, segmentation, and cloud processing) sold alongside confocal, multiphoton, and light-sheet configurations.
Clinical and translational opportunity also extends to label-free and real-time imaging methods that reduce staining and sample-prep friction in time-sensitive settings. 2026 research progress in dynamic full-field optical coherence microscopy (d-FF-OCM) and high numerical aperture confocal volumetric mesoscope concepts underscores continued innovation in deep-tissue and in vivo subcellular dynamics imaging, relevant to intraoperative and high-throughput pathology-adjacent use cases when paired with validated workflows. On commercialization, regulatory-process simplification and compliance readiness are practical enablers. The FDA QMSR effective date in February 2026 raises the value of turnkey quality documentation, traceability, and service models, while ISO 18221:2025 supports more standardized communication of digital imaging performance, helping procurement teams compare digital and opto-digital microscopes beyond core optical specifications.
Recent Industry Developments
- March 2026: Leica Microsystems launched the Viventis SCAPE light sheet microscope to deliver fast volumetric imaging using standard sample carriers. The release expands access to light-sheet style 3D imaging beyond highly customized setups, supporting broader adoption in advanced research and translational workflows where throughput and gentle imaging are procurement drivers.
- August 2025: Evident announced the acquisition of Pramana, Inc., a developer of digital pathology solutions. The deal strengthens Evident's ability to offer integrated hardware and software pathways for pathology digitization, reinforcing the market shift from standalone optical instruments to workflow-centric platforms.
- March 2024: Bruker completed its acquisition of Phasefocus, a label-free optical cell imaging company known for Livecyte. This adds label-free live-cell imaging capability to Bruker's portfolio and increases competitive pressure on traditional fluorescence-dependent workflows by expanding the range of noninvasive imaging options.


Research Methodology Framework and Report Scope
Market Definition and Coverage
This market covers revenue earned from optical microscope systems used to magnify and visualize samples using visible light optics. It includes instruments sold to laboratory, clinical, and industrial users, counted at the point of sale as equipment value.
Scope exclusions: We exclude consumables and lab reagents, service contracts, and standalone software upgrades that are not bundled with a microscope shipment.
Segmentation Overview
- By Product
- Compound Microscopes
- Stereo Microscopes
- Digital / Opto-Digital Microscopes
- Inverted Microscopes
- Fluorescence & Super-Resolution Systems
- Confocal & Multiphoton Microscopes
- By End User
- Hospitals & Clinics
- Academic & Research Institutes
- Diagnostic Laboratories
- Pharmaceutical & Biotechnology Companies
- Other End Users
- By Geography
- North America
- United States
- Canada
- Mexico
- Europe
- Germany
- United Kingdom
- France
- Italy
- Spain
- Rest of Europe
- Asia-Pacific
- China
- India
- Japan
- Australia
- South Korea
- Rest of Asia-Pacific
- Middle East and Africa
- GCC
- South Africa
- Rest of Middle East and Africa
- South America
- Brazil
- Argentina
- Rest of South America
- North America
Data Sources, Market Sizing, and Validation
Desk Research
Desk research starts with building a clean view of demand signals that can be tracked each year without relying on paywalled sources. We use public datasets such as World Bank indicators, OECD health and science statistics, UNESCO R&D intensity series, US Census and Eurostat trade and production tables, and customs tariff schedules for optical instruments to ground the macro view and cross-border movement.
To connect those signals to the optical microscopes business, we review company filings and investor presentations, tender portals and procurement releases, and public announcements on university and hospital lab expansions, along with peer reviewed papers that cite optical imaging adoption in life sciences and materials testing. We also check patent databases to track technology direction, such as digital imaging integration and fluorescence capability. These sources are not exhaustive, and we use additional public references for data collection, cross-checks, and gap clarification during the build.
Primary Interviews and Surveys
Primary work is used to pressure test model assumptions and close gaps that desk research cannot reliably answer, such as pricing bands by microscope class, typical replacement cycles, and purchase triggers across end users. We speak with manufacturers, channel partners, and large institutional buyers across APAC, EMEA, and the Americas, and then use the feedback to calibrate mix shifts and regional adoption timing.
Distribution of primary research fieldwork respondents
| Company type | Respondent position | Region |
|---|---|---|
| Top tier: 27% | CXOs: 22% | APAC: 45% |
| Mid tier: 51% | Functional/Unit leaders: 30% | EMEA: 32% |
| Smaller Players: 22% | Managers: 48% | Americas: 23% |
Market-Sizing & Forecasting
Our core sizing uses top-down logic, where optical instrument demand is reconstructed using end user spending capacity and lab activity signals, then refined by product mix and regional penetration. Since no single data series covers the full market, the model is built around a few practical inputs, including R&D spending trends, growth in clinical and diagnostic testing infrastructure, higher education and research lab funding patterns, electronics and semiconductor quality inspection activity, and typical replacement cycles for microscopes in institutional settings.
We corroborate results using selective bottom-up approximations, mainly by checking a sampled set of supplier revenues, channel feedback on unit shipments, and an average selling price range by microscope class (digital and opto-digital systems, stereo, compound, inverted, and fluorescence capable systems). Where unit visibility is weak in smaller countries, we fill gaps using proxy adoption rates linked to lab counts and research intensity, followed by a review with regional experts to keep assumptions realistic.
For forecasting, scenario analysis is applied around a central track, since purchasing can move with public funding timing and capital budget cycles. The forward view is shaped by expected changes in R&D intensity, healthcare capex, academic lab expansions, and gradual ASP movement as digital imaging features become more common.
Data Validation & Update Cycle
Validation is done by triangulating model outputs against independent signals, including import and export direction, institutional procurement activity, and implied unit volumes from pricing bands. When large variances show up, we isolate the drivers, revisit the assumptions, and re-contact selected respondents so the gap is explained before final sign-off.
Each study goes through multi-step analyst reviews, including checks for regional consistency, growth rate reasonableness, and any step changes that do not align with known funding or industry cycles. Reports are refreshed annually, and interim updates are made when material events occur. Before delivery, a final update pass is completed so clients receive the latest adjusted view.
Mordor Intelligence's Optical Microscopes Market Estimate Compared With Other Published Estimates
Published market sizes for optical microscopes can look far apart, even when the topic sounds the same, because the counted products, the base year, and the price logic are not consistent across studies. Differences also show up when one estimate relies more on end user facility spending while another leans more on instrument revenue reporting.
Import and export direction for optical instruments, combined with end user procurement signals from hospitals, universities, and industrial labs, are the evidence checks that keep Mordor Intelligence's estimate anchored to shipped equipment value for optical microscopes rather than a broader microscopy device spend. The remaining spread usually comes from whether adjacent categories are pulled in (for example, wider microscopy devices), how digital systems are classified, how ASP progression is handled over time, and how often underlying assumptions are refreshed when funding cycles shift.
Benchmark comparison
| Source | Market Size | Gaps in Research Methodology |
|---|---|---|
| Mordor Intelligence | USD 3.08 B (2026) | |
| Industry Publisher A | USD 2.80 B (2025) | Uses a different base year and a lens and application taxonomy that can shift what is counted as an optical microscope, and it may blend some component level value with system revenue in parts of the model. |
| Global Consultancy B | USD 5.20 B (2023) | Starts from a broader facility and end use spend view with an earlier base year, which can inflate totals if wider microscopy devices or non-equipment items are included, and the faster CAGR implies more aggressive ASP and adoption assumptions. |
Looking at the three figures together, the main takeaway is that scope boundaries and base year choices explain most of the difference, and then pricing and adoption assumptions widen the gap. By tying the model to observable demand signals and then checking it with practical bottom-up reality tests, we keep the final number traceable to clear steps that can be repeated during updates.


Key Questions Answered in the Report
What is the projected value of the optical microscopes market by 2031?
It is forecast to reach USD 4.05 billion by 2031 on a CAGR of 5.62%.
Which product category holds the largest revenue share?
Inverted microscopes led with a 36.55% share in 2025.
Which region is expanding fastest?
Asia-Pacific is advancing at an 8.12% CAGR through 2031, driven by semiconductor and pathology investments.
Why are digital and opto-digital platforms growing rapidly?
They pair high-resolution sensors with AI analytics that cut image-processing time, expanding at a 9.85% CAGR.
How are vendors defending margins amid price pressure?
Leading brands bundle cloud analytics, lengthen service contracts, and acquire niche technology firms to differentiate beyond hardware.
Page last updated on:


 Your data is secure and never sold or shared.


