Surgical Microscopes Market Size and Share
Market Overview
| Study Period | 2020 - 2031 |
|---|---|
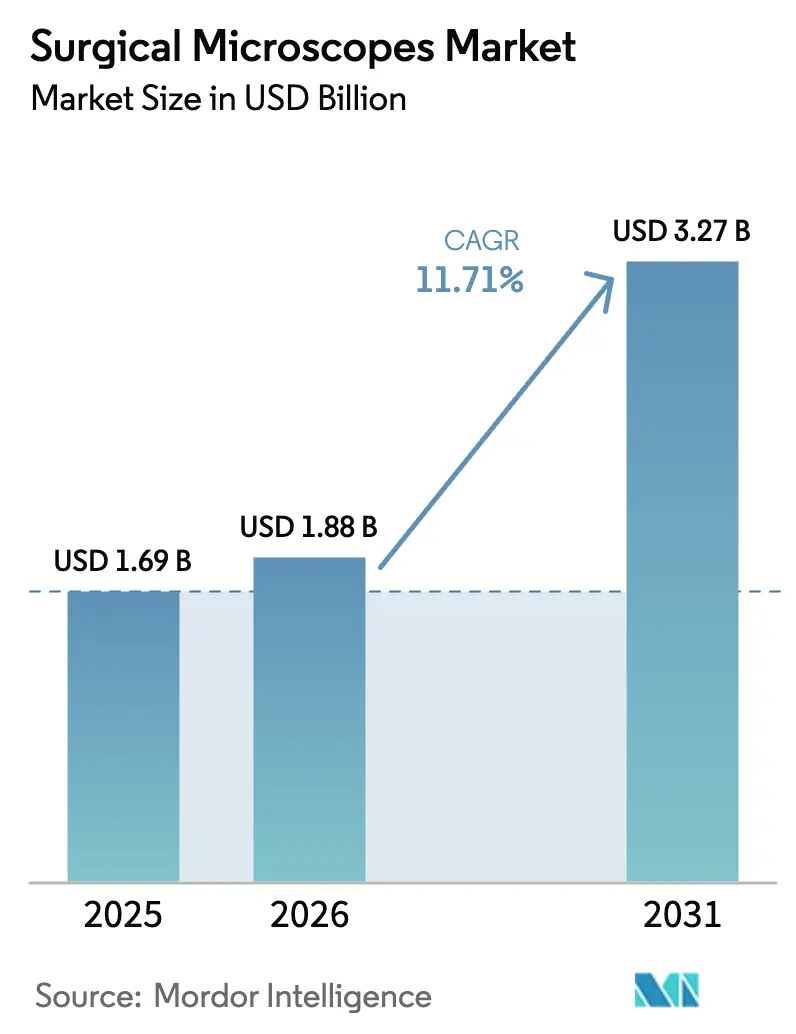
| Market Size (2026) | USD 1.88 Billion |
| Market Size (2031) | USD 3.27 Billion |
| Growth Rate (2026 - 2031) | 11.71% CAGR |
| Fastest Growing Market | Asia Pacific |
| Largest Market | North America |
| Market Concentration | Medium |
Major Players *Disclaimer: Major Players sorted in no particular order Image © Mordor Intelligence. Reuse requires attribution under CC BY 4.0. | |
Surgical Microscopes Market Analysis by Mordor Intelligence
The surgical microscopes market size is estimated to reach USD 1.88 billion in 2026 and is projected to climb to USD 3.27 billion by 2031, growing at an 11.71% CAGR. The expansion is driven by the rapid adoption of hybrid operating rooms, increasing fluorescence-guided tumor resections, and the integration of robotic navigation, which is rendering legacy optical systems obsolete. Aging populations and the growing burden of chronic diseases continue to drive up procedure volumes; however, the decisive catalyst is the convergence of digital imaging, artificial intelligence guidance, and intraoperative optical coherence tomography, which unlocks replacement demand, especially in precision-dependent specialties. Competitive intensity is increasing as 3D exoscopes erode the traditional share in ENT and spine cases, pushing incumbents to accelerate the development of digital features. Meanwhile, government subsidies in Europe and Asia-Pacific are shortening upgrade cycles in secondary hospitals, and dental service organizations are standardizing microscope protocols to improve clinical outcomes. Taken together, these elements signal an industry shifting from unit expansion toward technology-driven value capture, a dynamic that sustains double-digit growth for the surgical microscopes market.
Key Report Takeaways
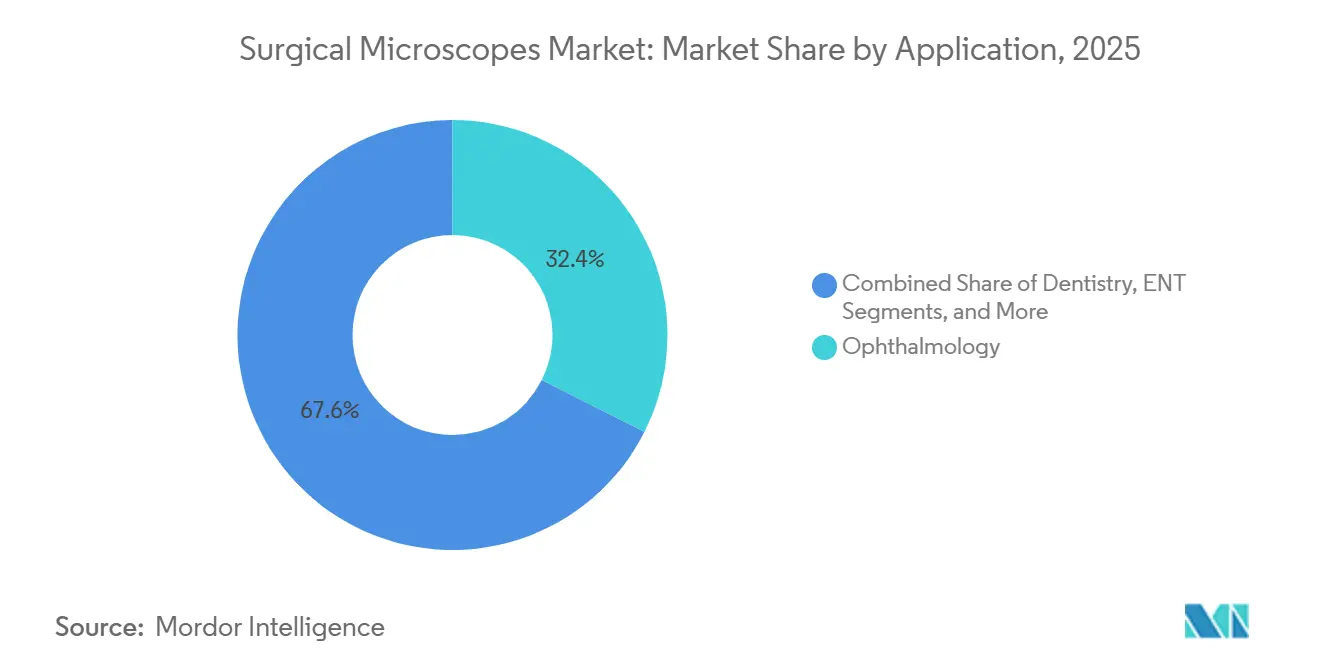
- By application, ophthalmology led with 32.45% revenue share in 2025, while dentistry is projected to post a 13.54% CAGR through 2031.
- By end user, hospitals accounted for 54.56% revenue share in 2025, whereas ambulatory surgical centers are forecast to expand at a 14.67% CAGR through 2031.
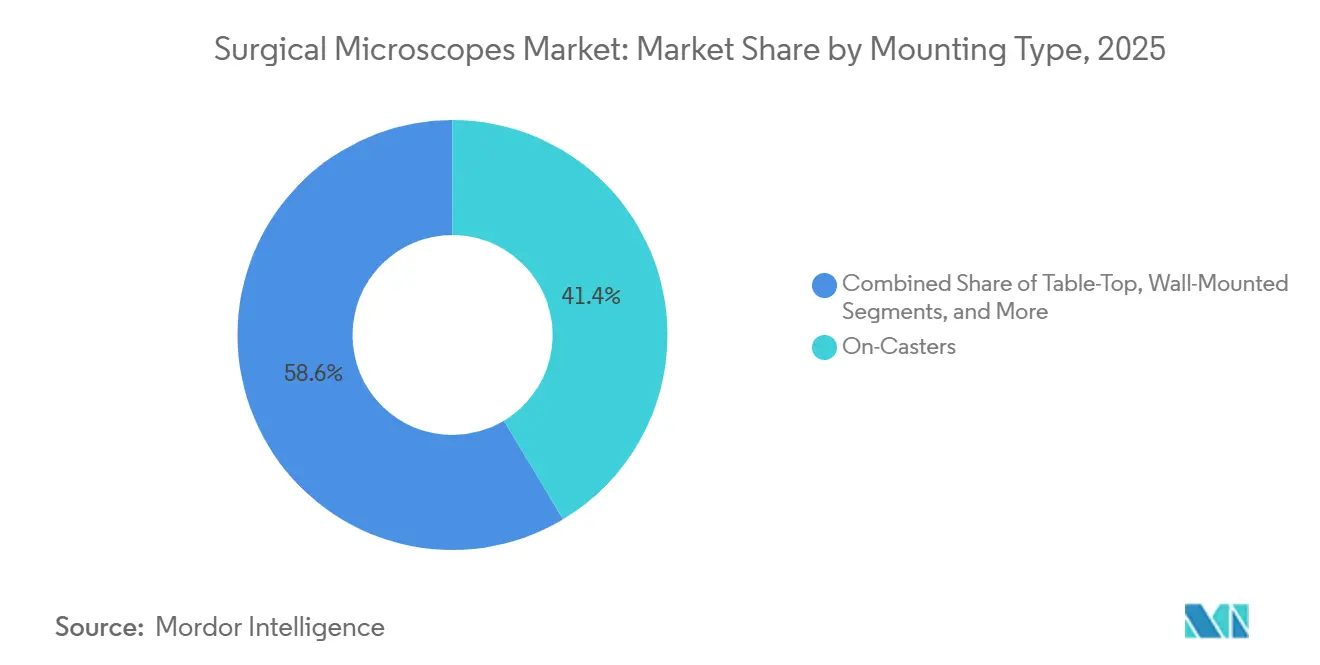
- By mounting type, on-caster systems captured 41.45% of installations in 2025; however, ceiling-mounted platforms are projected to grow at a 13.32% CAGR through 2031.
- By 2025, conventional optical microscopes held a 37.45% unit share, and AR/VR-enhanced systems are expected to advance at a 14.01% CAGR through 2031.
- By geography, North America accounted for 41.45% of the 2025 surgical microscopes market size, whereas the Asia-Pacific region is expanding at a 12.43% CAGR during the forecast period.
Note: Market size and forecast figures in this report are generated using Mordor Intelligence’s proprietary estimation framework, updated with the latest available data and insights as of January 2026.
Global Surgical Microscopes Market Trends and Insights
Drivers Impact Analysis*
| Driver | (~) % Impact on CAGR Forecast | Geographic Relevance | Impact Timeline |
|---|---|---|---|
| Rising surgical volumes and minimally invasive procedures adoption | +2.8% | Global, with APAC and Middle East leading volume growth | Medium term (2-4 years) |
| Aging population and chronic disease burden | +2.1% | North America, Europe, Japan core; spillover to urban APAC | Long term (≥ 4 years) |
| Technological advancements in digital imaging, 4K/3D, and fluorescence visualization | +3.2% | North America and Western Europe early adoption; APAC tier-1 cities following | Short term (≤ 2 years) |
| Government programs subsidizing hybrid OR upgrades in secondary hospitals | +1.6% | Europe (Italy, Spain), APAC (China, India), select Middle East markets | Medium term (2-4 years) |
| Emerging dental service organizations standardizing microscope use | +1.4% | North America DSO consolidation; early adoption in Australia, UK | Medium term (2-4 years) |
| Integration with surgical robotics and AI-driven navigation unlocking replacement cycles | +2.3% | North America, Germany, Japan; premium tertiary centers globally | Short term (≤ 2 years) |
| Source: Mordor Intelligence | |||
Rising Surgical Volumes and Minimally Invasive Procedures Adoption
Global surgical procedures exceeded 310 million in 2024, and more than 40% of elective cases in high-income countries used minimally invasive techniques. Smaller incisions drive demand for higher magnification, which directly lifts the surgical microscopes market. The Asia-Pacific and Middle East regions are experiencing double-digit case growth, driven by expanding insurance coverage, whereas North America and Europe are showing modest volume growth but increasing complexity, which favors fluorescence-guided visualization. Early adopters of 4K digital microscopes reported a 15-20% reduction in procedure time for complex spine fusions, thereby increasing operating room throughput. Hospitals view these gains as integral to value-based care metrics, encouraging replacement of optical systems before end-of-life.
Aging Population and Chronic Disease Burden
Cataract procedures reached 32.9 million globally in 2024 and are projected to surpass 50 million by 2030, driven by demographic aging in China, India, and Southeast Asia. Older patients present comorbidities that heighten the need for precision visualization to minimize surgical trauma, favoring microscopes with OCT and heads-up displays. Fluorescence-guided oncology resections are also climbing; a 2024 Neuro-Oncology study showed gross total resection rates rising from 65% to 85% when 5-ALA visualization was used. Such evidence accelerates replacement demand in tertiary centers.
Rapid Technology Upgrades (4K, Fluorescence, AR)
Suppliers now embed voice control, AI-assisted depth cues and 4K-3D sensors into flagship models such as the KINEVO 900 S. Comparable platforms from Olympus merge 3D optics with infrared fluorescence so that a single tower supports multiple specialties. Hospitals that invested five years ago face a capability gap versus new systems, prompting accelerated replacement even when existing microscopes remain functional. The result is a technology-driven upswing that keeps average selling prices firm despite rising volumes.
Technological Advancements in Digital Imaging, 4K/3D, And Fluorescence Visualization
Carl Zeiss introduced the KINEVO 900 S in 2024, combining 5-ALA fluorescence, infrared angiography, and 4K optics in one platform[1]Carl Zeiss Meditec, “KINEVO 900 S Product Launch,” zeiss.com. Leica’s ARveo 8 overlays pre-operative MRI scans in real time, shortening navigation setup by up to 15 minutes. European neurosurgery departments adopting 5-ALA rose from 42% in 2022 to 68% in 2025, illustrating rapid technology diffusion. Recorded 4K streams are training AI models for automated margin detection, creating a cycle whereby data capture and analytics reinforce equipment upgrades.
Government Programs Subsidizing Hybrid OR Upgrades In Secondary Hospitals
Italy allocated EUR 500 million (USD 545 million) in 2024 for secondary hospital hybrid OR retrofits, while India earmarked INR 12,000 crore (USD 1.44 billion) for surgical infrastructure in 2025. Ceiling-mounted microscopes are eligible for reimbursement, thereby accelerating their adoption in facilities that previously favored mobile systems. Vendors are tailoring configurations with simplified workflows and bundled training to meet procurement rules, ensuring that the surgical microscopes market directly benefits from stimulus funds.
Restraints Impact Analysis*
| Restraint | (~) % Impact on CAGR Forecast | Geographic Relevance | Impact Timeline |
|---|---|---|---|
| High capital and maintenance costs | -1.9% | Global, acute in emerging APAC, Latin America, and Africa | Short term (≤ 2 years) |
| Shortage of microscope-trained surgical personnel | -1.3% | Emerging APAC, Middle East, Latin America; pockets in rural North America and Europe | Medium term (2-4 years) |
| Competitive displacement by 3D exoscopes and heads-up displays | -1.1% | North America, Western Europe, Japan; premium segments globally | Short term (≤ 2 years) |
| Stringent sterilization and sensor failure risks leading to downtime | -0.8% | Global, with higher impact in high-humidity tropical regions | Medium term (2-4 years) |
| Source: Mordor Intelligence | |||
High Capital and Maintenance Costs
A fully configured fluorescence microscope exceeds USD 500,000, and annual service contracts add USD 40,000-60,000. Inflation in 2024-2025 increased component prices, prompting 54% of U.S. hospitals to defer planned purchases[2]American Hospital Association, “2025 Capital Spending Survey,” aha.org. Leasing and refurbished channels expand access yet introduce utilization risk when case volumes fall short. Import tariffs and currency swings inflate prices by up to 35% in India and Southeast Asia, slowing penetration outside tier-1 cities. Digital platforms incur software fees and sensor recalibration costs, thereby widening the total-cost-of-ownership gap compared to optical systems and limiting their uptake in resource-constrained settings.
Competitive Displacement By 3D Exoscopes and Heads-Up Displays
Olympus ORBEYE and Karl Storz VITOM 3D undercut entry-level microscopes by 30-40% in the USD 150,000-250,000 price tier. A 2025 Spine study showed exoscopes cutting surgeon neck and back strain by 40%, resonating with aging workforces. However, exoscopes struggle to achieve magnifications above 25× and lack integrated fluorescence, which limits their appeal in neurosurgery. Incumbent vendors are bundling heads-up modules to replicate ergonomic gains while retaining optical excellence, a tactic expected to slow exoscope encroachment through 2028.
*Our forecasts treat driver/restraint impacts as directional, not additive. The impact forecasts reflect baseline growth, mix effects, and variable interactions.
Segment Analysis
By Application: Dentistry Surges as DSOs Standardize Protocols
The dental segment of the surgical microscopes market is forecasted to grow at a 13.54% CAGR through 2031, the fastest among all applications. Ophthalmology contributed a 32.45% revenue share in 2025, supported by high cataract and retinal procedure volumes; however, its pace is moderating in developed economies, where penetration is nearing saturation. Neurosurgery and spine surgery benefit from fluorescence-guided resections, which increase gross total resection rates to 85%, especially after the adoption of 5-ALA in 2024-2025. ENT applications face cost-driven substitution from exoscopes, while gynecology and urology employ microscopes primarily in fertility and reconstructive procedures. Oncology segments rely on intraoperative fluorescence to cut positive-margin rates, supporting adoption despite budget pressures.
Bulk procurement by DSOs is reshaping price elasticity, allowing manufacturers to lower per-unit costs and still preserve margins through volume. The average installed system age in U.S. ophthalmology clinics reached 8.2 years in 2025, indicating a potential near-term replacement surge for 4K and OCT-enabled platforms. These forces collectively sustain growth in the surgical microscopes market size for clinical specialties that prioritize visualization clarity.


By End User: ASCs Capture Outpatient Migration
Hospitals generated 54.56% of revenue in 2025; however, the surgical microscopes market share is shifting to ambulatory surgical centers as outpatient models gain traction. ASCs are projected to advance at a 14.67% CAGR through 2031, driven by payer incentives and patient preference for lower-cost care settings. Dental clinics reinforce momentum as DSO consolidation scales microscope deployment. Specialty outpatient centers and fertility clinics are adopting compact table-top units to match constrained floor plans.
Manufacturers are responding with ceiling-mounted systems optimized for quick turnover and lower service complexity. A 2024 study by the Ambulatory Surgery Center Association found that ASCs with more than 1,000 cataract cases per year achieved payback within 24 months. Hospitals, meanwhile, concentrate on complex glioblastoma and retinal procedures that require high-end fluorescence and robotic integration. Such differentiation keeps hospitals the dominant shareholder even as growth tilts to ASCs, balancing the surgical microscopes market size across care settings.
By Mounting Type: Ceiling Systems Gain in Hybrid ORs
On-casters systems captured 41.45% of installations in 2025, valued for portability and lower upfront cost. Nevertheless, ceiling-mounted microscopes are projected to grow at a 13.32% CAGR, driven by government-funded hybrid operating room retrofits in Europe and the Asia-Pacific region. Wall-mounted and tabletop designs serve ENT, plastic, and dental clinics, while robotic-arm mounts are used in specialized neurosurgery and spine suites.
Italy’s EUR 500 million upgrade fund and India’s Ayushman Bharat allocation accelerate ceiling-mount uptake, shortening replacement cycles by up to three years. Facilities appreciate workflow gains—such as rapid sterility maintenance and unobstructed floor space that justify the added capital. Mobile systems will keep relevance in ASCs and smaller hospitals, but ceiling infrastructures will dominate incremental installations, underpinning growth in the surgical microscopes market.
By Technology: AR/VR Platforms Redefine Visualization
Conventional optical systems held 37.45% unit share in 2025, but AR/VR-enhanced platforms are expected to log a 14.01% CAGR to 2031, the fastest trajectory in the surgical microscopes market. Optical and fluorescence units remain workhorses in neurosurgery and oncology. Digital 4K microscopes are gaining popularity in ophthalmology and ENT for their teaching and recording benefits, whereas OCT-integrated systems are serving the niche of retinal surgery. Robotic-ready offerings gain traction in tertiary centers that value AI-guided navigation.
Leica’s ARveo 8 overlays MRI data, cutting setup time and improving tumor-margin detection. A 2025 Journal of Neurosurgery report revealed AR microscopes halve positive-margin rates in skull-base tumors, strengthening the value proposition. Conventional optics retain a foothold in budget-sensitive clinics; however, declining component costs and growing evidence will likely shift demand toward digital features, expanding the surgical microscopes market size for premium configurations.
Geography Analysis
North America contributed 41.45% of the revenue in 2025, supported by robust reimbursement for fluorescence-guided procedures and early adoption of 4K technology, but growth is slowing as penetration in tertiary centers plateaus. The region is expected to face a replacement wave in 2026-2027, with installed microscopes averaging 7.8 years of age, indicating an imminent need for upgrades to AR-enabled units. Europe shows moderate expansion, aided by subsidy programs in Italy, Spain, and Eastern Europe that fund hybrid or retrofits of older ORs. Brexit-related supply chain challenges and elevated energy costs temper investment in the UK and Germany, yet public stimulus offsets private hesitation.
The Asia-Pacific region is the fastest-growing, with a 12.43% CAGR from 2026 to 2031. China is expected to invest over USD 1 trillion in healthcare infrastructure by 2025, adding 1,200 tertiary hospitals since 2020, each requiring multiple microscopes. India’s Ayushman Bharat drives a 12-15% annual growth in surgical volume in tier-2 and tier-3 cities, where microscope penetration remains below 30%. Japan’s aging population sustains demand for ophthalmology and neurosurgery, although procurement shifts to refurbished units to contain costs. Emerging regional suppliers are filling value-segment gaps as tariffs inflate Western pricing, thereby broadening competitive dynamics within the surgical microscopes market.
The Middle East and Africa benefit from medical tourism investments; the UAE and Saudi Arabia invested USD 8 billion between 2023 and 2025 to attract international patients. Adoption remains urban-centric, with premium units installed in centers of excellence. South American growth is hindered by currency volatility; Brazil’s real depreciation in 2024 increased import costs, prompting hospitals to postpone upgrades. South Africa’s private hospital groups continue to make selective purchases, while most public budgets prioritize primary care over advanced imaging. Overall, region-specific catalysts and constraints create a patchwork of growth rates, yet the collective momentum keeps the global surgical microscopes market on a steady double-digit trajectory.


Competitive Landscape
The surgical microscopes market demonstrates moderate concentration. Carl Zeiss Meditec, Leica Microsystems, and Alcon collectively hold roughly 55-60% of the global revenue, while regional manufacturers and exoscope suppliers dilute their dominance. Platform strategies that bundle fluorescence, AI navigation, and robotic interfaces raise switching costs; however, they expose incumbents to price-sensitive segments where stripped-down optical systems meet basic needs. Patent filings underscore digital priorities: Zeiss submitted 14 patents on fluorescence and AR visualization, and Leica filed 9 patents on OCT integration and robotic interfaces between 2024 and 2025.
White-space opportunities abound in dental clinics and ASCs where incumbents lack distribution depth. Smaller vendors, such as Global Surgical Corporation and Seiler Instrument, leverage direct sales and flexible financing to win market share. Meanwhile, Olympus ORBEYE and Karl Storz VITOM 3D disrupt the USD 150,000-250,000 tier, forcing microscope manufacturers to accelerate the development of heads-up displays.
Regulatory agility is a differentiator; vendors securing CE marks within nine months of FDA clearance gain a one-year head start in Europe. Chinese manufacturers, such as Zhenjiang Zhongtian, undercut Western pricing by up to 50%, especially in the Asia-Pacific region, thereby tightening margins. Competitive dynamics, therefore, hinge on balancing premium feature integration with cost-competitive offerings to serve diverse buyer profiles across the surgical microscopes market.
Surgical Microscopes Industry Leaders
Carl Zeiss AG
Topcon Corporation
Alcon Inc.
Haag-Streit (Metall Zug Group)
Danaher Corp. (Leica Microsystems)
- *Disclaimer: Major Players sorted in no particular order

Recent Industry Developments
- July 2025: Leica Microsystems launched ARveo 8x, a hybrid surgical microscope designed for neurosurgery, spine, and reconstructive procedures, featuring advanced optics and 3D visualization. It offers enhanced illumination and fluorescence imaging, providing surgeons with clear, detailed views during complex surgeries.
- July 2025: ZEISS Medical Technology announced that their PENTERO 800 S surgical microscope has received approval from China's NMPA. This advanced microscope is designed for neurosurgery, spine surgery, plastic surgery, reconstructive surgery, and ENT surgery. It features enhanced optical capabilities, seamless performance, and integrated digital connectivity for precise surgical outcomes.
- April 2025: Leica Microsystems has introduced the Proveo 8x, a 3D digital ophthalmic microscope with real-time 3D imaging capabilities. The launch took place at the Annual Meeting of The American Society of Cataract and Refractive Surgery (ASCRS) in California. This new technology aims to enhance precision in eye surgeries.


Research Methodology Framework and Report Scope
Market Definitions and Key Coverage
According to Mordor Intelligence, the surgical microscopes market covers factory-built optical or opto-digital microscopes that deliver magnified, illuminated, three-dimensional views inside an operating suite across specialties such as ophthalmology, neurosurgery, ENT, dentistry, and plastic reconstruction. Units tracked include on-casters, tabletop, wall, ceiling, and robotic-arm mounts supplied as complete systems with integrated camera or fluorescence modules.
Scope exclusion: exoscopes and general laboratory microscopes are not counted.
Segmentation Overview
- By Application
- Dentistry
- ENT
- Gynecology & Urology
- Neurosurgery & Spine
- Ophthalmology
- Plastic & Reconstructive
- Oncology
- By End User
- Hospitals
- Ambulatory Surgical Centers
- Dental Clinics
- Specialty & Outpatient Facilities
- Academic & Research Institutes
- By Mounting Type
- On-Casters
- Table-Top
- Wall-Mounted
- Ceiling-Mounted
- Robotic-Arm Integrated
- By Technology
- Conventional Optical
- Optical + Fluorescence
- Digital / 4K Microscopes
- AR / VR-Enhanced
- OCT-Integrated
- Robotic-Ready
- Geography
- North America
- United States
- Canada
- Mexico
- Europe
- Germany
- United Kingdom
- France
- Italy
- Spain
- Rest Of Europe
- Asia-Pacific
- China
- Japan
- India
- South Korea
- Australia
- Rest Of Asia-Pacific
- Middle East And Africa
- GCC
- South Africa
- Rest Of Middle East And Africa
- South America
- Brazil
- Argentina
- Rest Of South America
- North America
Detailed Research Methodology and Data Validation
Primary Research
Targeted interviews with operating room directors, biomedical engineers, and regional distributors in North America, Europe, and fast-growing Asia-Pacific validated utilization rates, refurbishment cycles, and typical ASP erosion.
Short surveys with cataract surgeons and ENT specialists clarified technology upgrade triggers (4 K visualization, AR overlays) and helped refine penetration assumptions.
Desk Research
We began with structured screening of non-paywalled tier-1 datasets, including World Health Organization surgical volume statistics, United Nations age-cohort tables, U.S. FDA 510(k) listings for new microscope models, and customs harmonized codes for HS 901180 across 17 countries. Trade association material from the American Academy of Ophthalmology, European Association for Neurosurgical Societies, and Dental Tribune added procedure incidence and adoption curves. Annual reports, 10-Ks, and investor decks revealed average selling prices (ASPs) and installed base shifts. Where granularity was limited, Mordor analysts tapped paid feeds such as D&B Hoovers for company revenue splits and Dow Jones Factiva for shipment news. This list is illustrative; many further sources informed data capture and sense-checking.
Market-Sizing & Forecasting
A top-down rebuild started with procedure counts (e.g. global cataract surgeries, neurosurgical craniotomies) multiplied by average microscope usage ratios, which are then cross-checked through sampled ASP × unit shipments from supplier roll-ups. Bottom-up estimates anchor segment splits where hospital procurement data exist. Key variables like geriatric population share, outpatient surgery mix, price compression per technology tier, and on-casters share of new installs drive our multivariate regression forecast to 2030. Scenario analysis tests capital budget swings and regulatory shocks, with gaps in bottom-up data bridged by regional proxy indicators like hybrid-OR construction starts.
Data Validation & Update Cycle
Outputs pass variance checks against historical import values, peer benchmarks, and prior editions. Senior reviewers sign off only after anomalies are resolved. We refresh annually and trigger mid-cycle updates if recalls, major launches, or currency moves change market math.
Why Mordor's Surgical Microscopes Baseline Commands Confidence
Published numbers often diverge because firms pick different device inclusions, ASP curves, and refresh rhythms.
By aligning scope to true surgical room microscopes and by revisiting variables yearly, Mordor delivers a dependable starting point for planning.
Benchmark comparison
| Market Size | Anonymized source | Primary gap driver |
|---|---|---|
| USD 1.68 B | Mordor Intelligence | - |
| USD 1.51 B | Global Consultancy A | excludes digital-only models; relies on static 2019 ASPs |
| USD 1.97 B | Industry Tracker B | aggressive procedure growth assumption; limited regional validation |
Differences mainly trace back to device scope and unchecked ASP drift.
By triangulating real procedure data with live price points, Mordor presents a balanced, transparent baseline decision-makers can trust.


Key Questions Answered in the Report
What is the current value of the surgical microscopes market?
The market is valued at USD 1.88 billion in 2026 and is projected to hit USD 3.27 billion by 2031.
Which clinical area leads demand for surgical microscopes?
Ophthalmology holds the lead, contributing 32.45% of 2025 revenue.
Which end-user segment is expanding fastest?
Ambulatory surgical centers are forecast to grow at a 14.67% CAGR through 2031.
How are AR/VR features reshaping adoption?
AR/VR-enhanced platforms deliver real-time overlays and reduce setup time, driving a 14.01% CAGR to 2031.
What regional market shows the highest growth rate?
Asia-Pacific is advancing at a 12.43% CAGR, led by investments in China and India.
Page last updated on:


