Live Cell Imaging Market Size and Share
Market Overview
| Study Period | 2020 - 2031 |
|---|---|
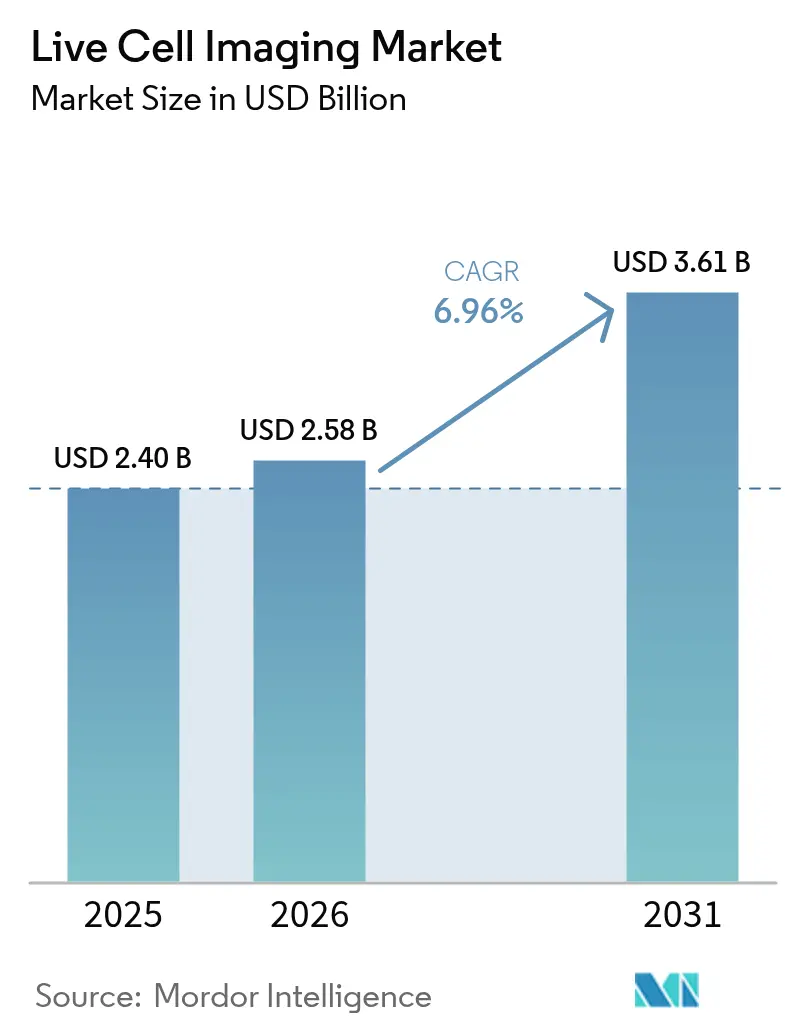
| Market Size (2026) | USD 2.58 Billion |
| Market Size (2031) | USD 3.61 Billion |
| Growth Rate (2026 - 2031) | 6.96% CAGR |
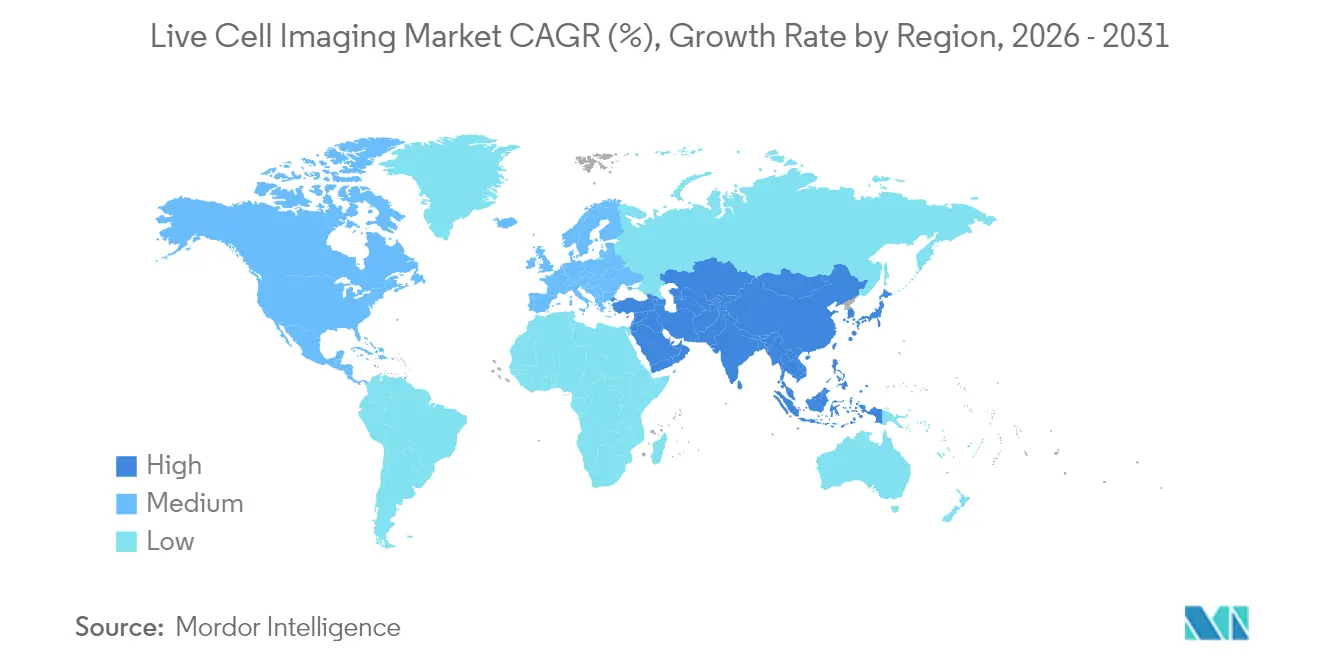
| Fastest Growing Market | Asia-Pacific |
| Largest Market | North America |
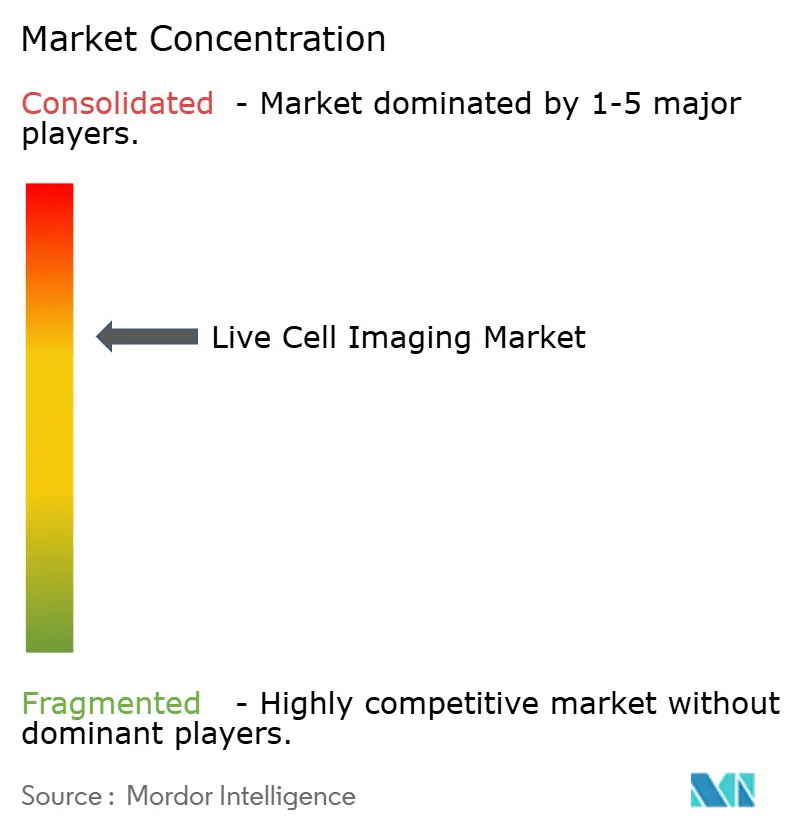
| Market Concentration | Medium |
Major Players *Disclaimer: Major Players sorted in no particular order Image © Mordor Intelligence. Reuse requires attribution under CC BY 4.0. | |
Live Cell Imaging Market Analysis by Mordor Intelligence
The live cell imaging market size was valued at USD 2.4 billion in 2025 and estimated to grow from USD 2.58 billion in 2026 to reach USD 3.61 billion by 2031, at a CAGR of 6.96% during the forecast period (2026-2031). Uptake of high-content screening (HCS) platforms integrated with artificial intelligence (AI), stronger funding for oncology and immunology research, and miniaturized instrumentation that fits inside standard incubators collectively underpin this expansion. Pharmaceutical companies shorten pre-clinical timelines by deploying AI-enabled imaging systems that cut image-acquisition cycles by 40% while retaining nanoscale resolution, thereby compressing the time to first-in-human studies. At the same time, label-free modalities such as holotomography help researchers observe organoids in real time without fluorophores, reducing phototoxicity concerns and preserving cellular physiology for weeks. Competitive activity has shifted from pure optics toward end-to-end solutions that blend hardware, software, and cloud-based analytics, prompting strategic collaborations and targeted acquisitions across the microscopy value chain. Regionally, North America continues to command the largest live cell imaging market share because of established funding avenues and a dense pharmaceutical footprint, yet Asia-Pacific now delivers the steepest volume gains as local governments court biotechnology investment and harmonize regulations.
Key Report Takeaways
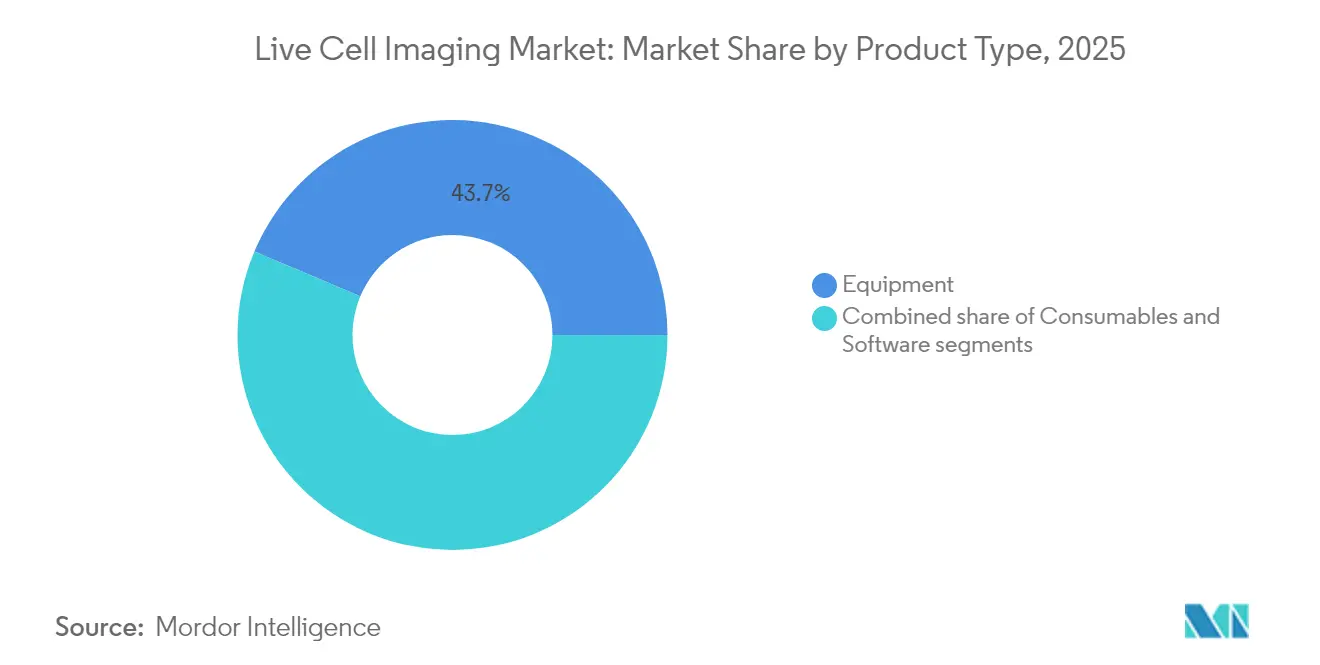
- By product type, equipment dominated with 43.65% of live cell imaging market share in 2025, while consumables are on track to post the fastest 7.63% CAGR through 2031.
- By technology, time-lapse microscopy held 33.55% of the 2025 revenue pool, whereas high-content analysis platforms are projected to expand at an 7.98% CAGR to 2031.
- By application, drug discovery accounted for 8.23% CAGR, outpacing cell biology, which still retained the largest 28.10% revenue block in 2025.
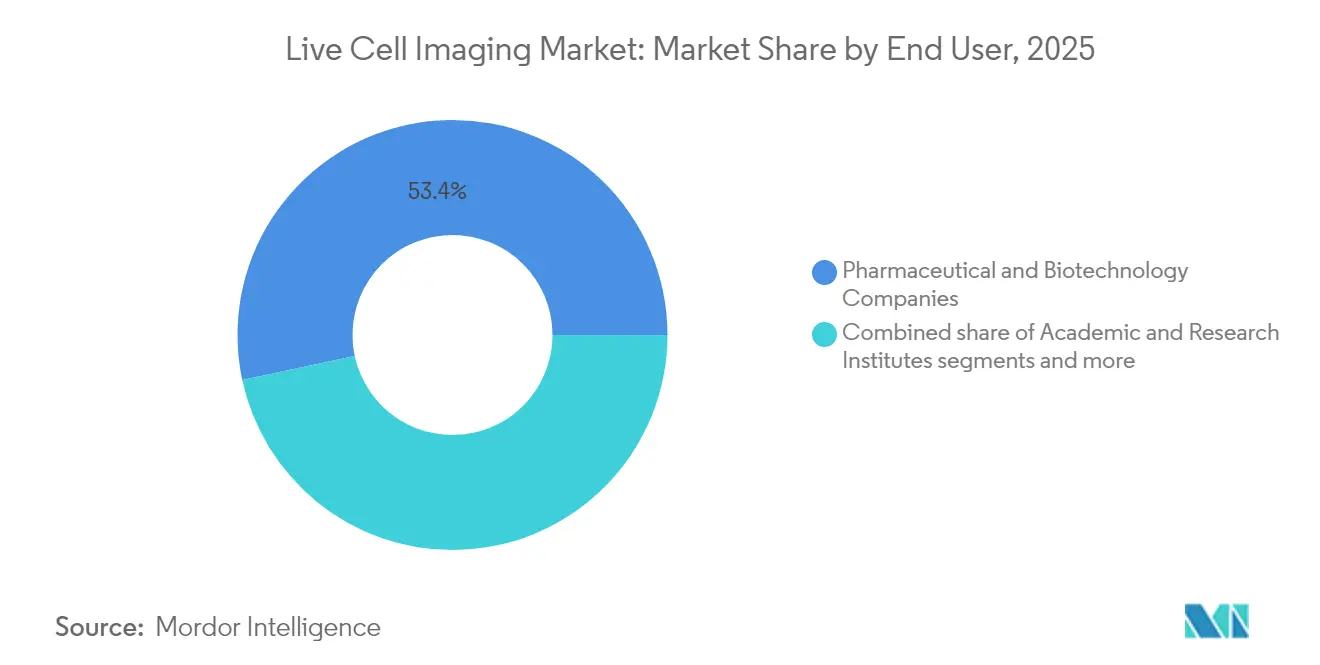
- By end user, pharmaceutical and biotechnology companies captured 53.35% of the live cell imaging market size in 2025, but academic and research institutes are rising fastest at an 8.51% CAGR.
- Regionally, North America led with 41.80% revenue in 2025; Asia-Pacific is expected to register the quickest 8.87% CAGR through 2031.
Note: Market size and forecast figures in this report are generated using Mordor Intelligence’s proprietary estimation framework, updated with the latest available data and insights as of 2026.
Global Live Cell Imaging Market Trends and Insights
Driver Impact Analysis*
| Driver | (~) % Impact on CAGR Forecast | Geographic Relevance | Impact Timeline |
|---|---|---|---|
| Advances in high-content screening platforms | +1.8% | Global, with concentration in North America & Europe | Medium term (2-4 years) |
| Surge in cancer & immunology research funding | +1.5% | Global, led by North America, expanding to Asia-Pacific | Short term (≤ 2 years) |
| Growing adoption of AI-assisted image analytics | +1.2% | North America & Europe core, spill-over to Asia-Pacific | Medium term (2-4 years) |
| Expansion of contract bio-manufacturing for CGT | +1.0% | North America & Europe, emerging in Asia-Pacific | Long term (≥ 4 years) |
| Miniaturisation of live-cell microscopes | +0.8% | Global, with early adoption in developed markets | Medium term (2-4 years) |
| Rising demand for label-free imaging modalities | +0.7% | Global, with research institution focus | Long term (≥ 4 years) |
| Source: Mordor Intelligence | |||


Advances in High-Content Screening Platforms
High-content screening systems now integrate machine-learning algorithms that dissect thousands of phenotypic variables per well in minutes, replacing traditional endpoint assays that once required days. Molecular Devices’ ImageXpress HCS.ai platform, launched in January 2025, classifies complex cellular phenotypes with 95% accuracy while shrinking analysis time by 60% Molecular Devices. Pharmaceutical teams leverage such throughput to iterate compound libraries rapidly, trimming early discovery budgets by up to 40% and freeing resources to explore combination therapies. The same automation supports organoid-based precision medicine, where patient-derived tumor models undergo parallel testing against dozens of drug candidates, revealing bespoke treatment paths that would have been cost-prohibitive under manual imaging workflows.
Surge in Cancer & Immunology Research Funding
Legislative appropriations widened research coffers in 2024, lifting demand for sophisticated imaging. The National Cancer Institute received USD 7.22 billion for fiscal 2024, USD 120 million more than 2023, earmarking a substantial slice for imaging tool innovation[1]Source: National Cancer Institute, “Fiscal Year 2024 Appropriation,” cancer.gov . In 2025 the U.S. Department of Defense allocated USD 650 million for prostate-cancer initiatives, again highlighting optical diagnostics and real-time cellular monitoring. These funds accelerate procurement cycles at academic cores, position live cell imaging as standard practice in grant proposals, and catalyze multi-center trials that rely on harmonized imaging protocols to compare immune-tumor interactions across cohorts.
Growing Adoption of AI-Assisted Image Analytics
Pairing convolutional neural networks with live cell datasets has relieved image-analysis bottlenecks that once consumed half of experimental timelines. Deepcell’s partnership with NVIDIA illustrates momentum behind generative AI that automatically annotates cellular sub-populations and predicts differentiation trajectories with >90% fidelity. Such predictive power cultivates data-driven hypothesis generation; scientists can now screen for subtle mitochondrial morphological changes as an early sign of compound toxicity, long before viability assays flag danger. Because AI modules bolt onto existing microscopes via software upgrades, labs can modernize workflows without heavy capital outlays, smoothing technology diffusion in cost-sensitive regions.
Expansion of Contract Bio-Manufacturing for CGT
Cell- and gene-therapy (CGT) pipelines require stringent in-process analytics. Recent FDA draft guidance on optical imaging drugs (January 2025) codifies expectations for imaging-based release testing, prompting contract manufacturing organizations (CMOs) to invest in sterile-enclosure microscopes capable of 24/7 monitoring. These platforms track cell viability, transduction efficiency, and differentiation status in real time, ensuring batch consistency for autologous therapies that leave no room for rework. Asia-Pacific CMOs, buoyed by pro-innovation incentives, increasingly procure such systems to lure multinational sponsors, bolstering regional demand.
Restraint Impact Analysis*
| Restraint | (~) % Impact on CAGR Forecast | Geographic Relevance | Impact Timeline |
|---|---|---|---|
| High acquisition & maintenance costs | -1.4% | Global, more pronounced in emerging markets | Short term (≤ 2 years) |
| Shortage of skilled imaging specialists | -1.1% | Global, acute in Asia-Pacific and developing regions | Medium term (2-4 years) |
| Phototoxicity & photobleaching limitations | -0.8% | Global, affecting research applications | Long term (≥ 4 years) |
| Data-storage & management bottlenecks | -0.6% | Global, infrastructure-dependent | Medium term (2-4 years) |
| Source: Mordor Intelligence | |||
High Acquisition & Maintenance Costs
Advanced confocal or lattice-light-sheet microscopes embedded with AI typically list at USD 500,000–1.5 million, and service contracts add 10–15% of purchase price each year. Consumables—specialized media, microplates, environmental chambers—can drive annual operating outlays above USD 50,000 for busy core facilities. Emerging-market laboratories sometimes pay 20–30% premiums owing to customs duties and volatile exchange rates, stretching grant budgets and delaying upgrades. Consequently, shared-instrument models proliferate, but time-slot constraints can force scientists to compromise experimental design or throughput goals, muting wider market penetration.
Shortage of Skilled Imaging Specialists
Modern imaging suites demand personnel who grasp optical physics, cell physiology, and machine-learning workflows. Universities report vacancies for imaging-core managers remaining open 6–12 months despite aggressive recruitment, while salary escalation pits academic labs against CROs and CMOs. Training pipelines lag behind hardware roll-outs; new PhD programs often allot minimal coursework for quantitative microscopy, compelling institutions to subsidize post-purchase boot camps that extend payback periods. In fast-growing Asia-Pacific clusters, the scarcity is more acute, occasionally forcing equipment to sit idle for quarters until qualified staff arrive.
*Our forecasts treat driver/restraint impacts as directional, not additive. The impact forecasts reflect baseline growth, mix effects, and variable interactions.
Segment Analysis
By Product Type: Equipment Drives Innovation
Equipment captured 43.65% of the live cell imaging market in 2025, translating to roughly USD 1.05 billion of the live cell imaging market size, as pharmaceutical and academic buyers prioritized high-throughput automation. Systems such as Yokogawa’s CQ3000 consolidate confocal, bright-field, and phase-contrast modes in a single chassis, letting assay designers pivot between modalities without sample transfer. Cloud-based analytics embedded inside hardware now parse terabytes of images in near real time, eliminating manual batching queues. Meanwhile, consumables—media optimized for label-free holotomography, micro-patterned multi-well plates, and fluorophore-stabilization buffers—advance at a brisk 7.63% CAGR. Vendors tailor reagents to preserve cellular physiology under long-term illumination, important for week-long organoid studies that previously suffered drift in pH and oxygen tension. Software remains the smallest monetary slice but wields strategic clout because it unlocks AI modules that convert raw image stacks into actionable phenotypes. Subscription licensing tied to algorithm updates ensures vendors book recurring revenue even after hardware saturation.
A second dynamic involves miniaturization. Leica’s bench-top Mica Microhub combines temperature and CO₂ regulation, environmental-adaptive auto-focus, and AI segmentation inside a footprint 65% smaller than legacy wide-field rigs. Such compactness frees space in crowded incubator corridors and facilitates deployment in biosafety-level environments. As equipment density rises, demand for consumables scales multiplicatively—the same lab that once ran two microscopes may now operate six, each requiring dedicated chamber slides and calibration kits. Software stacks that orchestrate fleet management across multiple devices become mandatory, further blending categories.


By Application: Cell Biology Dominates, Drug Discovery Surges
Cell biology retained 28.10% of 2025 revenue given its foundational role across genomics, proteomics, and metabolic studies. Investigators exploit live cell imaging to observe cytoskeletal reorganization, mitochondrial dynamics, and autophagy flux under metabolic stress models pertinent to aging research. Drug discovery, however, posts the strongest 8.23% CAGR and is on course to command a larger slice of live cell imaging market share by 2031. Pharmaceutical groups marry organoid co-cultures with high-content analytics, generating phenotype-rich datasets that feed AI screening funnels. The approach has trimmed attrition in pre-clinical hit-to-lead phases by surfacing toxicity liabilities earlier.
Stem-cell and developmental-biology use cases also ascend, buoyed by regenerative-medicine pipelines that demand longitudinal imaging of differentiation pathways. Holotomography enables researchers to visualize organ-scale morphogenesis in 3D without exogenous labels, crucial for verifying tissue-specific architecture. In cancer-immunology, researchers co-culture T-cells with patient-derived tumor organoids to quantify immune synapse formation, guiding immunotherapy dosing regimens. The frontier of neurobiology benefits from calcium-indicator dyes paired with 100-frame-per-second scanners that map synaptic firing patterns in cortical organoids over minutes instead of milliseconds.
By End User: Pharma Leads, Academia Accelerates
Pharmaceutical and biotechnology companies commanded 53.35% of the live cell imaging market in 2025, correlating to roughly USD 1.29 billion of live cell imaging market size. Their priority is throughput; screens once deemed exhaustive at 10,000 compounds now surpass 500,000 thanks to robotics and AI phenotype clustering. Contract research organizations ride the same wave, offering turnkey imaging pipelines that satisfy regulatory data-integrity criteria, a boon to virtual biotech startups. Academia, growing quickest at 8.51% CAGR, benefits from state-funded imaging cores that amortize expensive hardware across dozens of grant holders. Co-development alliances like Nikon-EMBL grant academics first access to prototype optics while manufacturers receive field validation and public-domain publications that spur commercial demand.
Shared-access paradigms broaden user diversity. A single metropolitan core might serve oncologists testing CAR-T persistence, bioengineers designing vascularized organoids, and infectious-disease labs tracking viral budding. Such variety drives demand for instruments capable of switching between bright-field, spinning-disk confocal, and TIRF modes at a click, plus analytics that classify hundreds of phenotypes irrespective of cell line. Vendor technical-support contracts increasingly bundle on-site specialists to compensate for the talent gap, effectively embedding experts inside institutions and deepening vendor-client lock-in.
By Technology: Time-Lapse Leads, HCA Accelerates
Time-lapse microscopy retained 33.55% revenue leadership in 2025, equivalent to nearly USD 0.81 billion of the live cell imaging market size, because its continuous-imaging lineage supports everything from wound-healing assays to neuronal outgrowth tracking. Recent LED illumination advances cut phototoxicity by 30%, extending viable imaging windows for sensitive stem-cell cultures. HCS, though presently smaller, will compound at an 7.98% CAGR as pharma sponsors substitute phenotypic screens for single-target biochemical assays. Modern HCS arrays can process 4-million images per day, a scale previously confined to genomics. Fluorescence resonance energy transfer (FRET) and fluorescence recovery after photobleaching (FRAP) serve niche mechanistic workflows—protein-protein interactions and membrane-fluidity studies respectively—and exhibit mid-single-digit growth.
Methodological convergence is emerging: HCS platforms now incorporate real-time time-lapse modes, enabling kinetic readouts for every well. Conversely, traditional time-lapse rigs integrate machine-vision routines that score multi-parametric outputs beyond cell count and motility. Research consortia publish standardized illumination recipes such as the PhotoFiTT protocol, curbing phototoxicity without sacrificing temporal resolution. This cross-pollination blurs technology silos and could accelerate replacement cycles as users seek multi-mode flexibility.
Geography Analysis
North America led the live cell imaging market with 41.80% revenue in 2025, sustained by NIH and Department of Defense grants that subsidize equipment turnover every 5–7 years. Top-tier universities routinely refresh HCS fleets to maintain competitiveness for multi-center oncology trials. The FDA’s proactive stance—evident in January 2025 draft guidance on optical-imaging drugs—provides regulatory clarity that spurs commercial R&D spin-outs focused on theranostic imaging. Large pharmaceutical campuses in Massachusetts, California, and Ontario cluster around suppliers, fostering rapid feedback loops that accelerate feature roll-outs. Yet growth is plateauing as most category-leading institutions already operate second-generation AI-ready microscopes; future sales lean on replacement and software-license expansions rather than new-site installs.
Asia-Pacific is projected to record a 8.87% CAGR, the fastest globally. Japan aims to double private biotech capital by 2028, targeting a 15-trillion-yen biotechnology economy by 2030; the roadmap specifically lists imaging infrastructure as a pillar toward cell-therapy commercialization. China expands GMP-grade imaging suites inside new CGT manufacturing parks, using local electronics capability to fabricate sub-assemblies and moderate costs. Harmonized ASEAN medical-device regulations lower barriers for cross-border procurement, letting Singapore-based CROs serve regional trials with standardized imaging protocols.
Europe maintains a robust installed base anchored by pharmaceutical multinationals in Germany, Switzerland, and the United Kingdom. Horizon-Europe grants encourage pan-continental consortia, all of which must deploy harmonized imaging platforms to ensure reproducibility. Environmental stewardship initiatives incentivize LED-illuminated systems that reduce power consumption by up to 30% versus mercury bulbs, aligning with EU Green Deal targets. European Medicines Agency consultations on imaging biomarkers further legitimize hardware investments geared toward companion-diagnostic development. Despite slower aggregate GDP growth, refurbishment cycles remain healthy because research excellence rankings increasingly weigh imaging capacity.

Competitive Landscape
The live cell imaging market is moderately fragmented, with the top five vendors controlling roughly half of the global revenue, leaving ample headroom for niche specialists. Optical stalwarts Danaher (Leica, Molecular Devices), Carl Zeiss, and Nikon leverage long-standing channel networks but now compete on AI analytics as much as on resolution. Danaher’s 2024 tie-up with Stanford University on in vivo imaging algorithms embeds academic insights into product roadmaps, while Zeiss integrates cloud-native ZEN Data Storage to counteract on-premise limitations. Nikon’s 2024 partnership with the European Molecular Biology Laboratory shows the sway of co-creation models that translate fresh biological questions into instrument specs within 12 months.
Start-ups exploit white space by miniaturizing optics for benchtop or even handheld use; several smartphone-based cytometers now achieve sub-micron resolution sufficient for point-of-care hematology. AI-first ventures, typified by Deepcell, license software modules that retrofit onto incumbent microscopes, lowering switching costs for customers who wish to test AI pipelines before wholesale hardware upgrades. Competitive differentiation thus hinges on ecosystem breadth—vendors bundling hardware, AI, and validation kits secure stickier customer relationships than those selling single-function boxes.
Pricing strategies evolve accordingly. Subscription models for AI analysis, data-management, and even hardware leasing mitigate the capex pinch described earlier, broadening addressable segments. Service portfolios—onsite workflow consultancy, accredited training, GMP calibration—grow in importance, particularly for CMOs seeking audit-ready documentation. Vendors that furnish turnkey regulatory dossiers alongside instruments win bids in CGT facilities where compliance timelines are unforgiving. As consolidation accelerates, mid-tier players may either specialize in algorithmic niches, such as rare-cell detection, or accept acquisition offers from conglomerates building comprehensive life-science toolkits.
Live Cell Imaging Industry Leaders
PerkinElmer Inc
Becton, Dickinson and Company
Thermo Fisher Scientific Inc.
Agilent Technologies. Inc.
Olympus Corporation (Evident)
- *Disclaimer: Major Players sorted in no particular order

Recent Industry Developments
- January 2025: Molecular Devices launched the ImageXpress HCS.ai system, pairing AI algorithms with high-content optics to deliver 95% phenotypic-classification accuracy and a 60% reduction in analysis time
- November 2024: Nikon and the European Molecular Biology Laboratory began a joint development program to co-design next-generation microscopy features inside live research labs.


Global Live Cell Imaging Market Report Scope
As per the scope of this report, live-cell imaging techniques allow the real-time examination of every aspect of cellular function under normal and experimental examinations. The Live Cell Imaging Market is Segmented by Product (Equipment, (Standalone Systems, Microscopes, Cell Analyzers, and Image Capturing Devices), Consumables (Reagents and Kits and Other Consumables), and Software and Services), Application (Cell Biology, Developmental Biology, Stem Cell Biology, Drug Discovery, and Other Applications), and Geography (North America, Europe, Asia-Pacific, Middle East and Africa, and South America). The market report also covers the estimated market sizes and trends of 17 countries across major regions globally. The report offers the market size in value terms in USD for all the abovementioned segments.
| Equipment |
| Consumables |
| Software |
| Time-lapse Microscopy |
| Fluorescence Resonance Energy Transfer (FRET) |
| Fluorescence Recovery After Photobleaching (FRAP) |
| High-content / High-content Analysis (HCA) |
| Cell Biology |
| Stem Cells & Developmental Biology |
| Drug Discovery & Screening |
| Cancer & Immunology Research |
| Neurobiology |
| Pharmaceutical & Biotechnology Companies |
| Academic & Research Institutes |
| Contract Research Organisations (CROs) |
| North America | United States |
| Canada | |
| Mexico | |
| Europe | Germany |
| United Kingdom | |
| France | |
| Italy | |
| Spain | |
| Rest of Europe | |
| Asia-Pacific | China |
| India | |
| Japan | |
| South Korea | |
| Australia | |
| Rest of Asia-Pacific | |
| South America | Brazil |
| Argentina | |
| Rest of South America | |
| Middle East and Africa | GCC |
| South Africa | |
| Rest of Middle East and Africa |
| By Product Type | Equipment | |
| Consumables | ||
| Software | ||
| By Technology | Time-lapse Microscopy | |
| Fluorescence Resonance Energy Transfer (FRET) | ||
| Fluorescence Recovery After Photobleaching (FRAP) | ||
| High-content / High-content Analysis (HCA) | ||
| By Application | Cell Biology | |
| Stem Cells & Developmental Biology | ||
| Drug Discovery & Screening | ||
| Cancer & Immunology Research | ||
| Neurobiology | ||
| By End User | Pharmaceutical & Biotechnology Companies | |
| Academic & Research Institutes | ||
| Contract Research Organisations (CROs) | ||
| By Geography | North America | United States |
| Canada | ||
| Mexico | ||
| Europe | Germany | |
| United Kingdom | ||
| France | ||
| Italy | ||
| Spain | ||
| Rest of Europe | ||
| Asia-Pacific | China | |
| India | ||
| Japan | ||
| South Korea | ||
| Australia | ||
| Rest of Asia-Pacific | ||
| South America | Brazil | |
| Argentina | ||
| Rest of South America | ||
| Middle East and Africa | GCC | |
| South Africa | ||
| Rest of Middle East and Africa | ||


Key Questions Answered in the Report
What factors are propelling the live cell imaging market?
AI-enabled high-content screening, increased cancer-research funding, and miniaturized, incubator-friendly microscopes are the main growth levers.
How large will the live cell imaging market size become by 2031?
It is projected to reach USD 3.61 billion, expanding at a 6.96% CAGR during the forecast period (2026-2031).
Which application area is growing fastest?
Drug discovery and screening is rising at an 8.23% CAGR as pharma shifts to phenotypic assays that demand sophisticated imaging.
Why is Asia-Pacific advancing faster than other regions?
Government incentives, expanding CGT manufacturing, and harmonized device regulations collectively drive the region’s 8.87% CAGR.
Page last updated on:


