Floating Liquefied Natural Gas Market Size and Share
Market Overview
| Study Period | 2021 - 2031 |
|---|---|
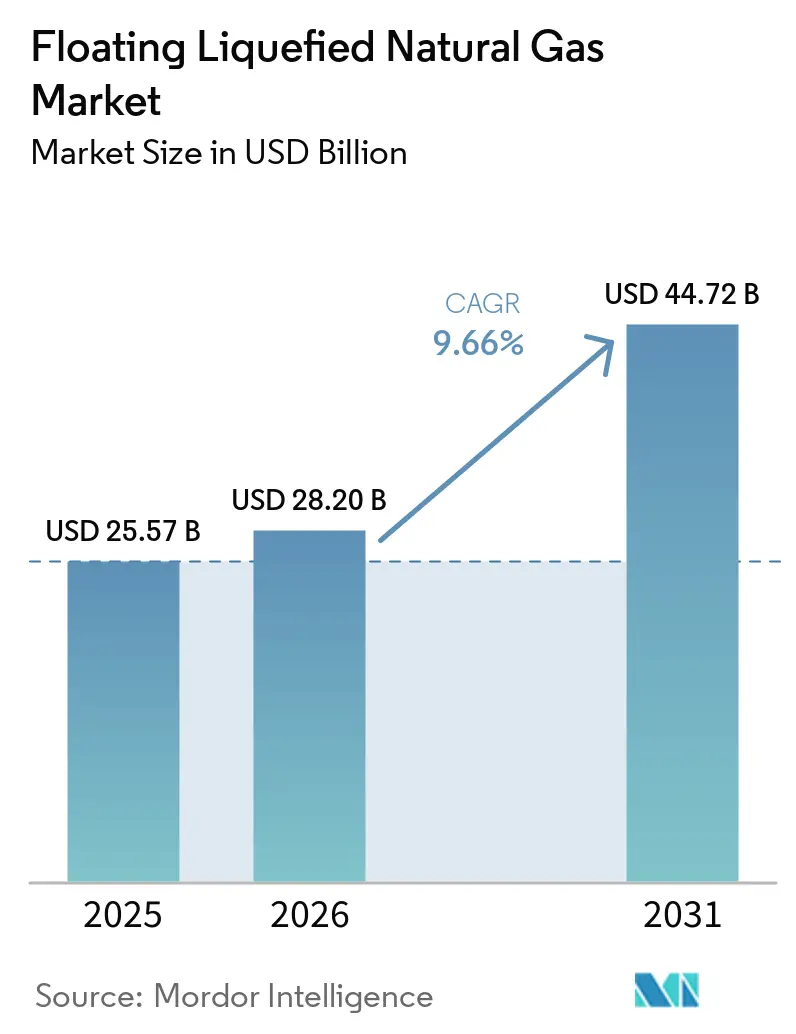
| Market Size (2026) | USD 28.20 Billion |
| Market Size (2031) | USD 44.72 Billion |
| Growth Rate (2026 - 2031) | 9.66% CAGR |
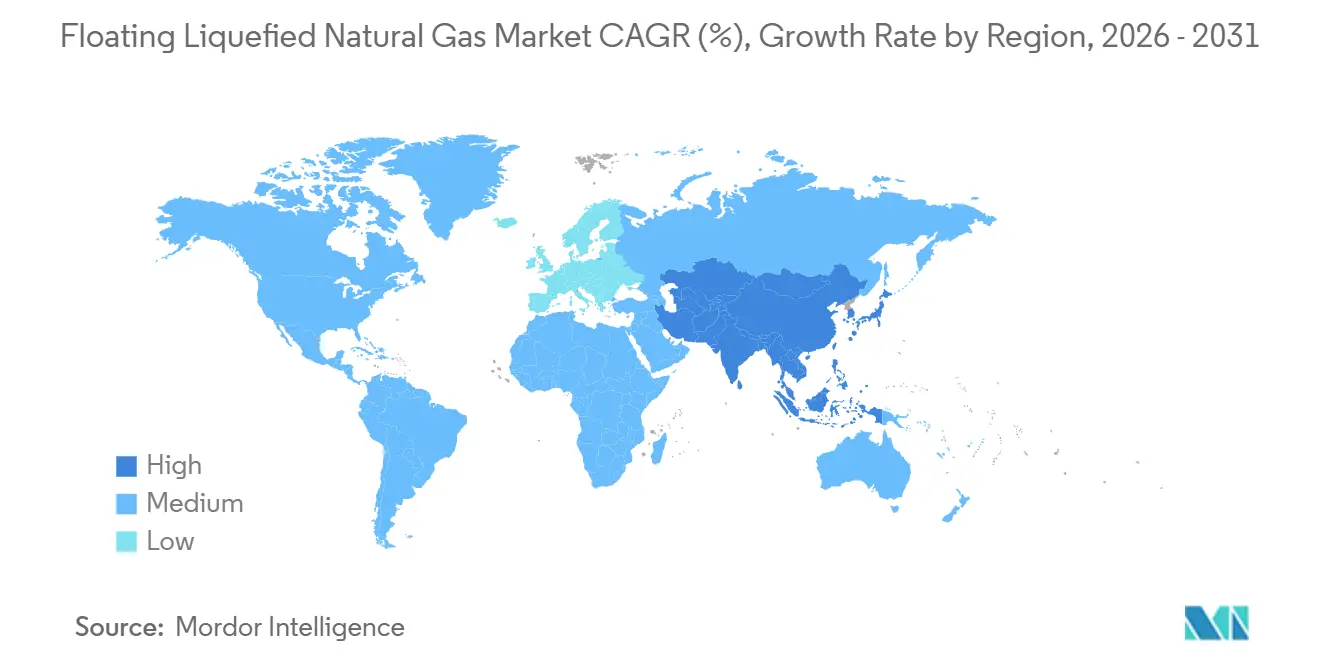
| Fastest Growing Market | Asia Pacific |
| Largest Market | North America |
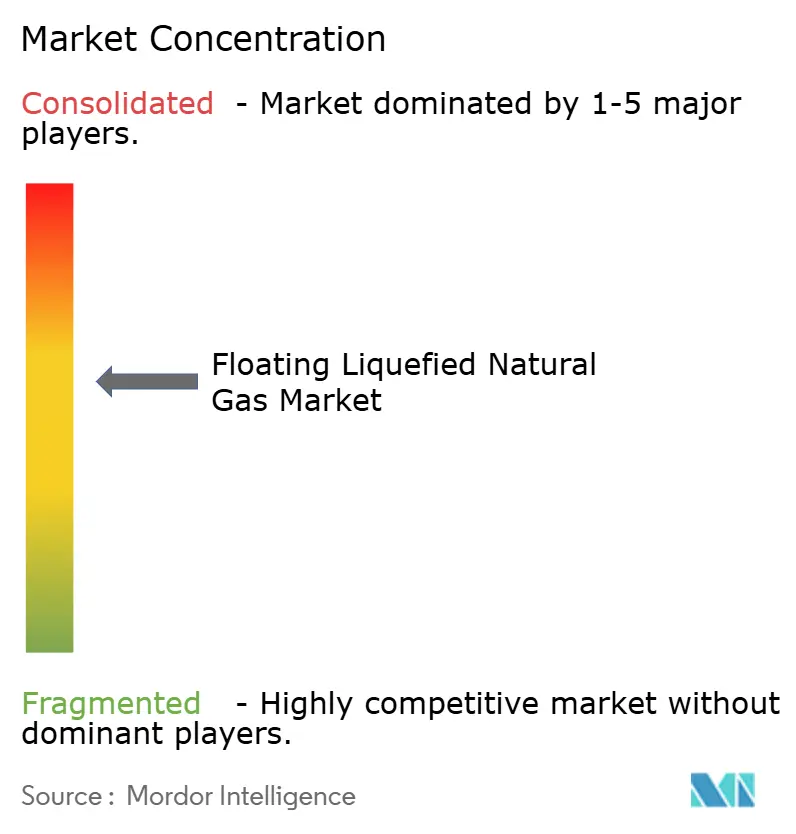
| Market Concentration | Medium |
Major Players *Disclaimer: Major Players sorted in no particular order Image © Mordor Intelligence. Reuse requires attribution under CC BY 4.0. | |
Floating Liquefied Natural Gas Market Analysis by Mordor Intelligence
The Floating Liquefied Natural Gas Market size is projected to be USD 25.57 billion in 2025, USD 28.20 billion in 2026, and reach USD 44.72 billion by 2031, growing at a CAGR of 9.66% from 2026 to 2031. Rising coal-to-gas switching in Asia, Europe’s drive to diversify energy supplies, and cost advantages versus onshore liquefaction are steering new investment toward offshore assets, particularly where environmental permitting for land-based terminals has become protracted. Medium-scale conversions of existing LNG carriers are compressing construction cycles to underline the time-to-market edge that the Floating Liquefied Natural Gas market offers over greenfield onshore projects. Regulatory pressures from the International Maritime Organization and the U.S. Environmental Protection Agency are accelerating adoption of low-emission topside equipment, bolstering the sector’s innovation pipeline. Competitive intensity is rising as specialist providers market tolling models that shift commodity-price risk away from vessel owners toward gas producers, opening white-space opportunities in the Floating Liquefied Natural Gas market for capital-light entrants.
Key Report Takeaways
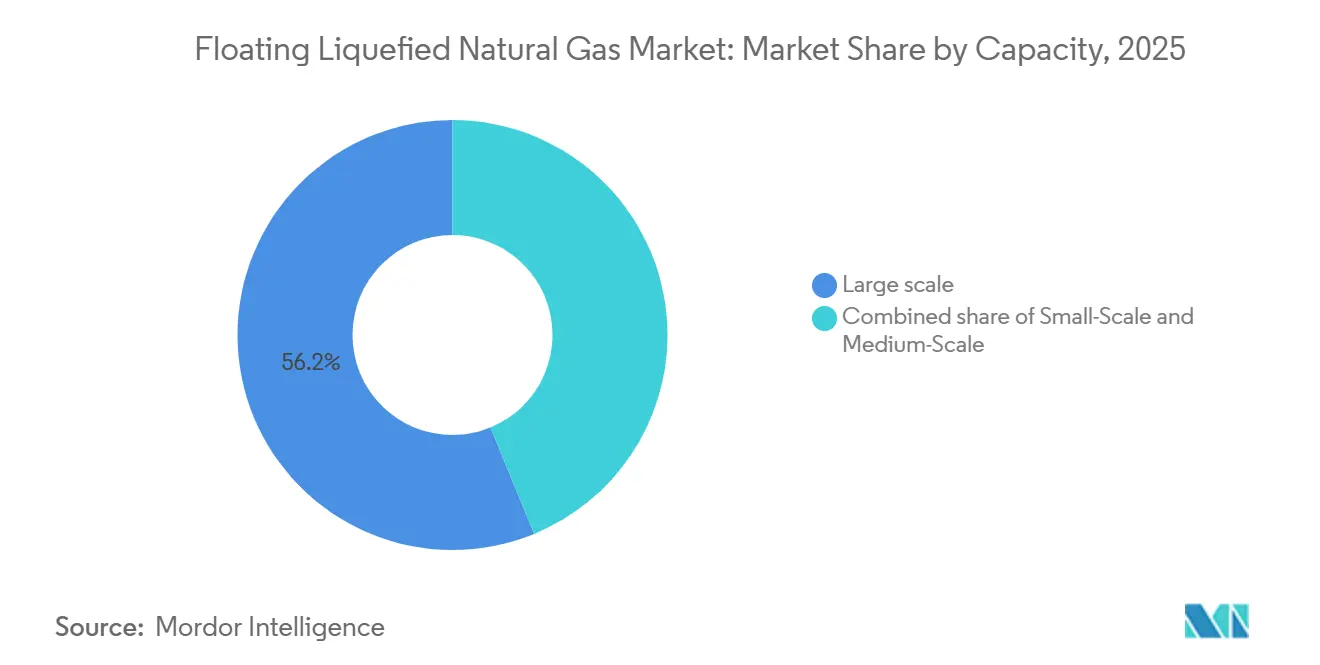
- By capacity, large-scale units above 3 million tpa held 56.2% of the Floating Liquefied Natural Gas market share in 2025, while medium-scale projects are projected to post the quickest 10.2% CAGR through 2031.
- By deployment type, offshore projects commanded 62.1% revenue in 2025, but nearshore installations are expanding at a leading 10.6% CAGR to 2031.
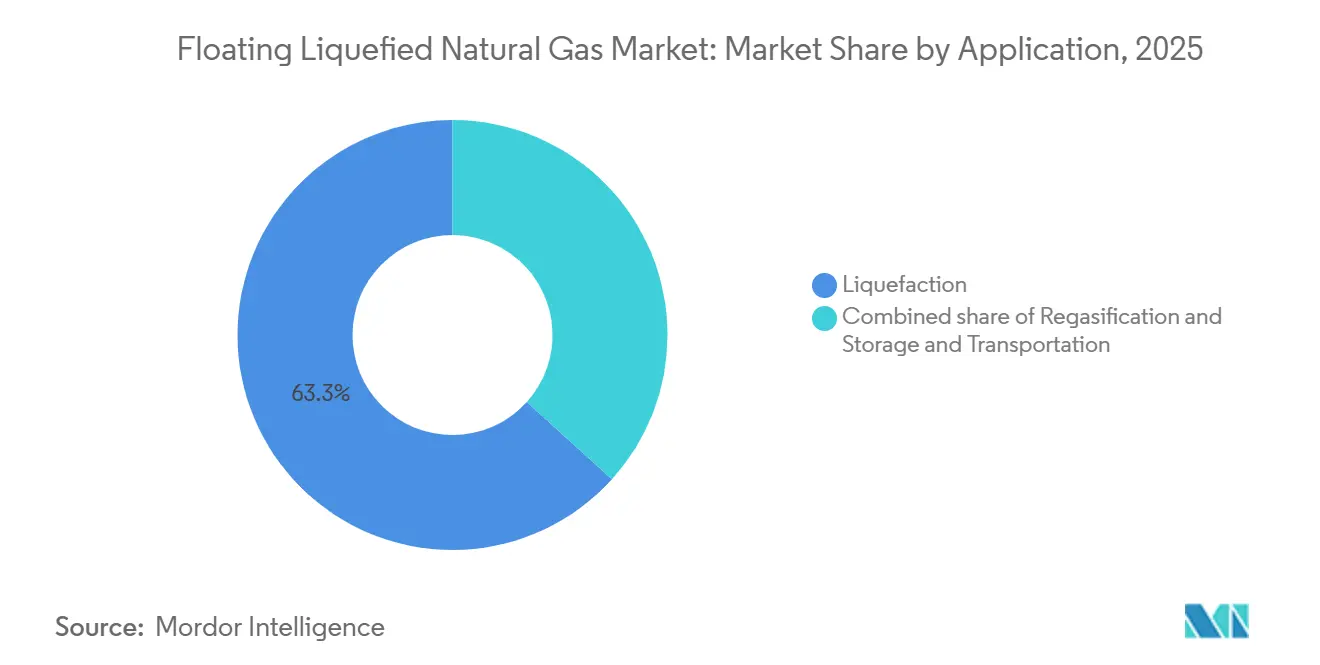
- By application, liquefaction retained 63.3% revenue share in 2025, yet regasification is forecast to grow fastest at 10.9% to 2031.
- By geography, North America captured 33.9% revenue in 2025, whereas Asia-Pacific is the quickest-growing region at 11.3% through 2031.
Note: Market size and forecast figures in this report are generated using Mordor Intelligence’s proprietary estimation framework, updated with the latest available data and insights as of January 2026.
Global Floating Liquefied Natural Gas Market Trends and Insights
Drivers Impact Analysis*
| Driver | (~ ) % Impact on CAGR Forecast | Geographic Relevance | Impact Timeline |
|---|---|---|---|
| Gas-demand surge from coal-to-gas switching | +2.30% | China, India, ASEAN | Medium term (2-4 years) |
| European energy-security push | +1.80% | Europe, spill-over to North Africa | Short term (≤ 2 years) |
| Cost competitiveness versus onshore LNG | +1.50% | Offshore-rich basins worldwide | Long term (≥ 4 years) |
| Faster time-to-market for stranded fields | +1.40% | Middle East, Africa, South America | Medium term (2-4 years) |
| AI-driven coastal power demand | +0.90% | U.S. Gulf Coast, Pacific Northwest, Singapore, Japan | Long term (≥ 4 years) |
| Small-scale e-methanol bunkering demand | +0.70% | Nordic ports, ASEAN bunkering hubs | Long term (≥ 4 years) |
| Source: Mordor Intelligence | |||
Gas-Demand Surge from Coal-to-Gas Switching in Asia
Natural-gas consumption in Asia is projected to rise 5% annually through 2030, creating an outsized call on flexible LNG supply. FLNG units offer Asian buyers strategic diversification beyond pipelines and long-haul cargoes by delivering gas directly from offshore sources to shore without extensive onshore terminals. Their mobility allows re-deployment to new demand nodes as industrial clusters migrate inland. Smaller Asian economies also favor FLNG when conventional import terminals face financing obstacles or land-use opposition, making floating infrastructure a bridge toward lower-emission energy targets. Large-scale deployments near China’s eastern seaboard are complemented by modular units in the Philippines and Vietnam, where grid stability needs quick-turn LNG. The region’s importers are set to absorb 70% of incremental global LNG by 2030, solidifying Asia’s influence over FLNG market dynamics.(1)International Energy Agency, “Gas Market Report Q4 2025,” iea.org
European Energy-Security Push Post-Russia Conflict
European LNG imports climbed to 143 bcm in 2025 on the REPowerEU requirement for 90 days of winter coverage. (2)European Commission, “REPowerEU Progress Update December 2025,” ec.europa.eu Germany commissioned four FSRUs that now liquefy and re-export excess volumes, letting buyers across Poland and the Czech Republic tap floating capacity without new pipelines. National Grid UK is locked in a fifteen-year capacity for three North Sea nearshore FLNG projects to reverse domestic import reliance. Destination-clause acceptance by European offtakers signals a structural shift that underpins the Floating Liquefied Natural Gas market’s long-term visibility. All assets must now pass IEC 62443 cybersecurity certification, lifting technical barriers to entry for new contractors.
Cost Competitiveness of FLNG versus On-Shore LNG
Average capital intensity for sanctioned FLNG averaged USD 850 per tonne between 2023 and 2025, a 29% discount versus onshore build. Golar’s Hilli Episeyo conversion cost USD 1.2 billion and finished in 36 months, while a comparable land terminal in Cameroon overspent by USD 3.8 billion and took seven years. Shell’s Prelude lifted LNG at USD 3.50 /MMBtu in 2025, beating onshore labor-intensive plants at USD 4.20. In shallow water, however, shared utilities can narrow the gap, highlighting the geography-specific nature of cost savings in the Floating Liquefied Natural Gas market. The International Association of Oil & Gas Producers pegs the breakeven Brent price at USD 55 for most projects, a threshold met by two-thirds of developments as of March 2026.
Faster Time-to-Market for Stranded Offshore Gas Fields
Eni’s Coral Norte, sanctioned in October 2025, will monetize 16 tcf of gas by 2028 after sidestepping a USD 20 billion onshore build and cutting the schedule to three years. Indonesia’s first FLNG bypassed a five-year environmental review, slashing development to four years. Argentina’s dual-vessel plan will ship its first cargo in 2027, unlocking Vaca Muerta shale trapped by pipeline limits. Shorter cycles allow promoters to lock fiscal terms before elections can alter royalties. A World Bank tally shows 340 tcf of discoveries remain uneconomic onshore, representing a USD 180 billion upside for the Floating Liquefied Natural Gas market once modular hulls cut capex by another 15%.
Restraints Impact Analysis*
| Restraint | (~) % Impact on CAGR Forecast | Geographic Relevance | Impact Timeline |
|---|---|---|---|
| High CAPEX and financing risk profile | -1.20% | Global, acute in frontier markets | Short term (≤ 2 years) |
| LNG price-cycle volatility delaying FIDs | -0.90% | North America, Middle East, global sensitivity | Medium term (2-4 years) |
| Tightening methane-slip regulation | -0.60% | Europe, North America, Australia | Long term (≥ 4 years) |
| Skilled-labor shortages in cryogenic yards | -0.50% | South Korea, China, Singapore, Norway | Medium term (2-4 years) |
| Source: Mordor Intelligence | |||
High CAPEX And Financing Risk Profile
Prelude’s final bill reached USD 17 billion, double its sanction estimate, after corrosion issues forced re-work. (3)Shell plc, “2024 Form 20-F,” shell.com Mozambique LNG’s 2021 suspension stranded USD 23 billion, making lenders wary of adjacent FLNG without sovereign guarantees. Commercial banks now demand 1.4× debt-service coverage, achievable only with long-term oil-linked contracts above USD 60 Brent. Japanese and Korean export-credit agencies supplied USD 6.8 billion of guarantees in 2025, but sub-BB-sovereigns were ineligible, excluding 40% of frontier prospects. Tolling agreements curb price risk for owners yet expose them to volume risk if reservoirs underperform, pressuring cash flows in the Floating Liquefied Natural Gas market.
LNG Price-Cycle Volatility Delaying FIDs
Henry Hub futures swung between USD 2.10 and USD 6.80 /MMBtu in 2025, leaving eight projects unfunded without firm offtake. (4)CME Group, “Henry Hub Futures Historical Data 2025,” cmegroup.com Asian spot LNG plunged from USD 18.50 in January 2025 to USD 9.20 in December, erasing arbitrage margins that justify new capacity. Delfin’s four-vessel plan remains pre-FID because buyers want sub-10-year terms, too short to service USD 2.8 billion per-unit debt. The IEA sees a 50 million-tonne surplus by 2027 turning to a 30 million-tonne deficit by 2030, reinforcing boom-bust risk in the Floating Liquefied Natural Gas market. Modular trains that can be idled and restarted within 90 days now feature in most front-end engineering packages, trimming fixed costs by 18%.
*Our forecasts treat driver/restraint impacts as directional, not additive. The impact forecasts reflect baseline growth, mix effects, and variable interactions.
Segment Analysis
By Capacity: Large-Scale Dominance Amid Modular Innovation
Large-scale platforms above 3 million tpa secured 56.2% of the Floating Liquefied Natural Gas market share in 2025. High throughput spreads hull amortization across more cargoes, anchoring the Floating Liquefied Natural Gas market size advantage that majors wield when negotiating long-term contracts. Prelude, PFLNG Dua, and Coral Sul together loaded 11.7 million tonnes in 2025, capturing Asian premiums of USD 0.80 /MMBtu over Henry Hub-linked supply. Yet the steep capital bill and charter lock-ins spur interest in medium-scale units that can relocate as reservoirs deplete. Golar’s conversion model delivers such flexibility by repurposing mid-life carriers, slicing build time to 38 months, and offering operators an option to redeploy toward fresh gas hubs as regional demand pivots, strengthening the resilience of the Floating Liquefied Natural Gas market.
Medium-scale assets between 1 and 3 million tpa are expanding, where 200-meter depths let jack-up rigs perform maintenance, trimming offshore labor by 22%. Small-scale units under 1 million tpa cater to emerging e-methanol bunkering and island grids. Hyundai’s 0.6-million-tpa standard design costs USD 480 million, 40% cheaper per tonne than custom mega-hulls. Classification societies now require dual-fuel propulsion on units above 2.5 million tpa, adding USD 180 million but unlocking EU Taxonomy financing. As digital twins optimize production uptime, capacity choice is shifting from a pure economies-of-scale decision toward a portfolio-risk calculus that balances utilization, redeployment agility, and compliance costs within the Floating Liquefied Natural Gas market.


By Deployment Type: Nearshore Gains Traction
Offshore deepwater projects claimed 62.1% revenue in 2025, reflecting the Floating Liquefied Natural Gas market’s roots in remote basins like Australia and Mozambique, where subsea tiebacks exceed 50 km. These projects monetize reserves previously written off as stranded, justifying high-capacity hulls moored in 1,000-meter waters. However, nearshore developments within 20 km of the coastline are scaling at a 10.6% CAGR, buoyed by lower logistics costs and easier crew access. By operating in 45-meter Gulf of Mexico waters, Delfin’s planned unit foresees annual opex savings of USD 28 million over helicopter-supplied offshore peers.
Indonesia streamlined coastal-zone approvals to nine months, enabling West Papua’s 1.2-million-tpa unit to achieve financial close in March 2025. Nearshore designs leverage submarine power cables to cut onboard diesel use and integrate fiber-optic control, shrinking crew counts by 60%. Still, fields with high CO₂ content favor offshore venting solutions that avoid stricter atmospheric limits near shorelines. Thus, deployment decisions in the Floating Liquefied Natural Gas market increasingly hinge on both reservoir chemistry and host-country permitting efficiency rather than water depth alone.
By Application: Regasification Outpaces Liquefaction Growth
Liquefaction maintained 63.3% revenue share in 2025, reflecting the Floating Liquefied Natural Gas market size leadership of production-oriented assets. Yet retrofitted FSRUs now lead growth as utilities seek bidirectional hubs capable of importing spot cargoes and re-exporting surplus to neighboring grids. Germany’s fourth FSRU, upgraded with small liquefaction skids, became Europe’s first floating hub able to swing between import and export modes, bypassing a USD 600 million pipeline reversal.
Open-rack vaporizers that forego seawater intake are gaining favor among regasification units in environmentally sensitive zones, broadening acceptability with stakeholders concerned about marine ecosystems. Mixed-refrigerant mini-trains permit rolling maintenance without full plant shutdowns, sacrificing 12% thermal efficiency to sustain 95% uptime—an attractive trade-off for utilities prioritizing flexibility. Hybrid import-export vessels now post 22% higher utilization than single-purpose assets, underscoring the market’s pivot toward optionality and turning the Floating Liquefied Natural Gas market share calculus increasingly toward regasification-enabled configurations.
Geography Analysis
North America anchored 33.9% of global revenue in 2025 as U.S. Gulf Coast producers leveraged Henry Hub feedgas priced USD 3.20 below Asian spot benchmarks, underpinning competitive delivered costs to Tokyo. New Fortress Energy’s Fast LNG loaded 1.4 million t in its first full year and aims to replicate the design for three more Gulf platforms. A January 2026 British Columbia proposal seeks to ship Montney shale gas to Japan under 15-year JKM-indexed deals. Mexico is weighing nearshore units to liquefy associated gas in the Bay of Campeche, cutting flaring that hit 18 bcm in 2024.
Asia-Pacific is the fastest-growing Floating Liquefied Natural Gas market, expanding at 11.3% through 2031, with Australia, Indonesia, and Malaysia sanctioning 7.8 million tpa in 2025. Woodside’s Browse FLNG will deploy a 3.5-million-tpa platform by 2029 after land opposition stalled the original onshore plan. Indonesia granted four FLNG licenses across the Natuna and Masela fields to serve its archipelago’s dispersed power demand. Malaysia is constructing a third PFLNG that expects an 18% capex-per-tonne saving through modularization. India’s ONGC is engineering a 1.8-million-tpa vessel for the Krishna-Godavari Basin to displace spot cargo imports priced at USD 12 /MMBtu.
Europe’s share remains modest yet strategically important as floating regas hubs backfill Russian pipeline deficits. National Grid UK awarded 15-year contracts to three North Sea nearshore projects that will liquefy domestic gas for export to continental buyers by 2029. Germany’s quartet of FSRUs functions as seasonal bidirectional hubs, exporting to Poland and the Czech Republic during shoulder months. Nordic ports are piloting small-scale FLNG for e-methanol bunkering, with a 0.8-million-tpa unit slated for Norway. Spain and France unlocked interconnector access parity for floating operators in March 2025 under the revised EU Gas Directive, widening arbitrage prospects. Sanctions continue to delay Russia’s two planned Arctic FLNG units, deferring 6.6 million tpa until after 2028.

Competitive Landscape
Moderate concentration defines the Floating Liquefied Natural Gas market. Their vertically integrated models span upstream reserves, midstream liquefaction, and downstream portfolios, allowing cross-segment margin optimization. Shell’s Prelude simultaneously feeds Japanese long-term contracts and Asian spot cargoes to smooth cash flow.
Specialist operators such as Golar LNG and New Fortress Energy are carving niches via tolling contracts that transfer price exposure to producers and emphasize schedule acceleration. Golar’s charter backlog climbed USD 3.2 billion after the October 2025 Argentina deal, illustrating demand for relocatable medium-scale assets. Fabricators Technip Energies, Samsung Heavy Industries, and Hyundai Heavy Industries are consolidating hull design, reducing per-tonne capex by 18% and creating scale barriers for yards without modular portfolios.
Technology is differentiating emerging contenders. SBM Offshore’s 95% CO₂-capture membrane aims to align cargoes with the EU Carbon Border Adjustment Mechanism, an advantage once tariffs start in 2027. Höegh LNG’s AI maintenance suite has trimmed unplanned downtime by 12%, a key metric under availability-linked tolling models. DNV and Lloyd’s Register tightened ice-class requirements in 2025, favoring incumbents with Arctic fabrication experience and raising the technical hurdle for new entrants.
Floating Liquefied Natural Gas Industry Leaders
Petronas
Shell
Golar LNG
Eni SpA
Höegh LNG
- *Disclaimer: Major Players sorted in no particular order

Recent Industry Developments
- March 2026: Petronas has awarded a USD 2 billion engineering, procurement, and construction contract to Samsung Heavy Industries and JGC Corporation for a 2-million-tonne-per-annum nearshore FLNG at the SOGIP field offshore Malaysia. Operations are scheduled to commence by the end of 2027. The project utilizes modular topside fabrication, reducing construction time by six months compared to earlier PFLNG units.
- May 2025: MHI and partners launched methane-slip reduction trials on LNG vessels as EU rules tighten emissions thresholds.
- March 2025: Eni’s Nguya FLNG is scheduled to sail from China in September 2025, adding 2.4 mtpa to Congo LNG.
- October 2024: Wison New Energies and Kumul Petroleum signed a pre-FEED contract for Papua New Guinea’s first FLNG at 1.5 mtpa.


Global Floating Liquefied Natural Gas Market Report Scope
Floating liquefied natural gas (FLNG) refers to an offshore facility that extracts, processes, and liquefies natural gas from subsea fields. It enables the transfer of liquefied natural gas (LNG) to transport vessels. FLNG facilities are considered more cost-effective than onshore facilities, as they involve lower capital and operational expenses and provide flexibility for site relocation.
The Floating Liquefied Natural Gas Market is segmented into capacity, deployment type, application, and geography. By capacity, the market is segmented into small-scale (below 1 MTPA), medium-scale (1–3 MTPA), and large-scale (above 3 MTPA). By deployment type, the market is segmented into offshore and near-shore. By application, the market is segmented into liquefaction, regasification, and storage and transportation. The report also covers the market size and forecasts for the floating liquefied natural gas market in 20 countries across major regions. For each segment, the market sizing and forecasts have been done on the basis of value (USD).
| Small-Scale (Below 1 MTPA) |
| Medium-Scale (1 to 3 MTPA) |
| Large-Scale (Above 3 MTPA) |
| Offshore |
| Near-shore |
| Liquefaction |
| Regasification |
| Storage and Transportation |
| North America | United States |
| Canada | |
| Mexico | |
| Europe | United Kingdom |
| Germany | |
| France | |
| Spain | |
| Nordic Countries | |
| Russia | |
| Rest of Europe | |
| Asia-Pacific | China |
| India | |
| Japan | |
| South Korea | |
| ASEAN Countries | |
| Australia and New Zealand | |
| Rest of Asia-Pacific | |
| South America | Brazil |
| Argentina | |
| Colombia | |
| Rest of South America | |
| Middle East and Africa | United Arab Emirates |
| Saudi Arabia | |
| South Africa | |
| Egypt | |
| Rest of Middle East and Africa |
| By Capacity | Small-Scale (Below 1 MTPA) | |
| Medium-Scale (1 to 3 MTPA) | ||
| Large-Scale (Above 3 MTPA) | ||
| By Deployment Type | Offshore | |
| Near-shore | ||
| By Application | Liquefaction | |
| Regasification | ||
| Storage and Transportation | ||
| By Geography | North America | United States |
| Canada | ||
| Mexico | ||
| Europe | United Kingdom | |
| Germany | ||
| France | ||
| Spain | ||
| Nordic Countries | ||
| Russia | ||
| Rest of Europe | ||
| Asia-Pacific | China | |
| India | ||
| Japan | ||
| South Korea | ||
| ASEAN Countries | ||
| Australia and New Zealand | ||
| Rest of Asia-Pacific | ||
| South America | Brazil | |
| Argentina | ||
| Colombia | ||
| Rest of South America | ||
| Middle East and Africa | United Arab Emirates | |
| Saudi Arabia | ||
| South Africa | ||
| Egypt | ||
| Rest of Middle East and Africa | ||


Key Questions Answered in the Report
How large is the Floating Liquefied Natural Gas market today and where is it heading?
The market stands at USD 28.20 billion in 2026 and is projected to reach USD 44.72 billion by 2031 at a 9.66% CAGR.
Which region shows the fastest growth in Floating LNG adoption?
Asia-Pacific posts the quickest 11.3% CAGR as Australia, Indonesia, and Malaysia sanction new capacity.
What segment holds the largest Floating LNG market share?
Large-scale units above 3 million tpa led with 56.2% share in 2025 due to economies of scale.
Why are nearshore FLNG projects gaining traction?
Shallow-water locations cut logistics costs, simplify permitting, and enable submarine power links that lower opex.
How does regasification compare with liquefaction growth?
Regasification-oriented vessels are expanding at 10.9% annually as Europe and Asia convert idle FSRUs into bidirectional hubs.
What is the main financing barrier for new FLNG projects?
High up-front capex and price-cycle volatility force lenders to seek stringent debt-coverage ratios and long-term contracts.
Page last updated on:


